Financial Analysis of JB Hi-Fi Company: Performance and Ratios
VerifiedAdded on 2021/06/16
|26
|3764
|81
Report
AI Summary
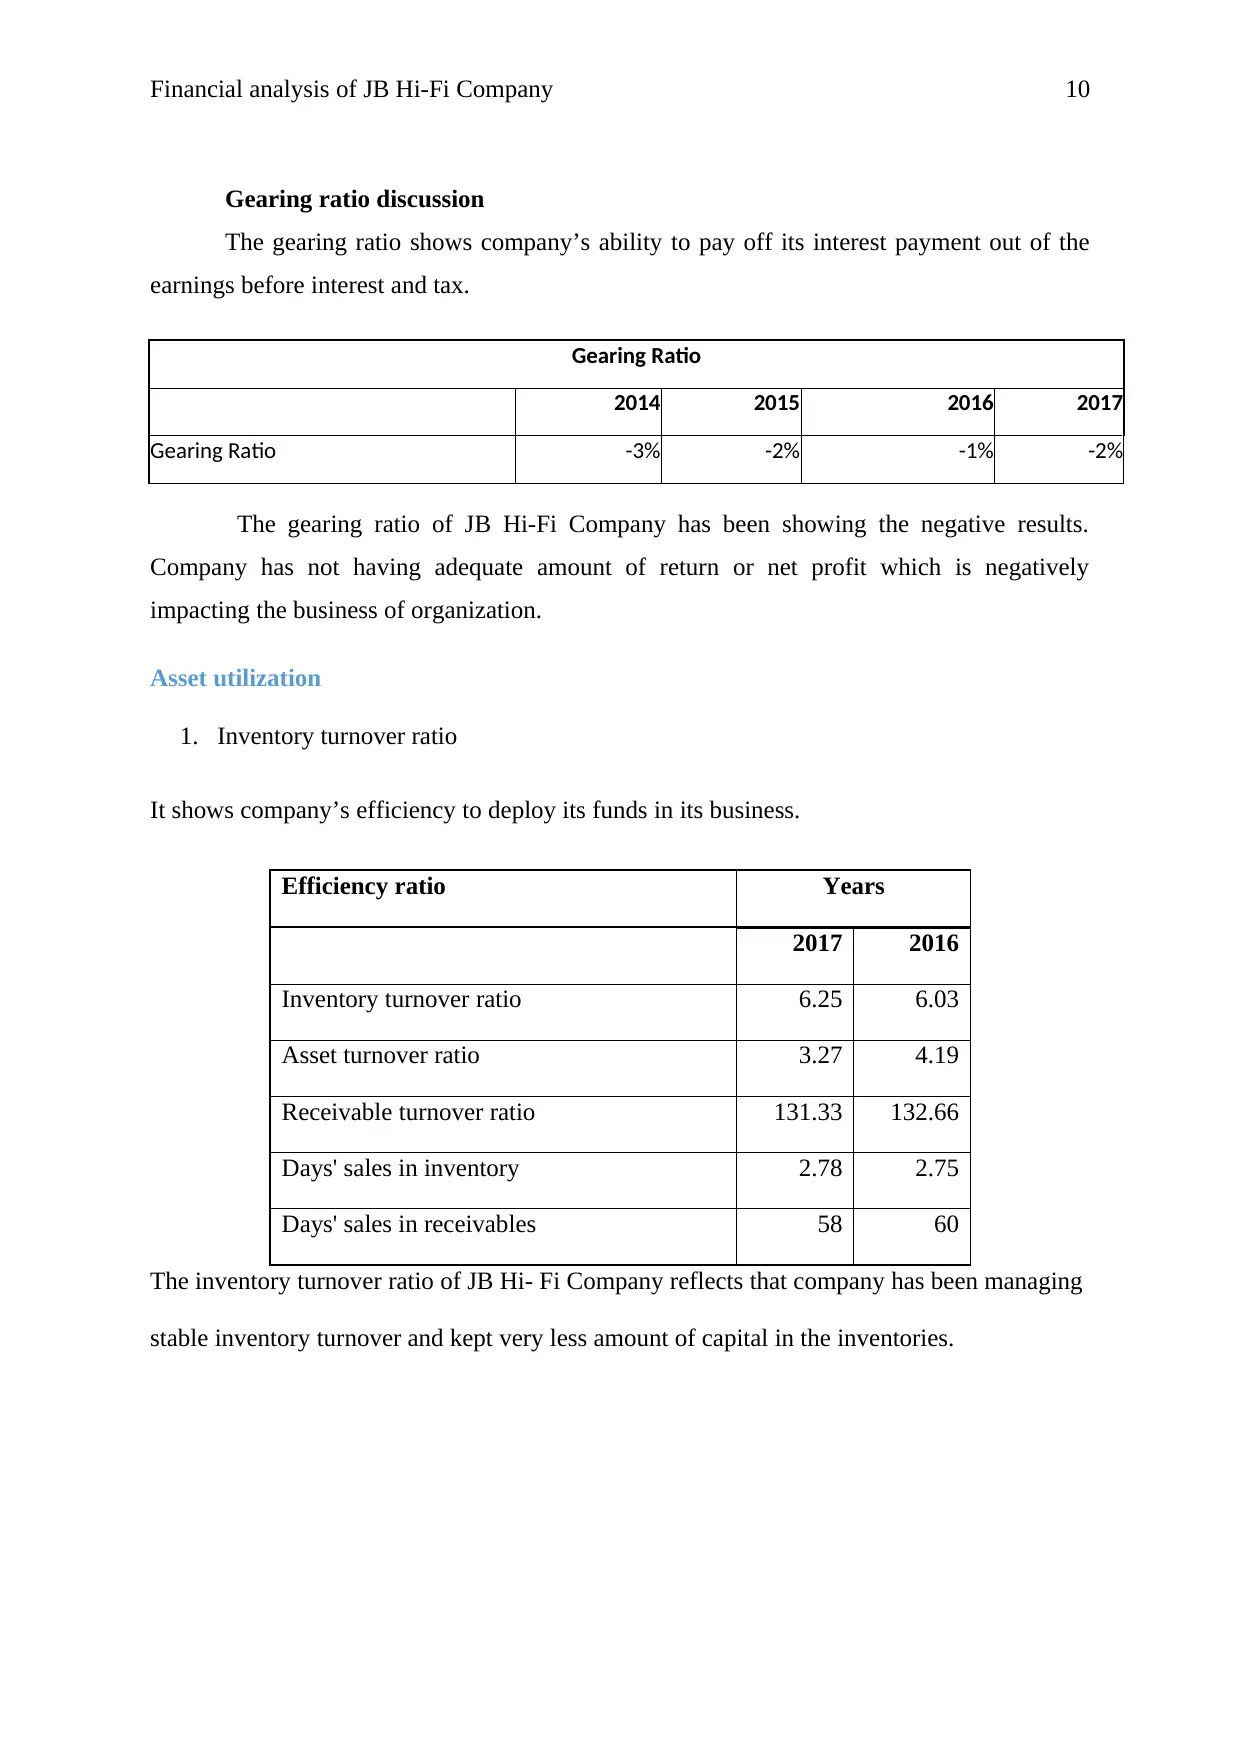
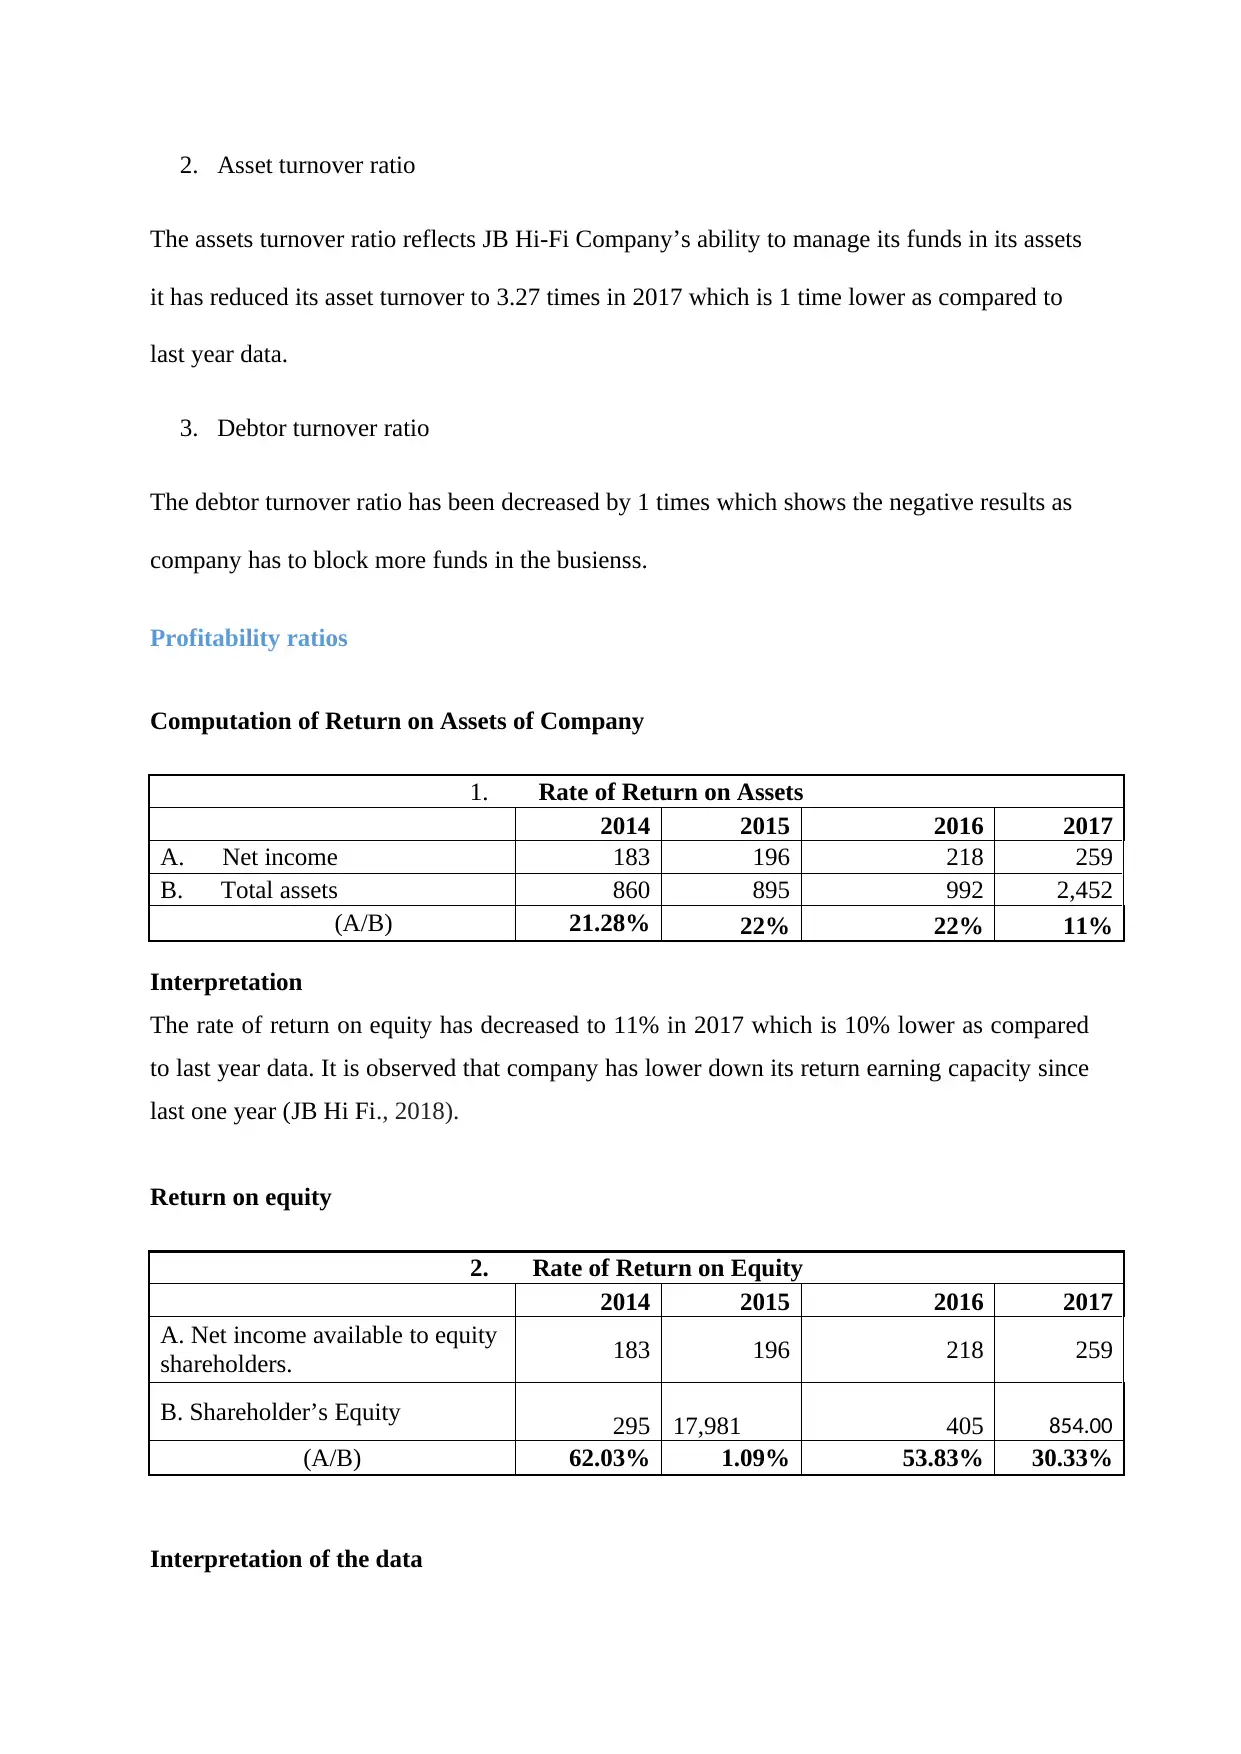
This report provides a comprehensive financial analysis of JB Hi-Fi Company, examining its performance over several years. It begins with a description of the company and its governance structure, including key shareholders and management. The core of the report focuses on a detailed ratio analysis, covering liquidity, solvency, asset utilization, and profitability ratios. The analysis includes calculations of current and quick ratios, debt-to-equity, gearing ratios, inventory and asset turnover, and return on assets and equity. The report also explores the company's share price movement, announcements impacting the stock, and the application of the CAPM method to determine the required rate of return. Investment methods are discussed, considering factors like WACC and debt ratios. The report concludes with a letter of recommendation and references, offering insights into JB Hi-Fi's financial health and investment potential. The report highlights the company's strengths and weaknesses based on the financial data provided, offering a critical assessment of its performance and financial leverage.

RUNNING HEAD: Financial analysis of JB Hi-Fi Company
0
JB Hi-Fi Company
Finance For Business
[Type the document subtitle]
Vijay and Narendra
University Name
0
JB Hi-Fi Company
Finance For Business
[Type the document subtitle]
Vijay and Narendra
University Name
Paraphrase This Document
Need a fresh take? Get an instant paraphrase of this document with our AI Paraphraser

Table of Contents
Introduction...........................................................................................................................................3
1. Description of National Australian Bank...................................................................................3
2. Governance and Ownership structure............................................................................................4
3. Performance ratio analysis of National Australian Bank...............................................................5
4. The share price graph reflecting movement in the share price of National Australian Bank........10
4.1 Graph reflecting the movement in the share price of National Australian Bank............................10
4.2 Comparison between movement in the share price of National Australian Bank and share price
return of the all ordinary stock exchange.............................................................................................10
5. Announcements...........................................................................................................................11
6. Research via internet....................................................................................................................12
6.2 Computation of required rate of return by using CAPM method...............................................13
6.3 Determining the investment method (Conservative investment)................................................14
7. Weighted average Cost of Capital...............................................................................................14
7.1 Computing cost of Equity using CAPM method..................................................................14
7.2 Implications that a higher WACC on investment decision........................................................15
8. Debt ratio consideration of National Australian Bank.................................................................16
8.1 Stable Debt to equity ratio of the company....................................................................................16
8.2 Gearing ratio discussion.............................................................................................................17
9. Divided policies of the company.................................................................................................17
10. Letter of recommendation........................................................................................................18
11. Conclusion...............................................................................................................................19
12. References...............................................................................................................................20
13. Appendix.................................................................................................................................22

Financial analysis of JB Hi-Fi Company 2
Introduction
With the ramified economic changes and complex business structure, each and every
investor should use financial analysis tools before making investment decision. These
financial analysis tools assist in evaluating financial performance of company. There are
several financial tools such as ratio analysis, bottom up analysis, cash flow analysis and top
down analysis. This analysis is used to evaluate the past and determine the future trend of
company. In this report, JB Hi-Fi Company has been considered to provide the
recommendation to investor and directors of company regarding the financial leverage and
financial performance.
1. Description of JB Hi-Fi Company
JB Hi-Fi Company is Australia and New Zealand retail consumer goods specialised in video
games, Ultra blue rays, DVD and CD players and other home appliance seller.
The stock price movement of company is A$ 23.51 +0.11 (+0.47%) which shows the positive
increment for the investors in their investment. The main Headquartered of company is in
Chadstone, Australia. The current CEO of company is Richard Murray.
⊘ This is a preview!⊘
Do you want full access?
Subscribe today to unlock all pages.

Trusted by 1+ million students worldwide

2. Governance and Ownership structure
These below are the persons who are the key shareholders of the JB Hi-Fi Company who
owns highest shares.
(Yahoo finance, 2017)
The table above given shows the highest numbers of shareholder investors who have invested
their capital in JB Hi-Fi Company.
(Yahoo finance, 2017)
These below are the persons who are the key shareholders of the JB Hi-Fi Company who
owns highest shares.
(Yahoo finance, 2017)
The table above given shows the highest numbers of shareholder investors who have invested
their capital in JB Hi-Fi Company.
(Yahoo finance, 2017)
Paraphrase This Document
Need a fresh take? Get an instant paraphrase of this document with our AI Paraphraser

Financial analysis of JB Hi-Fi Company 4
The governance structure of JB Hi-Fi Company reflects the compliance program which
company has undertaken to comply with the all the rules and regulations.
(Yahoo finance, 2017)
Key managerial person
The governance structure of JB Hi-Fi Company reflects the compliance program which
company has undertaken to comply with the all the rules and regulations.
(Yahoo finance, 2017)
Key managerial person

The present CEO of JB Hi FI Company is Richard Murray
Name Age Since Current Position
Gregory Richards 2012 Non-Executive Chairman of the Board
Richard Murray 2015 Chief Executive Officer, Executive Director
Nick Wells Chief Financial Officer
Simon Page 2015 Chief Information Officer
Cameron Trainor 2016 Managing Director
Tim Carter 62 2015 Supply Chain & JB Hi-Fi Solutions Director
Peter Green 2010 Operations Director
James Saretta 2016 Strategy & Digital Director
Terry Smart 2016 Managing Director – The Good Guys
Douglas Smith 51 2012 Company Secretary
Stephen Goddard 2016 Non-Executive Director
Beth Laughton 2011 Non-Executive Director
Mark Powell 55 2017 Non-Executive Director
⊘ This is a preview!⊘
Do you want full access?
Subscribe today to unlock all pages.

Trusted by 1+ million students worldwide

Financial analysis of JB Hi-Fi Company 6
Wai Tang 2015 Non-Executive Director
Richard Uechtritz 2011 Non-Executive Director
(JB Hi-Fi Company)
3. Performance ratio analysis of the JB Hi-Fi Company
This ratio analysis is used to evaluate the financial performance of JB Hi-Fi Company since
last two years
Financial information of JB Hi-Fi Company
JB Hi-Fi Limited (JBH.AX)
Particulars (Amount in Million 2014 2015 2016
201
7
AUD$
AUD
$
AUD
$
EBIT -300 -302 -322 -486
Interest 9 6 4 11
Net profit 183 196 218 259
Total Assets 860 895 992 2,452
Total Liabilities 565 552 588 1,599
Shareholders' Equity 295 343 405 854
Short term solvency ratio
1. Current ratio
The current ratio evaluates the JB Hi-Fi Company’s ability to pay off its short term and long
term debts. This ratio shows that company has been increasing its investment in its current
assets which is consistently increasing the overall output and production level.
Liquidity ratio Years
2017 2016
Current ratio 1.57 1.32
Paraphrase This Document
Need a fresh take? Get an instant paraphrase of this document with our AI Paraphraser

Quick ratio .34 30
Interpretation
It shows that JB Hi-Fi Company has lower down its investment in the current assets which
has reduced its current ratio to 1.32 points in 2017. It is .20 points lower as compared to last
year data.
The quick ratio of company is also too low which depicts that company has kept very less
investment in the current assets other than inventories (JB Hi-Fi Company. 2015). The quick
ratio has shown the slight changes which reflect that company needs to increase its
investment in its inventory if it wants to increase the production level as per the clients need
in market.

Financial analysis of JB Hi-Fi Company 8
Proving the equation
Providing equation 2014 2015 2016 2017
Net profit After tax/OE 0.55154
0.47597938
5 0.42241 0.34557
EBIT/TA*NPAT/EBIT*TA/OE 0.55154
0.47597938
5 0.42241 0.34557
.
Long term Solvency ratios
Debt to equity
The debt to equity shows company’s financial leverage which will demonstrate the
financial risk of the business.
Computation of debt to equity of Company
3. Debt Ratio
2014 2015 2016 2017
A. Total Liabilities 565 552 588 1599
B. Total assets 860 895 992 2,452.00
(A/B) 66% 62% 59% 65%
Interpretation
The debt ratio of company has been stable since last five years. However, in 2017, JB
Hi-Fi Company had 65% debt to equity which is 6% higher as compared to last year data. ,
JB Hi-Fi Company is having higher financial leverage.
⊘ This is a preview!⊘
Do you want full access?
Subscribe today to unlock all pages.

Trusted by 1+ million students worldwide

Paraphrase This Document
Need a fresh take? Get an instant paraphrase of this document with our AI Paraphraser

Financial analysis of JB Hi-Fi Company 10
Gearing ratio discussion
The gearing ratio shows company’s ability to pay off its interest payment out of the
earnings before interest and tax.
Gearing Ratio
2014 2015 2016 2017
Gearing Ratio -3% -2% -1% -2%
The gearing ratio of JB Hi-Fi Company has been showing the negative results.
Company has not having adequate amount of return or net profit which is negatively
impacting the business of organization.
Asset utilization
1. Inventory turnover ratio
It shows company’s efficiency to deploy its funds in its business.
Efficiency ratio Years
2017 2016
Inventory turnover ratio 6.25 6.03
Asset turnover ratio 3.27 4.19
Receivable turnover ratio 131.33 132.66
Days' sales in inventory 2.78 2.75
Days' sales in receivables 58 60
The inventory turnover ratio of JB Hi- Fi Company reflects that company has been managing
stable inventory turnover and kept very less amount of capital in the inventories.

2. Asset turnover ratio
The assets turnover ratio reflects JB Hi-Fi Company’s ability to manage its funds in its assets
it has reduced its asset turnover to 3.27 times in 2017 which is 1 time lower as compared to
last year data.
3. Debtor turnover ratio
The debtor turnover ratio has been decreased by 1 times which shows the negative results as
company has to block more funds in the busienss.
Profitability ratios
Computation of Return on Assets of Company
1. Rate of Return on Assets
2014 2015 2016 2017
A. Net income 183 196 218 259
B. Total assets 860 895 992 2,452
(A/B) 21.28% 22% 22% 11%
Interpretation
The rate of return on equity has decreased to 11% in 2017 which is 10% lower as compared
to last year data. It is observed that company has lower down its return earning capacity since
last one year (JB Hi Fi., 2018).
Return on equity
2. Rate of Return on Equity
2014 2015 2016 2017
A. Net income available to equity
shareholders. 183 196 218 259
B. Shareholder’s Equity 295 17,981 405 854.00
(A/B) 62.03% 1.09% 53.83% 30.33%
Interpretation of the data
⊘ This is a preview!⊘
Do you want full access?
Subscribe today to unlock all pages.

Trusted by 1+ million students worldwide
1 out of 26
Related Documents

Your All-in-One AI-Powered Toolkit for Academic Success.
+13062052269
info@desklib.com
Available 24*7 on WhatsApp / Email
Unlock your academic potential
Copyright © 2020–2025 A2Z Services. All Rights Reserved. Developed and managed by ZUCOL.