Analyzing JB HI-FI's Financial Performance: A Cash Flow & Ratio Report

Verified

Added on  2023/06/08

|8
|2068
|151
Report
AI Summary
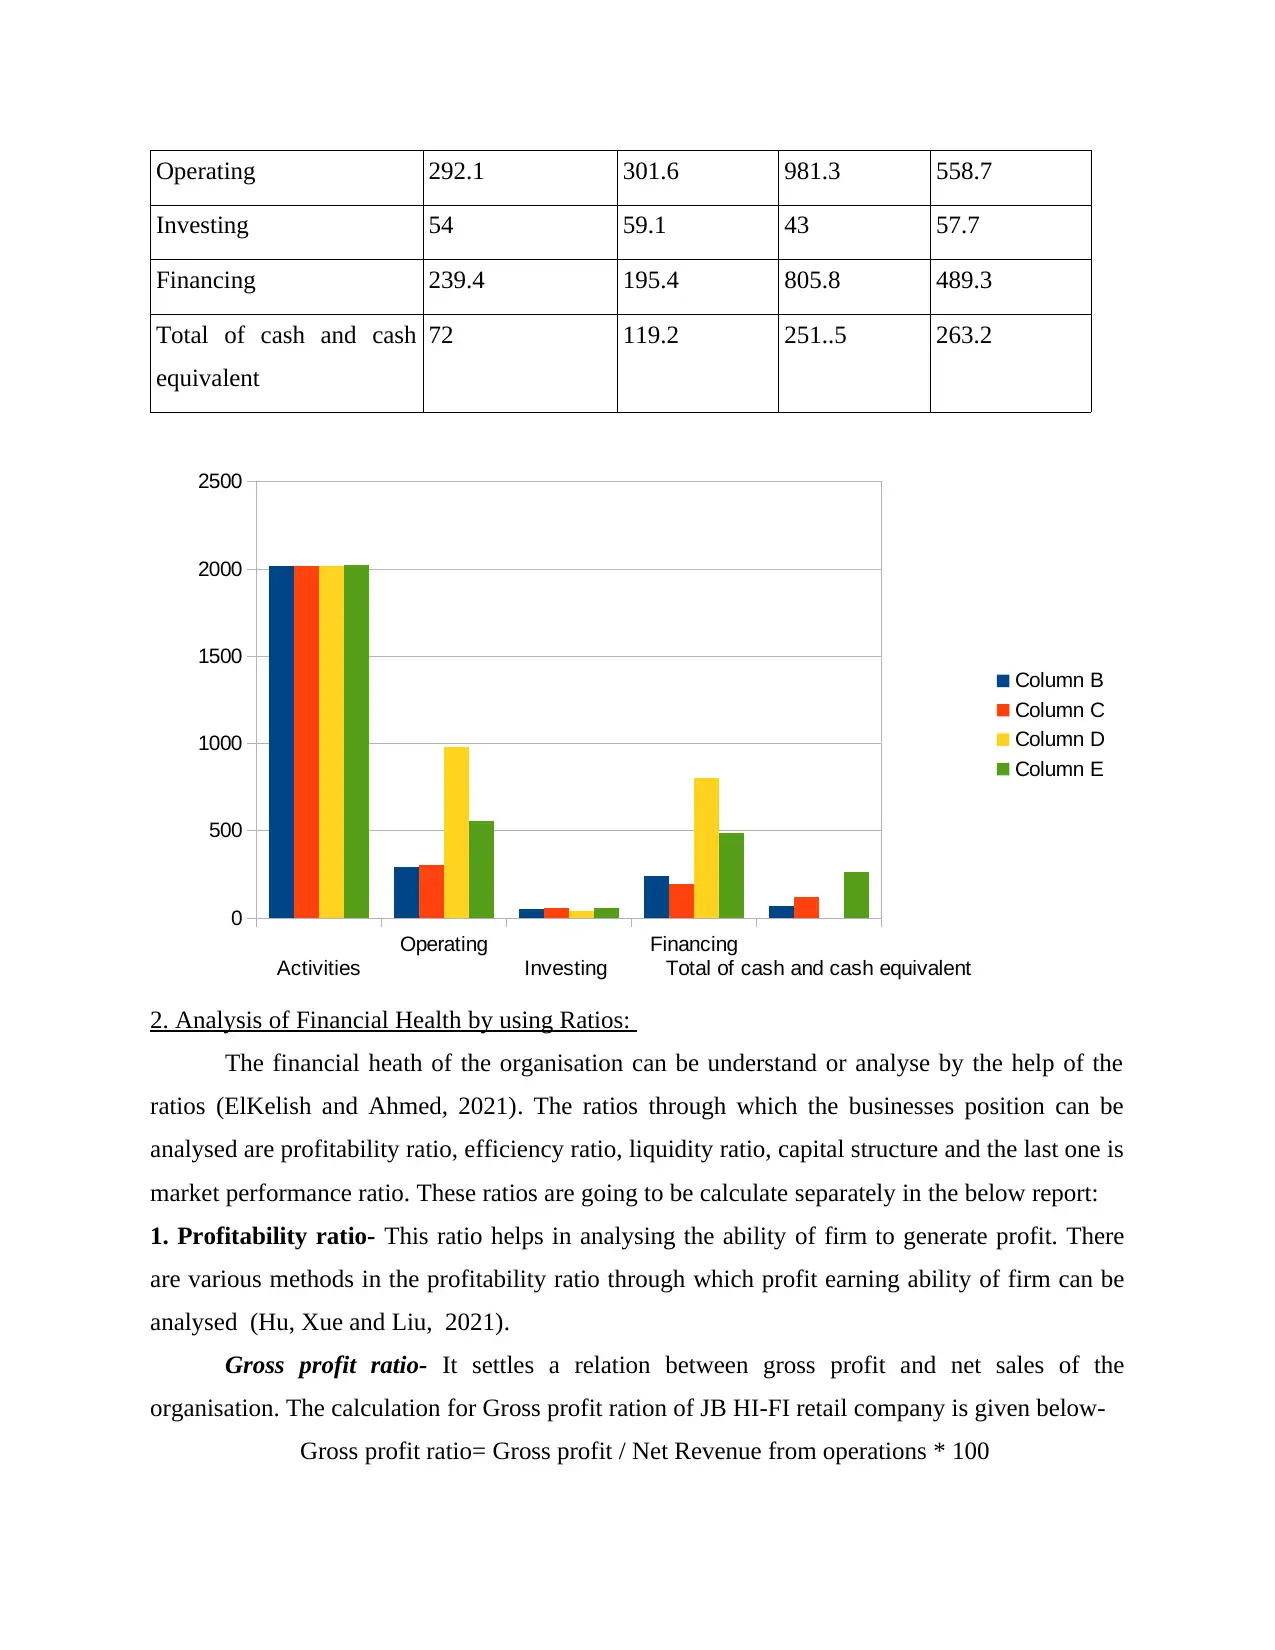
This report provides a financial analysis of JB HI-FI, an Australian electronic and home appliance retailer, focusing on its cash flow statement for 2021 and key financial ratios. The analysis of the cash flow statement reveals a decrease in net cash increment compared to the previous year, potentially due to inefficient resource utilization and increased income tax payments. The ratio analysis covers profitability, efficiency, liquidity, capital structure, and market performance. Profitability ratios indicate a slight increase in gross profit but a concerning net profit ratio. Efficiency ratios show improved inventory turnover and asset utilization. Liquidity ratios suggest potential financial vulnerabilities. Capital structure analysis reveals a weak long-term solvency ratio. Market performance, indicated by a low price-to-earnings ratio, suggests investor hesitance. The report concludes that JB HI-FI's financial position is weak and recommends adopting new strategies to improve profitability and overall financial health. Desklib provides solved assignments and past papers for students.
Document Page
Accounting and
Finance for Business
tabler-icon-diamond-filled.svg

Paraphrase This Document

Need a fresh take? Get an instant paraphrase of this document with our AI Paraphraser
Document Page
Table of Contents
INTRODUCTION ..........................................................................................................................3
TASK...............................................................................................................................................3
1. Analysis of cash flow statement for the year 2021.................................................................3
2. Analysis of Financial Health by using Ratios: .......................................................................4
CONCLUSION ...............................................................................................................................7
REFERENCES................................................................................................................................8
Document Page
INTRODUCTION
Accounting refers to recording and classifying the financial transactions of the business
so that the investors and the businessman can analyse performance of the business through out
the year. This function also helps in completion of legal activities of the business. This report
contains some ratio analysis of the JP Hi-FI company (Ahmed, 2018). This company is dealing
in electronic and home appliances and listed in Australian security Exchange. JB HI-FI was
established in 1974 by John Barbuto. That company have total 316 store across two countries
which are New Zealand and Australia. With ratios the analysis of cash flow statement for 2021 is
included the report.
TASK
1. Analysis of cash flow statement for the year 2021
Cash flow statement refers the statement which shows the net cash inflow and outflow of
the organisation. Due to this statement the organisation can analyse that at which place they are
spending their money and from which activity they are receiving the money in the organisation.
From the cash flow statement for the year 2021 it can be observed that the company have
increase their cash funds from the last year. The increment of the funds in 2021 is $11.7million
which is considered as low very low. This is because in 2020 the net cash increment for the year
2020 is $132.5 million which is almost 12 times higher from the last year. The changes in cash
fund can be seen by comparing the statements from the past few years. The net cash inflow from
the operational activity in 2021 is 558.7 but in 2020 it was 981.3. The reason may be that the JB
HI-FI company was not utilising their resources efficiently and effectively. The another reason
for the decreasing in net cash increment is income tax because the company have paid $158.7
million the preceding year but they pay only $118.2million in the year 2019. There are many
other reasons like payment on plant and machinery was more a compare to 2019. It can seen
from the cash flow statements that total of cash funds at the end of the year are increasing
continuously (Bryce, Ali and Mather, 2021). it may be due to expansion or increasing the sales
of the products in the organisation.. The variation in the cash flow statements can be understand
by the help of following table and graph.
Activities 2018 2019 2020 2021
Document Page
Operating 292.1 301.6 981.3 558.7
Investing 54 59.1 43 57.7
Financing 239.4 195.4 805.8 489.3
Total of cash and cash
equivalent
72 119.2 251..5 263.2
2. Analysis of Financial Health by using Ratios:
The financial heath of the organisation can be understand or analyse by the help of the
ratios (ElKelish and Ahmed, 2021). The ratios through which the businesses position can be
analysed are profitability ratio, efficiency ratio, liquidity ratio, capital structure and the last one is
market performance ratio. These ratios are going to be calculate separately in the below report:
1. Profitability ratio- This ratio helps in analysing the ability of firm to generate profit. There
are various methods in the profitability ratio through which profit earning ability of firm can be
analysed (Hu, Xue and Liu, 2021).
Gross profit ratio- It settles a relation between gross profit and net sales of the
organisation. The calculation for Gross profit ration of JB HI-FI retail company is given below-
Gross profit ratio= Gross profit / Net Revenue from operations * 100
Activities
Operating
Investing
Financing
Total of cash and cash equivalent
0
500
1000
1500
2000
2500
Column B
Column C
Column D
Column E
tabler-icon-diamond-filled.svg

Paraphrase This Document

Need a fresh take? Get an instant paraphrase of this document with our AI Paraphraser
Document Page
Gross profit for the year 2021 is- $1,977 million
Net Revenue from operations- $8,916 million
So, gross profit= 1977 / 8916 * 100
= 22.17%
It can be observed from the above result that the gross profit of JB HI-FI company is slightly
increasing as compare to gross profit ratio of 2020. The Gross profit ratio in the year 2020 is
21.39% and the ratio in previous year is 22.17%. There is a increment but that increment is not
sufficient because the inflation rate in the country is also increasing continuously.
Net profit ratio- It shows a relation between net profit and net sales of the organisation
(Ng, 2018). The calculation is given below-
Net profit for the year 2021- $506.1 million
Net Revenue from operations- $8916.1 million
Net profit ratio= Net profit / Net Revenue from operations * 100
so the ratio= 506.1 / 8916.1 * 100
=5.67%
So the net profit ratio of the year 2021 is 5.67%. The net profit ratio of the year 2019 is 3.81%
which means that the JB HI-FI retail company have increase their gross profit as compare to last
year it is happened because the organisation have use their resources effectively and efficiently
through which they are able to keep their price low in the market which attract the customers.
2. Efficiency ratios- This ratio helps the company in analysing the efficiency of their employees.
It helps in evaluating the performance of operation of organisation.
Inventory turnover ratio- This ratio helps the company in analysing that in how quickly
the company can sell their inventory in the market.
The cost of good sold for 2021- $6,938 million.
Average inventory- $839.05 million.
Inventory turnover ratio= C.O.G.S / Average inventory * 100
Average inventory= Opening inventory+Closing inventory / 2
938.8+739.3 = 1678.1 / 2 = 839.05
Inventory turnover ratio= 6,938 / 839.5 = 8.27
Document Page
From the result it can be observed that the company's ability of selling the inventory quickly is
slightly increase because the ratio in 2020 was 7.65 and in 2021 it was 8.27. It is not a very big
but definitely it can boost the morale of employees in the business.
Asset Turnover ratio- It helps in defining the efficiency of the organisation by using the
assets (Paul, Francis and Ben-Caleb, 2020).
Sales for the year was-$8,916 million.
And Average total assets- $2703.8 million
Asset Turnover ratio= Sales / Average Total assets
Asset Turnover ratio= 8,916 / 2703.8 = 3.29
It means that the efficiency of using the assets is increasing it can understandable by the results
because the asset turnover ration in 2020 was 2.77 but in 2021 it is 3.29. It means that the
employees are using the resources of the organisation effectively.
3. liquidity Ratio- This ratios shows the liquidity ability of the organisation. It means that how
easily the organisation can convert their assets in cash (Quah, Haman and Naidu, 2021).
Current ratio- This ratio shows the relation between the current assets and current
liabilities of the organisation.
Current ratio= Current assets / Current liabilities
Current assets of the year 2021- $1449.3 million
Current liabilities for the same year- $1335.3 million
Current ratio= 1449.3 / 1335.3 = 1.08
The ideal current ratio is 2:1 but the current ratio of JB HI-Fi retail company in the year 2021
was 1.08. Through this it can be observed the companies financial position is not well enough. It
is because if the company suffer from any uncertainty in future then, they will be able to meet
their liabilities because they don't have enough resources to pay back their creditors.
Quick ratio- This ratio shows the liquidity condition of the organisation with including
inventories.
Quick ratio= Quick assets- current liabilities
Quick assets= Current assets- inventories
Quick assets= 1449.3 – 938.8 = 510.5
Quick ratio= 510.5 / 1335.3 = 0.38
Document Page
From the result it can be said that the company is not able to convert their quick assets into the
cash. It means that if the company decide to wind up their business then it will be very difficult
for them to repay the money to their creditors.
4. Capital structure- This ratio helps the outsiders to determine the capital structure of the
company (Widyawati, 2021).
Long term Solvency ratio based on equity coverage- This ratio helps the investors to
determine solvency of the company.
Long term Solvency ratio= Equity / Fixed assets
1308.4 / 1806 = 0.72
The long term solvency ratio is vary from industry to industry. But the ideal ratio should be come
under 20% to 30%. It means that this JB HI-FI companies is not in good financial position and
not able to pay their debts if their business operations get stop.
5. Market performance ratio- This ratio helps to analyse the the performance of the business in
the market (Wahyuni and Azmi, 2019). It means that this ratio helps the investors to find out
their earning if they invest their money in the business.
Price to earning ratio= Market value per share / Earning per share
= 48.32 / 440.75= 0.109
The ideal range of this ratio should be between 20 to 25. So from the above result it is observed
that the price to earning ratio in the organisation is very low hence, the investors and
shareholders will not be ready to remain in the organisation any more. It is because everu one
wants to earn maximum profit for themselves.
CONCLUSION
From the above report it can be concluded that the JB HI-FI financial position is not good and
they can wind up their business any time in future. If this organisation wants to remain in the
market then they have to adopt new policies and drop the low price policy so that they can
sufficient profit. The JB HI-Fi retail company have to bring new strategies so that they can boost
their financial position. The company have reduce the cost so that they main their position in the
market.
tabler-icon-diamond-filled.svg

Paraphrase This Document

Need a fresh take? Get an instant paraphrase of this document with our AI Paraphraser
Document Page
REFERENCES
Books and Journals
Ahmed, M.N., 2018. Outsourcing relationship management: accounting in the decision
mix. Journal of Business Strategy.
Bryce, M., Ali, M.J. and Mather, P.R., 2021. Director expectations gap and hindsight
bias. Accounting & Finance. 61(2), pp.2965-2996.
ElKelish, W.W. and Ahmed, R., 2021. Advancing accounting education using LEGO® Serious
Play simulation technique. Accounting Education. pp.1-17.
Hu, N., Xue, X. and Liu, L., 2021. The impact of air pollution on financial reporting quality:
evidence from China. Accounting & Finance.
Ng, A.W., 2018. From sustainability accounting to a green financing system: Institutional
legitimacy and market heterogeneity in a global financial centre. Journal of cleaner
production. 195, pp.585-592.
Paul, O., Francis, I. and Ben-Caleb, E., 2020. Corporate governance and creative accounting
practices in the listed companies in Nigeria. Academy of Accounting and Financial
Studies Journal. 24(4), pp.1-20.
Quah, H., Haman, J. and Naidu, D., 2021. The effect of stock liquidity on investment efficiency
under financing constraints and asymmetric information: Evidence from the United
States. Accounting & Finance. 61, pp.2109-2150.
Widyawati, L., 2021. Measurement concerns and agreement of environmental social governance
ratings. Accounting & Finance 61, pp.1589-1623.
Wahyuni, M. and Azmi, F., 2019. The effect of non performing financing volume with inflation
as moderating variables on sharia commercial banks. Journal of Islamic Accounting and
Finance Research. 1(1), pp.79-96.
chevron_up_icon
1 out of 8
circle_padding
hide_on_mobile
zoom_out_icon
[object Object]