JB Hi-Fi Finance: Capital Structure and Profitability Report
VerifiedAdded on 2022/12/23
|16
|3094
|50
Report
AI Summary
This report provides a comprehensive financial analysis of JB Hi-Fi's performance over a five-year period. It begins with an executive summary and table of contents, followed by an introduction outlining the report's objectives. The core of the report, Part A, analyzes JB Hi-Fi's capital structure and profitability ratios, comparing them to industry averages to determine the company's performance trends. It examines the relationship between capital structure and profitability, calculates the cash conversion cycle to assess cash management efficiency, and determines bond and ordinary share values under different scenarios. The report utilizes financial data, graphs, and calculations to support its analysis, offering insights into JB Hi-Fi's financial health, debt levels, profitability margins, and overall financial stability. The report concludes with a summary of key findings and provides references to relevant sources.
Running head: FINANCE PORTFOLIO MANAGEMENT
Finance portfolio management
Name of the Student:
Name of the University:
Author’s Note:
Course ID:
Finance portfolio management
Name of the Student:
Name of the University:
Author’s Note:
Course ID:
Paraphrase This Document
Need a fresh take? Get an instant paraphrase of this document with our AI Paraphraser
1FINANCE PORTFOLIO MANAGEMENT
Executive Summary:
The performance and financial structure of JB Hi-Fi for the five financial years are evaluated in
the assessment. Furthermore, calculations of Bond and share price relatively provided adequate
information regarding the use of debt capital by JB Hi-Fi to improve its operation. Additionally,
the financial ratios JB Hi-Fi compared with industry average to determine whether the
organizations current operation condition is in accordance with the market leaders. On the other
hand, the capital structure of the organization is considered to be adequate as the debt
composition is relatively low in comparison to equity composition. Moreover, adequate
calculations regarding the capital structure and profitability of JB Hi-Fi discussed in the
assessment, which helps in analyzing and elaborating with the performance of the company is
deteriorating or appreciating over the period of time.
2FINANCE PORTFOLIO MANAGEMENT
Table of Contents
Introduction:....................................................................................................................................3
Part A: Written Report.....................................................................................................................3
a) Analyzing and elaborating whether the company in improving or deteriorating in terms of
capital structure and profitability ratios:..........................................................................................3
b) Indicating how the company is comparing with the industry average:.......................................6
c) Stating whether there is a relationship between the capital structure and profitability ratios:....8
d) Calculating the Cash Conversion Cycle (CCC) of the company and detect its performance
over the period of 5 years:...............................................................................................................8
e. Determining the price of the bond before and after the rumor, while calculating the value of
ordinary share:...............................................................................................................................10
Conclusion:....................................................................................................................................11
References and Bibliography:........................................................................................................12
⊘ This is a preview!⊘
Do you want full access?
Subscribe today to unlock all pages.
Trusted by 1+ million students worldwide
3FINANCE PORTFOLIO MANAGEMENT
Introduction:
The overall assessment aims in evaluating the performance and financial structure of JB
Hi-Fi for the five financial years. Moreover, adequate calculations regarding the capital structure
and profitability of JB Hi-Fi discussed in the assessment, which helps in analyzing and
elaborating with the performance of the company is deteriorating or appreciating over the period
of time. Additionally, the financial ratios JB Hi-Fi compared with industry average to determine
whether the organizations current operation condition is in accordance with the market leaders.
Furthermore relationship between capital structure and profitability ratios is discussed to
determine whether they are interlinked with each other. In addition, calculation has been
conducted for the past 5 years on the cash conversion cycle of JB Hi-Fi to detect the cash
availability for the organization. The calculation of adequate corporate bonds and ordinary shares
are also conducted. Lastly, a reflective analysis is conducted on the article for reflecting on
relevant goals.
Part A: Written Report
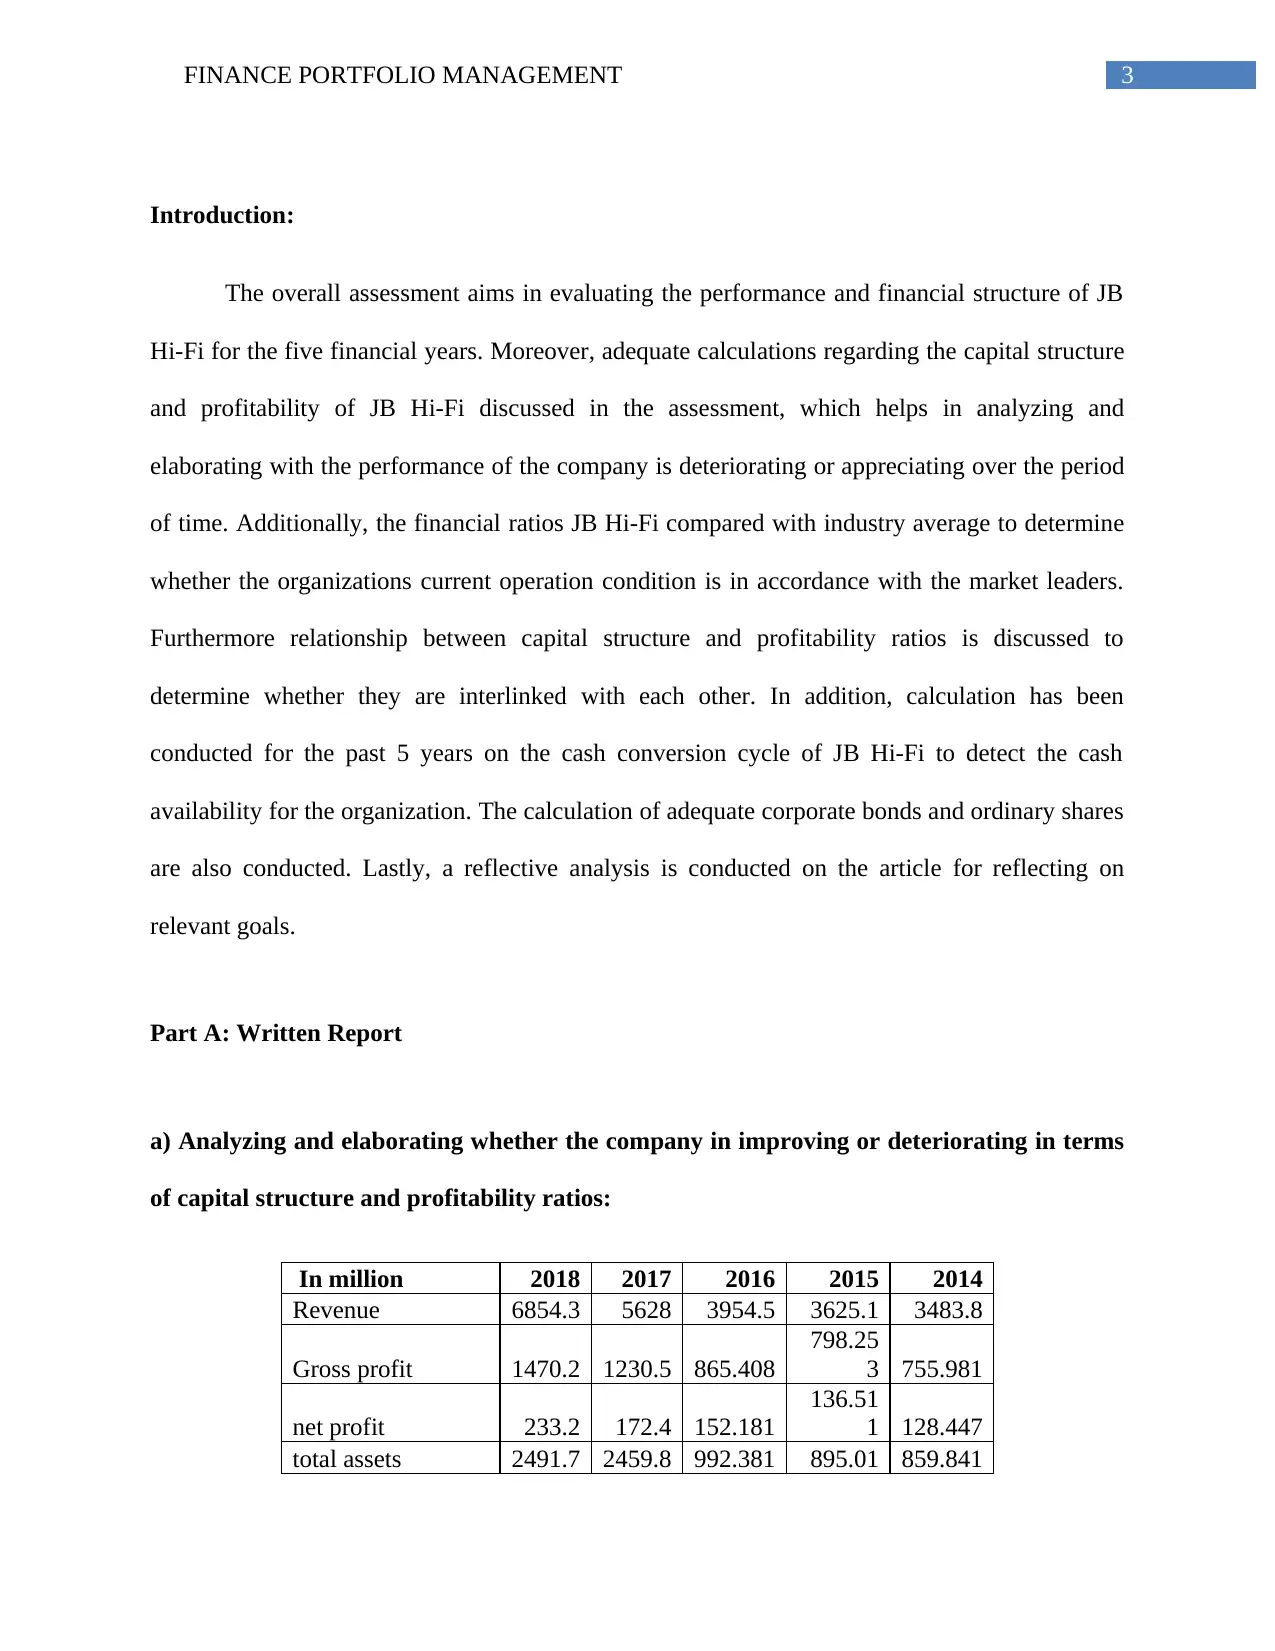
a) Analyzing and elaborating whether the company in improving or deteriorating in terms
of capital structure and profitability ratios:
In million 2018 2017 2016 2015 2014
Revenue 6854.3 5628 3954.5 3625.1 3483.8
Gross profit 1470.2 1230.5 865.408
798.25
3 755.981
net profit 233.2 172.4 152.181
136.51
1 128.447
total assets 2491.7 2459.8 992.381 895.01 859.841
Introduction:
The overall assessment aims in evaluating the performance and financial structure of JB
Hi-Fi for the five financial years. Moreover, adequate calculations regarding the capital structure
and profitability of JB Hi-Fi discussed in the assessment, which helps in analyzing and
elaborating with the performance of the company is deteriorating or appreciating over the period
of time. Additionally, the financial ratios JB Hi-Fi compared with industry average to determine
whether the organizations current operation condition is in accordance with the market leaders.
Furthermore relationship between capital structure and profitability ratios is discussed to
determine whether they are interlinked with each other. In addition, calculation has been
conducted for the past 5 years on the cash conversion cycle of JB Hi-Fi to detect the cash
availability for the organization. The calculation of adequate corporate bonds and ordinary shares
are also conducted. Lastly, a reflective analysis is conducted on the article for reflecting on
relevant goals.
Part A: Written Report
a) Analyzing and elaborating whether the company in improving or deteriorating in terms
of capital structure and profitability ratios:
In million 2018 2017 2016 2015 2014
Revenue 6854.3 5628 3954.5 3625.1 3483.8
Gross profit 1470.2 1230.5 865.408
798.25
3 755.981
net profit 233.2 172.4 152.181
136.51
1 128.447
total assets 2491.7 2459.8 992.381 895.01 859.841
Paraphrase This Document
Need a fresh take? Get an instant paraphrase of this document with our AI Paraphraser
4FINANCE PORTFOLIO MANAGEMENT
3
total equity 947.6 853.5 404.702
343.47
9 294.633
current assets 1210.5 1167.5 702.518
616.90
1 578.147
current liabilities 917.2 885.4 446.833
380.33
6 352.193
inventory 891.1 859.7 546.437
478.87
1 458.625
accounts
receivable 204.7 193.6 98.073 81.48 70.745
interest 16.6 10.7 3.857 5.927 8.845
Debt 397.4 486 57.852 90.33 136.208
EBIT 350.6 290.5 221.2 200.9 191.1
dividend 1.32 1.18 1.00 0.90 0.84
share price 22.52 23.37 24.1 19.48 18.3
EPS 2.0309 1.543 1.5376 1.3791 1.2839
Accounts payable 665.3 644.7 384.928
325.60
4 302.979
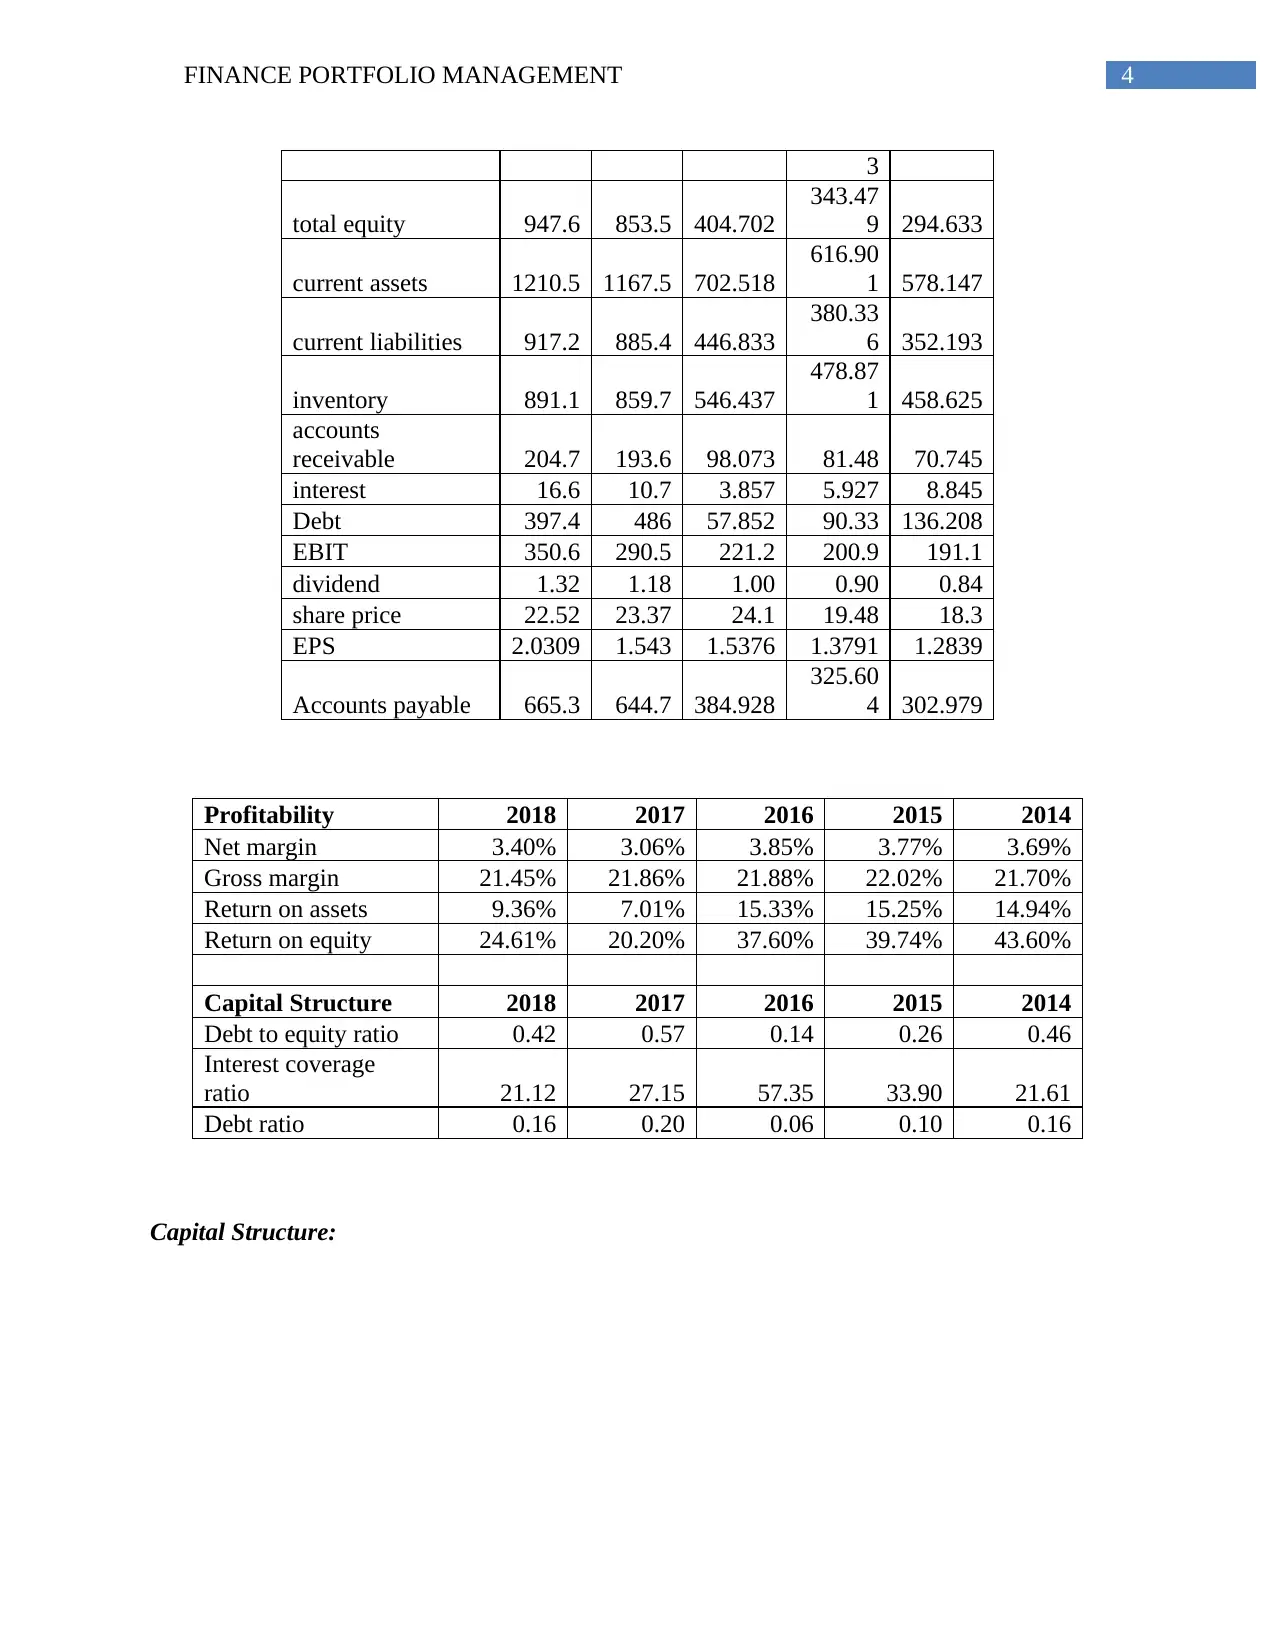
Profitability 2018 2017 2016 2015 2014
Net margin 3.40% 3.06% 3.85% 3.77% 3.69%
Gross margin 21.45% 21.86% 21.88% 22.02% 21.70%
Return on assets 9.36% 7.01% 15.33% 15.25% 14.94%
Return on equity 24.61% 20.20% 37.60% 39.74% 43.60%
Capital Structure 2018 2017 2016 2015 2014
Debt to equity ratio 0.42 0.57 0.14 0.26 0.46
Interest coverage
ratio 21.12 27.15 57.35 33.90 21.61
Debt ratio 0.16 0.20 0.06 0.10 0.16
Capital Structure:
3
total equity 947.6 853.5 404.702
343.47
9 294.633
current assets 1210.5 1167.5 702.518
616.90
1 578.147
current liabilities 917.2 885.4 446.833
380.33
6 352.193
inventory 891.1 859.7 546.437
478.87
1 458.625
accounts
receivable 204.7 193.6 98.073 81.48 70.745
interest 16.6 10.7 3.857 5.927 8.845
Debt 397.4 486 57.852 90.33 136.208
EBIT 350.6 290.5 221.2 200.9 191.1
dividend 1.32 1.18 1.00 0.90 0.84
share price 22.52 23.37 24.1 19.48 18.3
EPS 2.0309 1.543 1.5376 1.3791 1.2839
Accounts payable 665.3 644.7 384.928
325.60
4 302.979
Profitability 2018 2017 2016 2015 2014
Net margin 3.40% 3.06% 3.85% 3.77% 3.69%
Gross margin 21.45% 21.86% 21.88% 22.02% 21.70%
Return on assets 9.36% 7.01% 15.33% 15.25% 14.94%
Return on equity 24.61% 20.20% 37.60% 39.74% 43.60%
Capital Structure 2018 2017 2016 2015 2014
Debt to equity ratio 0.42 0.57 0.14 0.26 0.46
Interest coverage
ratio 21.12 27.15 57.35 33.90 21.61
Debt ratio 0.16 0.20 0.06 0.10 0.16
Capital Structure:
5FINANCE PORTFOLIO MANAGEMENT
2018 2017 2016 2015 2014
-
10.00
20.00
30.00
40.00
50.00
60.00
70.00
Capital Structure
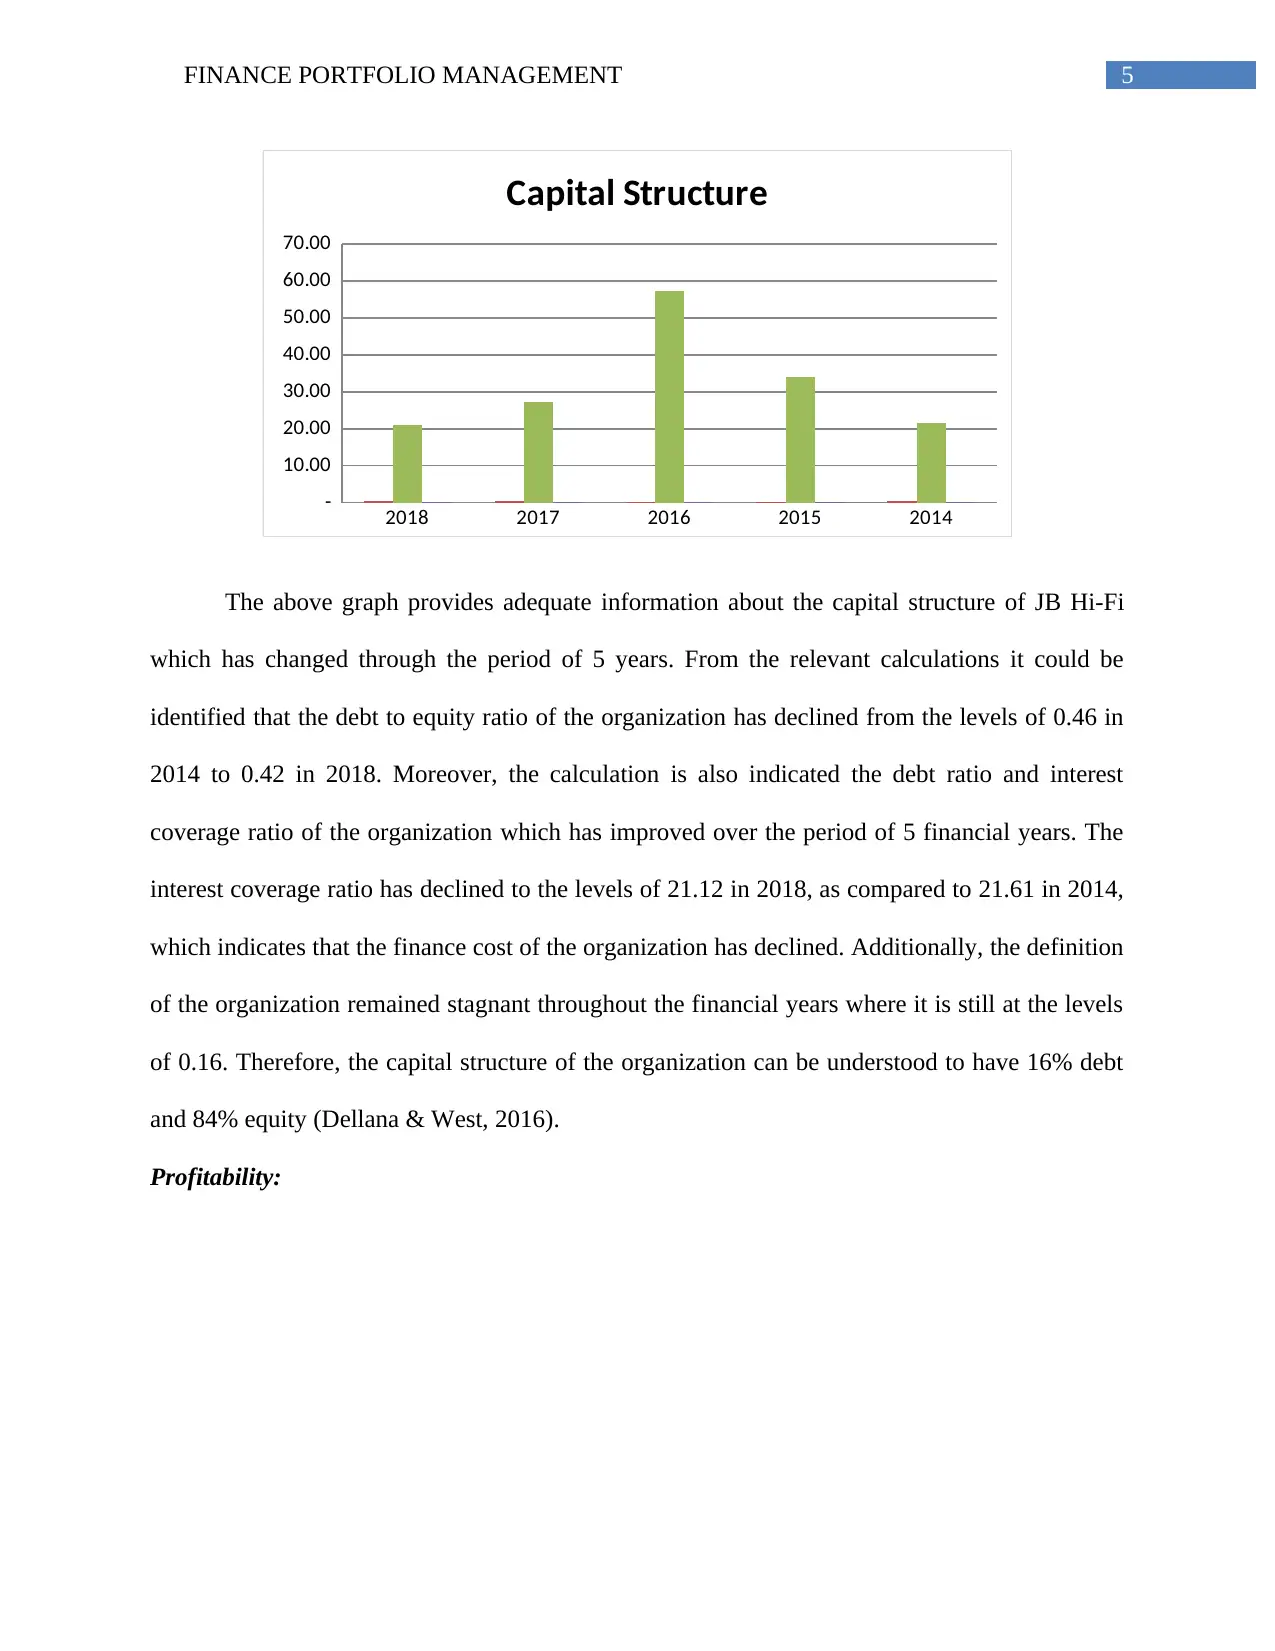
The above graph provides adequate information about the capital structure of JB Hi-Fi
which has changed through the period of 5 years. From the relevant calculations it could be
identified that the debt to equity ratio of the organization has declined from the levels of 0.46 in
2014 to 0.42 in 2018. Moreover, the calculation is also indicated the debt ratio and interest
coverage ratio of the organization which has improved over the period of 5 financial years. The
interest coverage ratio has declined to the levels of 21.12 in 2018, as compared to 21.61 in 2014,
which indicates that the finance cost of the organization has declined. Additionally, the definition
of the organization remained stagnant throughout the financial years where it is still at the levels
of 0.16. Therefore, the capital structure of the organization can be understood to have 16% debt
and 84% equity (Dellana & West, 2016).
Profitability:
2018 2017 2016 2015 2014
-
10.00
20.00
30.00
40.00
50.00
60.00
70.00
Capital Structure
The above graph provides adequate information about the capital structure of JB Hi-Fi
which has changed through the period of 5 years. From the relevant calculations it could be
identified that the debt to equity ratio of the organization has declined from the levels of 0.46 in
2014 to 0.42 in 2018. Moreover, the calculation is also indicated the debt ratio and interest
coverage ratio of the organization which has improved over the period of 5 financial years. The
interest coverage ratio has declined to the levels of 21.12 in 2018, as compared to 21.61 in 2014,
which indicates that the finance cost of the organization has declined. Additionally, the definition
of the organization remained stagnant throughout the financial years where it is still at the levels
of 0.16. Therefore, the capital structure of the organization can be understood to have 16% debt
and 84% equity (Dellana & West, 2016).
Profitability:
⊘ This is a preview!⊘
Do you want full access?
Subscribe today to unlock all pages.
Trusted by 1+ million students worldwide
6FINANCE PORTFOLIO MANAGEMENT
2018 2017 2016 2015 2014
0.00%
5.00%
10.00%
15.00%
20.00%
25.00%
30.00%
35.00%
40.00%
45.00%
50.00%
Profitability ratio
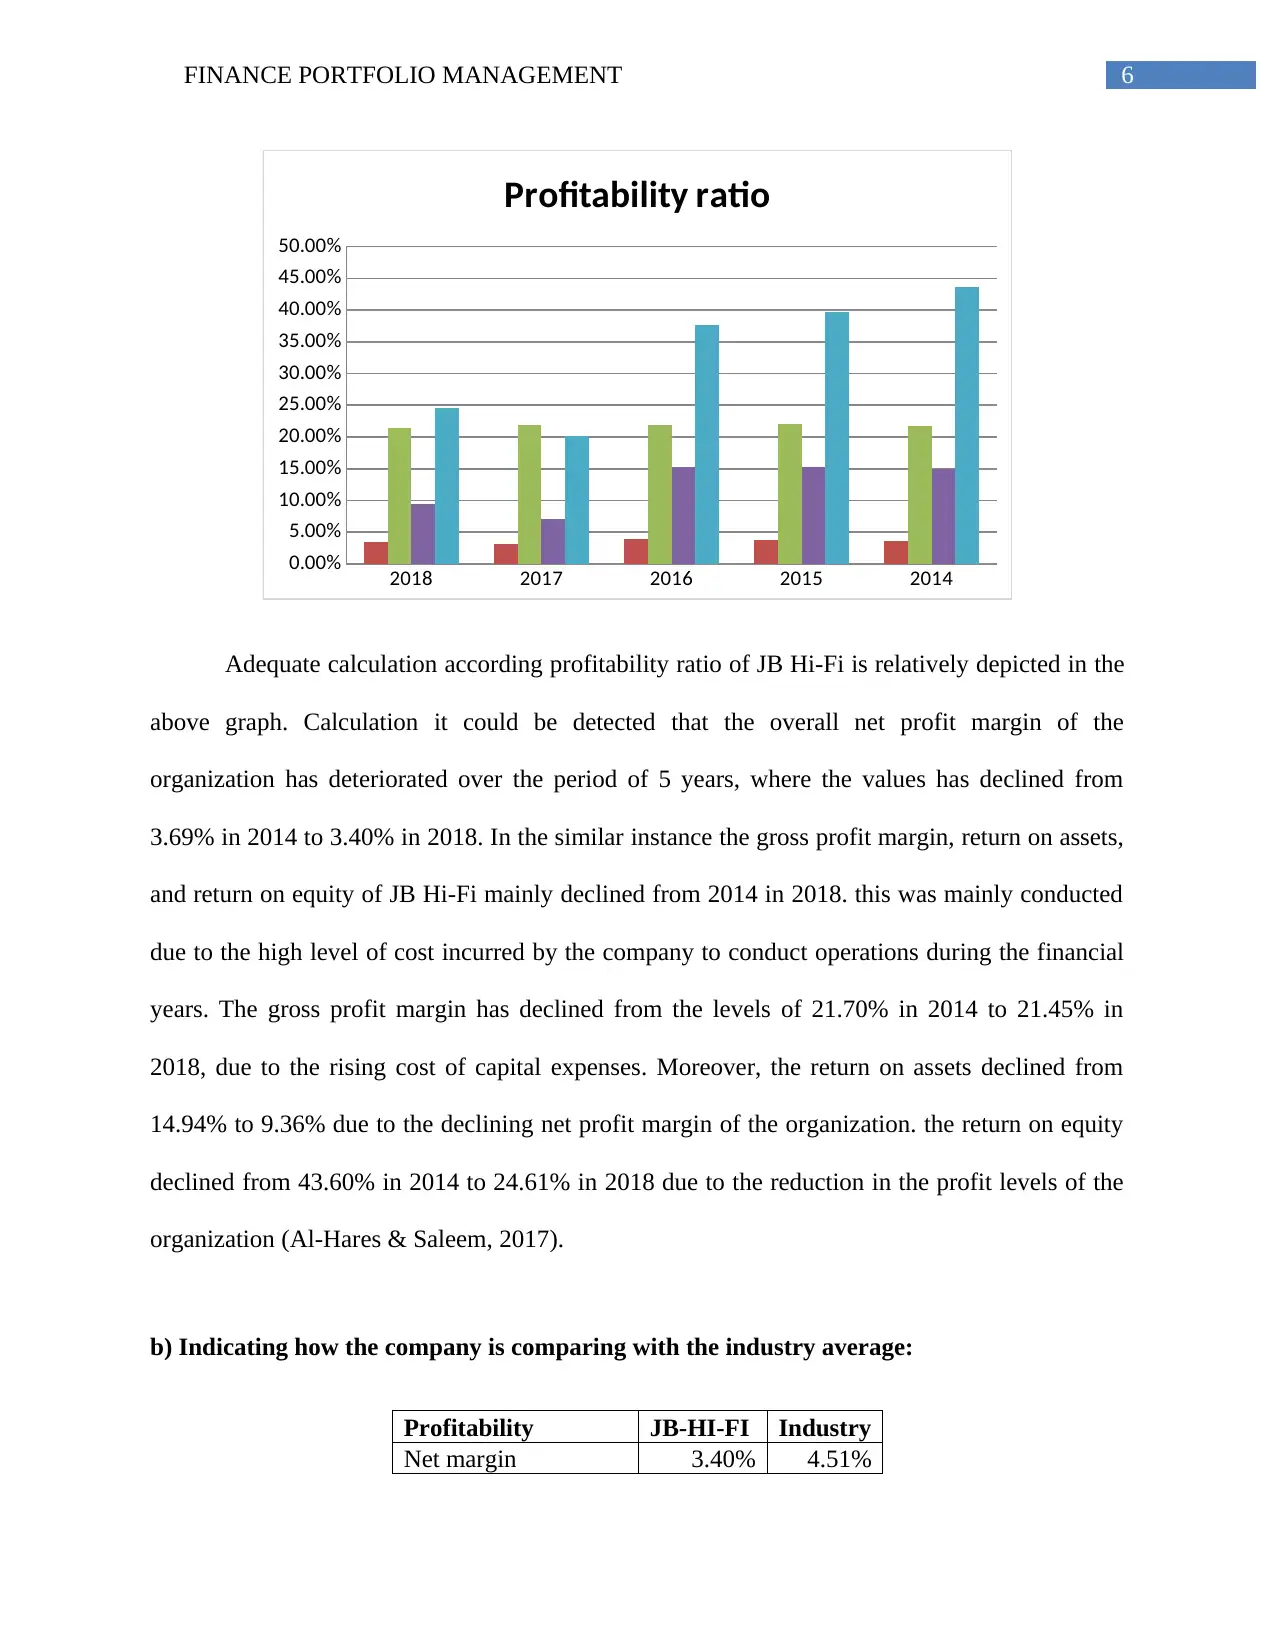
Adequate calculation according profitability ratio of JB Hi-Fi is relatively depicted in the
above graph. Calculation it could be detected that the overall net profit margin of the
organization has deteriorated over the period of 5 years, where the values has declined from
3.69% in 2014 to 3.40% in 2018. In the similar instance the gross profit margin, return on assets,
and return on equity of JB Hi-Fi mainly declined from 2014 in 2018. this was mainly conducted
due to the high level of cost incurred by the company to conduct operations during the financial
years. The gross profit margin has declined from the levels of 21.70% in 2014 to 21.45% in
2018, due to the rising cost of capital expenses. Moreover, the return on assets declined from
14.94% to 9.36% due to the declining net profit margin of the organization. the return on equity
declined from 43.60% in 2014 to 24.61% in 2018 due to the reduction in the profit levels of the
organization (Al-Hares & Saleem, 2017).
b) Indicating how the company is comparing with the industry average:
Profitability JB-HI-FI Industry
Net margin 3.40% 4.51%
2018 2017 2016 2015 2014
0.00%
5.00%
10.00%
15.00%
20.00%
25.00%
30.00%
35.00%
40.00%
45.00%
50.00%
Profitability ratio
Adequate calculation according profitability ratio of JB Hi-Fi is relatively depicted in the
above graph. Calculation it could be detected that the overall net profit margin of the
organization has deteriorated over the period of 5 years, where the values has declined from
3.69% in 2014 to 3.40% in 2018. In the similar instance the gross profit margin, return on assets,
and return on equity of JB Hi-Fi mainly declined from 2014 in 2018. this was mainly conducted
due to the high level of cost incurred by the company to conduct operations during the financial
years. The gross profit margin has declined from the levels of 21.70% in 2014 to 21.45% in
2018, due to the rising cost of capital expenses. Moreover, the return on assets declined from
14.94% to 9.36% due to the declining net profit margin of the organization. the return on equity
declined from 43.60% in 2014 to 24.61% in 2018 due to the reduction in the profit levels of the
organization (Al-Hares & Saleem, 2017).
b) Indicating how the company is comparing with the industry average:
Profitability JB-HI-FI Industry
Net margin 3.40% 4.51%
Paraphrase This Document
Need a fresh take? Get an instant paraphrase of this document with our AI Paraphraser
7FINANCE PORTFOLIO MANAGEMENT
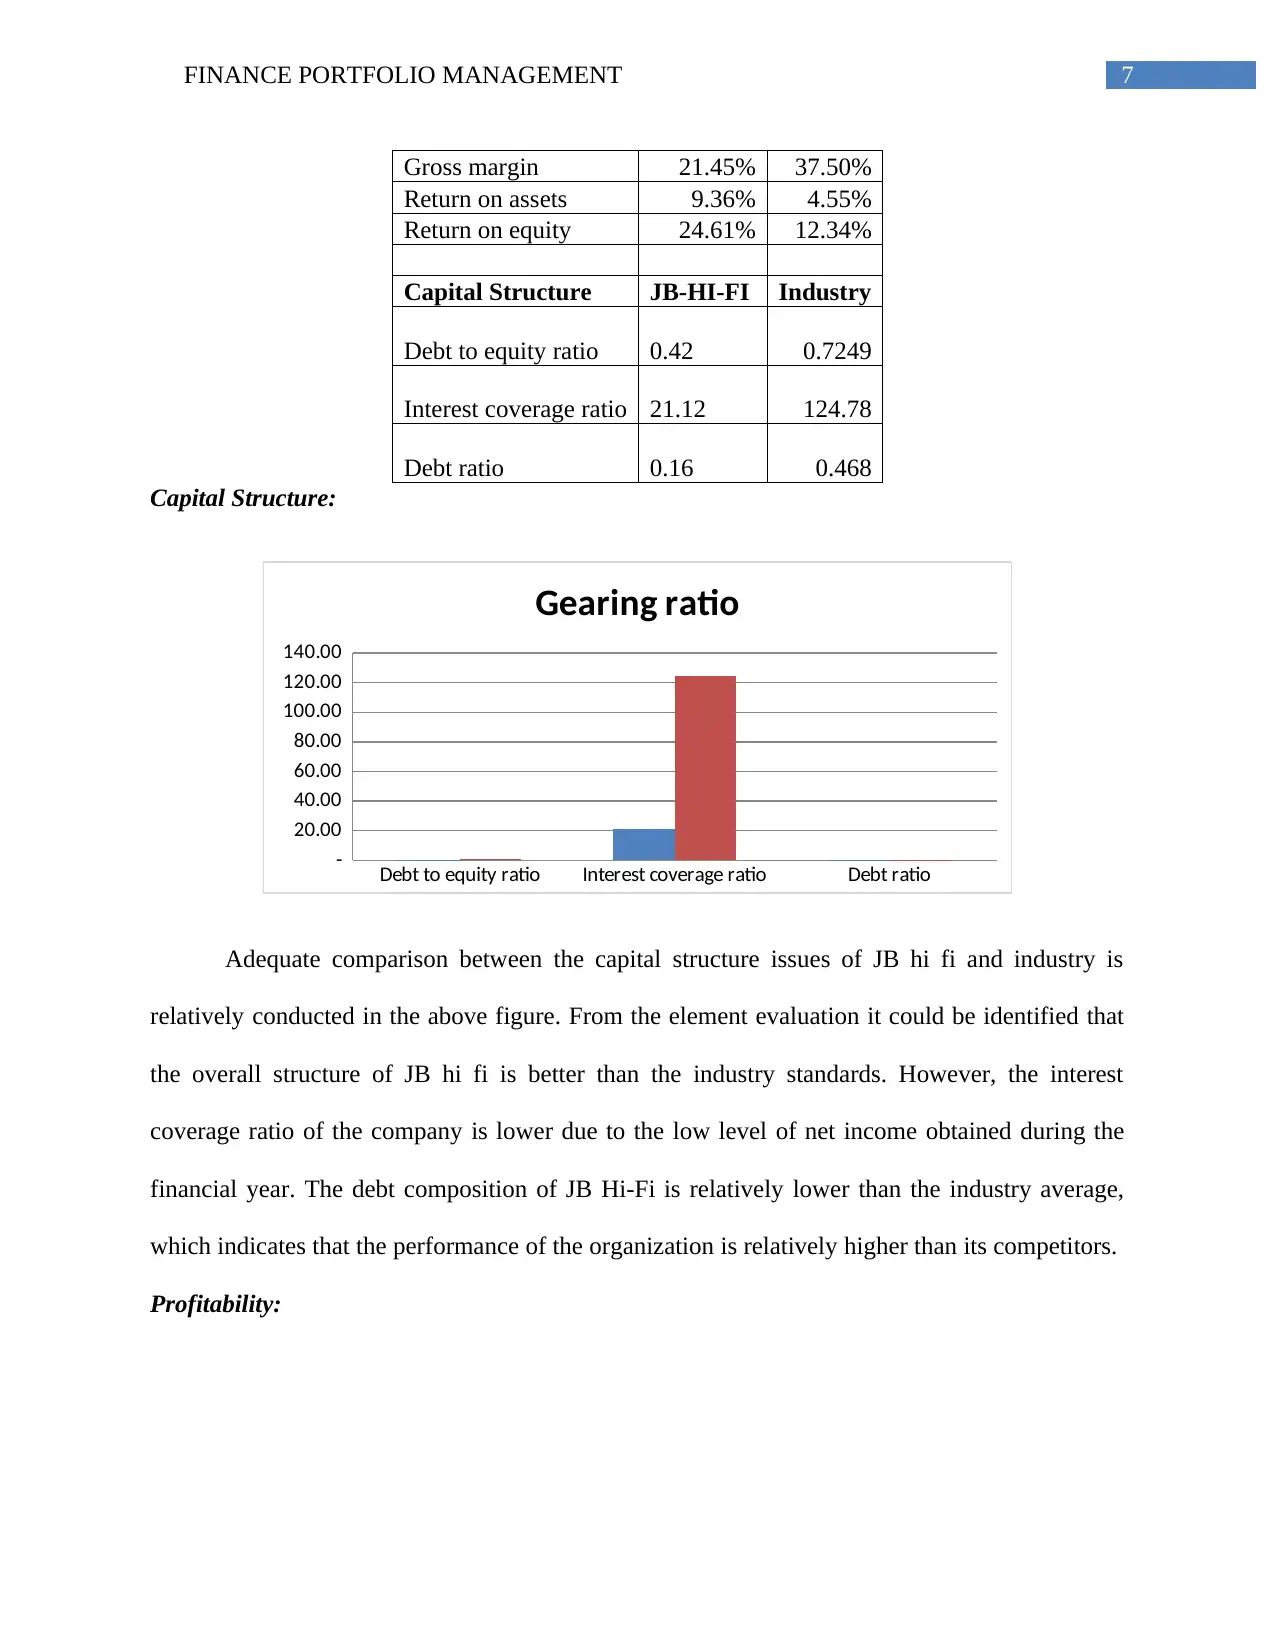
Gross margin 21.45% 37.50%
Return on assets 9.36% 4.55%
Return on equity 24.61% 12.34%
Capital Structure JB-HI-FI Industry
Debt to equity ratio 0.42 0.7249
Interest coverage ratio 21.12 124.78
Debt ratio 0.16 0.468
Capital Structure:
Debt to equity ratio Interest coverage ratio Debt ratio
-
20.00
40.00
60.00
80.00
100.00
120.00
140.00
Gearing ratio
Adequate comparison between the capital structure issues of JB hi fi and industry is
relatively conducted in the above figure. From the element evaluation it could be identified that
the overall structure of JB hi fi is better than the industry standards. However, the interest
coverage ratio of the company is lower due to the low level of net income obtained during the
financial year. The debt composition of JB Hi-Fi is relatively lower than the industry average,
which indicates that the performance of the organization is relatively higher than its competitors.
Profitability:
8FINANCE PORTFOLIO MANAGEMENT
Net margin Gross margin Return on assets Return on equity
0.00%
5.00%
10.00%
15.00%
20.00%
25.00%
30.00%
35.00%
40.00%
Profitability ratio
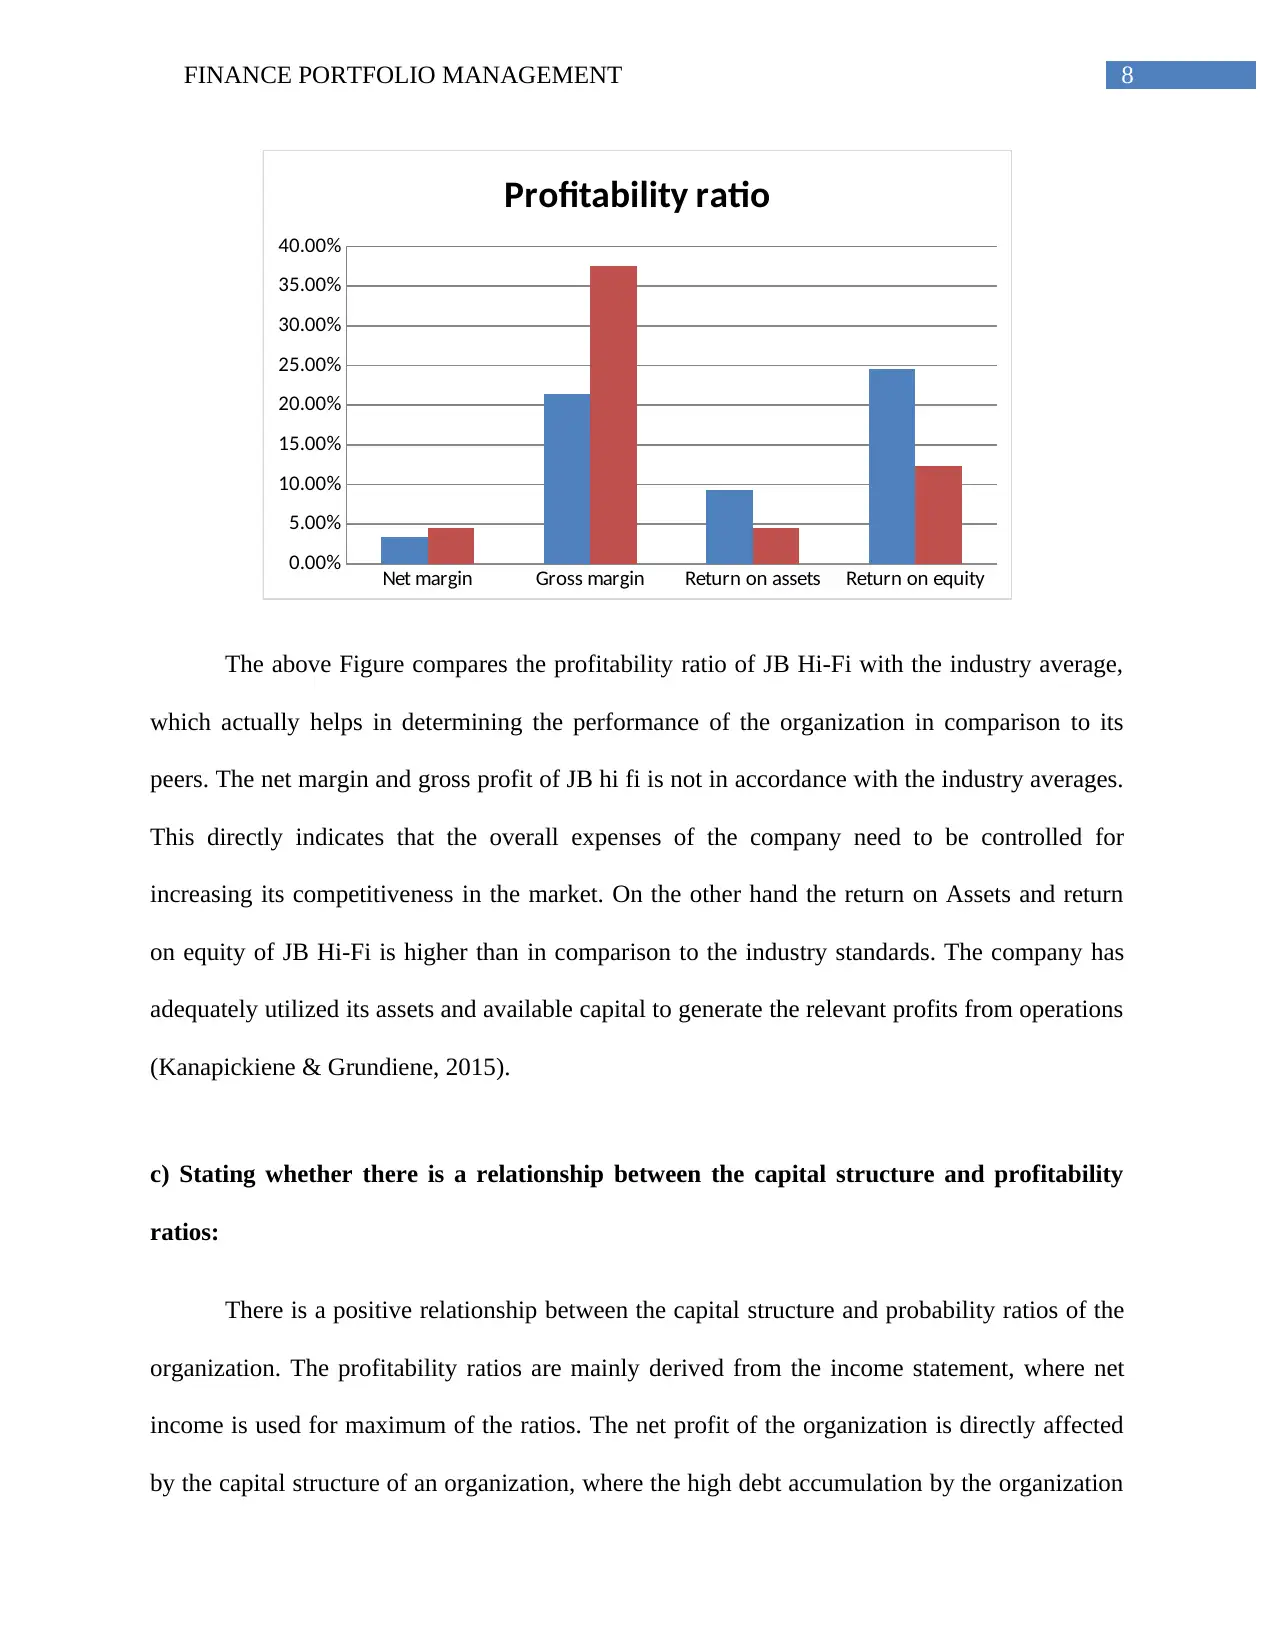
The above Figure compares the profitability ratio of JB Hi-Fi with the industry average,
which actually helps in determining the performance of the organization in comparison to its
peers. The net margin and gross profit of JB hi fi is not in accordance with the industry averages.
This directly indicates that the overall expenses of the company need to be controlled for
increasing its competitiveness in the market. On the other hand the return on Assets and return
on equity of JB Hi-Fi is higher than in comparison to the industry standards. The company has
adequately utilized its assets and available capital to generate the relevant profits from operations
(Kanapickiene & Grundiene, 2015).
c) Stating whether there is a relationship between the capital structure and profitability
ratios:
There is a positive relationship between the capital structure and probability ratios of the
organization. The profitability ratios are mainly derived from the income statement, where net
income is used for maximum of the ratios. The net profit of the organization is directly affected
by the capital structure of an organization, where the high debt accumulation by the organization
Net margin Gross margin Return on assets Return on equity
0.00%
5.00%
10.00%
15.00%
20.00%
25.00%
30.00%
35.00%
40.00%
Profitability ratio
The above Figure compares the profitability ratio of JB Hi-Fi with the industry average,
which actually helps in determining the performance of the organization in comparison to its
peers. The net margin and gross profit of JB hi fi is not in accordance with the industry averages.
This directly indicates that the overall expenses of the company need to be controlled for
increasing its competitiveness in the market. On the other hand the return on Assets and return
on equity of JB Hi-Fi is higher than in comparison to the industry standards. The company has
adequately utilized its assets and available capital to generate the relevant profits from operations
(Kanapickiene & Grundiene, 2015).
c) Stating whether there is a relationship between the capital structure and profitability
ratios:
There is a positive relationship between the capital structure and probability ratios of the
organization. The profitability ratios are mainly derived from the income statement, where net
income is used for maximum of the ratios. The net profit of the organization is directly affected
by the capital structure of an organization, where the high debt accumulation by the organization
⊘ This is a preview!⊘
Do you want full access?
Subscribe today to unlock all pages.
Trusted by 1+ million students worldwide
9FINANCE PORTFOLIO MANAGEMENT
in their capital structure would directly reduce the level of net income and increase finance cost.
Hence, there is a direct link between the capital structure and profitability conditions of the
organization. In addition, the capital acquired from the capital structure would also have a direct
impact on the profitability ratios of the organization, where return on equity calculations is
derived by dividing the level of net income with the total equity investments. Hence, it could be
determined that there is a positive and direct link between the capital structure and profitability
conditions of the organization.
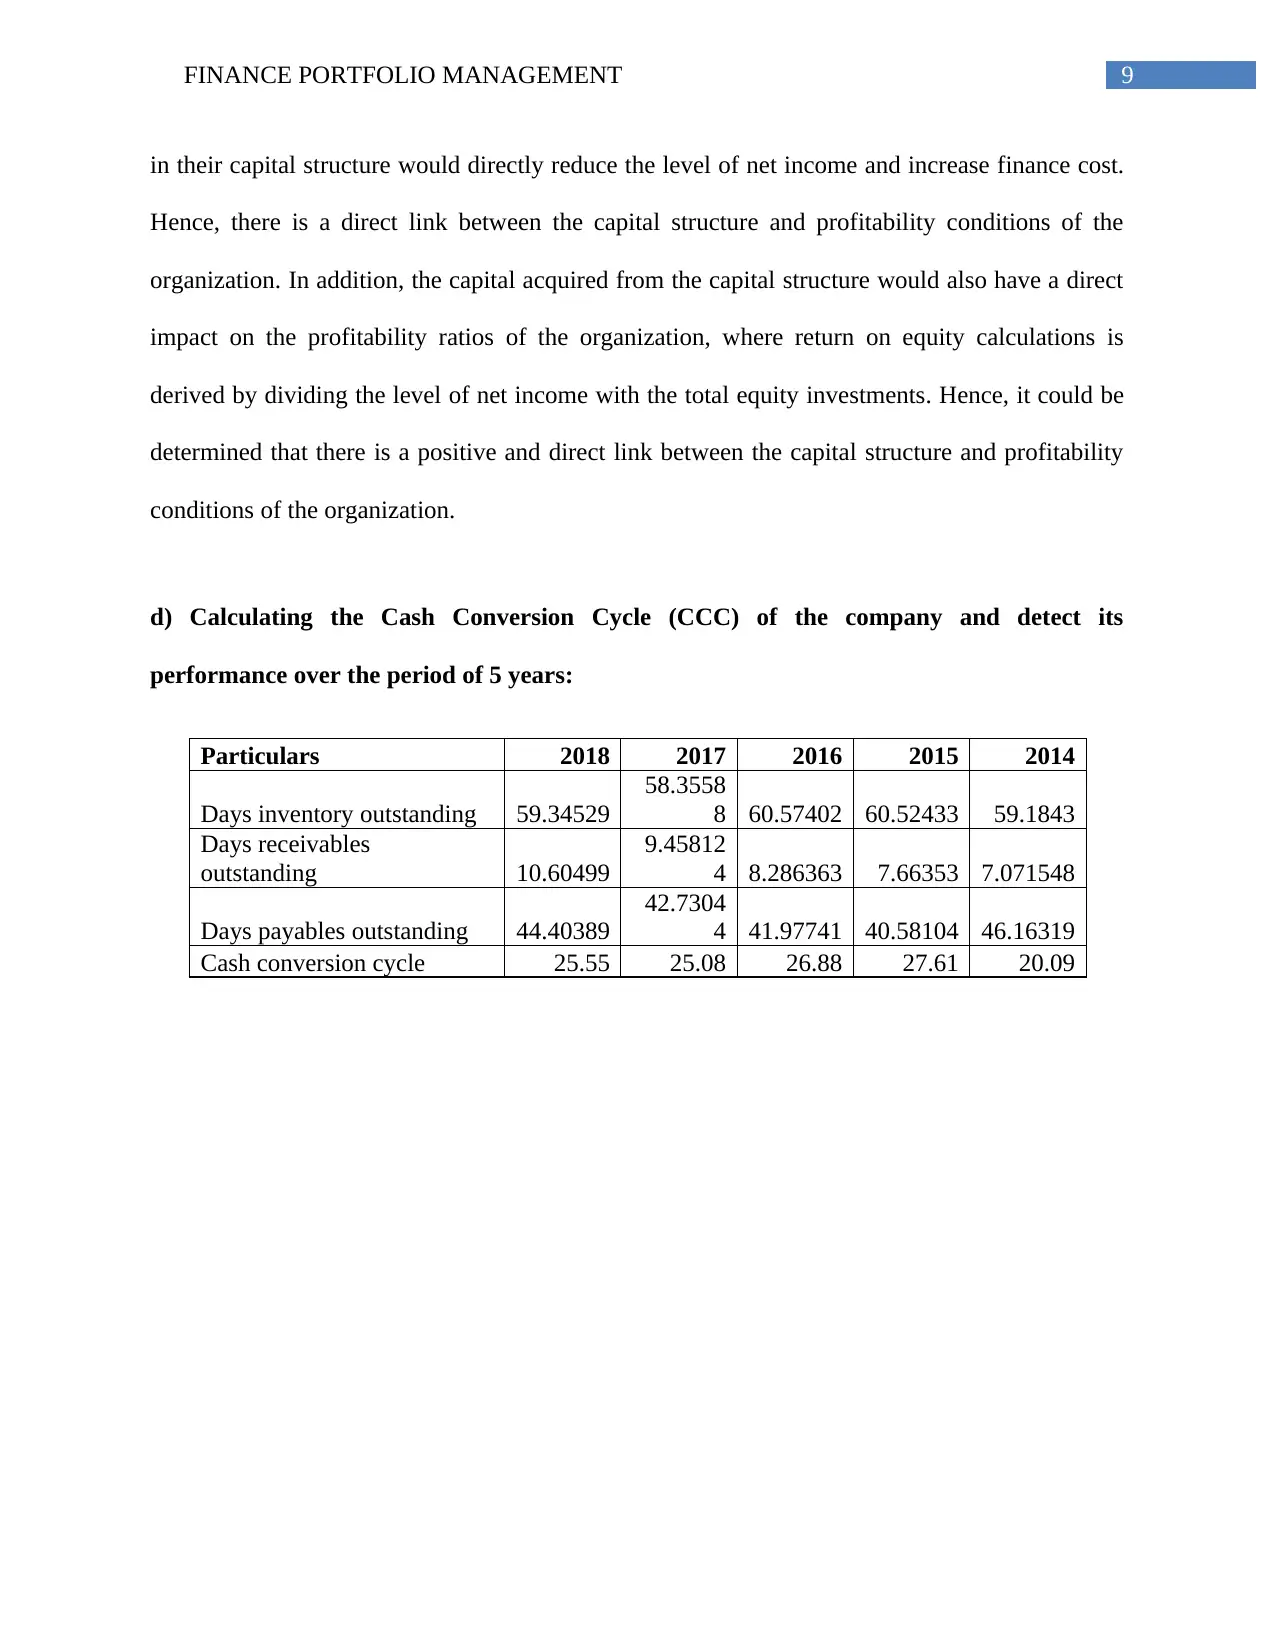
d) Calculating the Cash Conversion Cycle (CCC) of the company and detect its
performance over the period of 5 years:
Particulars 2018 2017 2016 2015 2014
Days inventory outstanding 59.34529
58.3558
8 60.57402 60.52433 59.1843
Days receivables
outstanding 10.60499
9.45812
4 8.286363 7.66353 7.071548
Days payables outstanding 44.40389
42.7304
4 41.97741 40.58104 46.16319
Cash conversion cycle 25.55 25.08 26.88 27.61 20.09
in their capital structure would directly reduce the level of net income and increase finance cost.
Hence, there is a direct link between the capital structure and profitability conditions of the
organization. In addition, the capital acquired from the capital structure would also have a direct
impact on the profitability ratios of the organization, where return on equity calculations is
derived by dividing the level of net income with the total equity investments. Hence, it could be
determined that there is a positive and direct link between the capital structure and profitability
conditions of the organization.
d) Calculating the Cash Conversion Cycle (CCC) of the company and detect its
performance over the period of 5 years:
Particulars 2018 2017 2016 2015 2014
Days inventory outstanding 59.34529
58.3558
8 60.57402 60.52433 59.1843
Days receivables
outstanding 10.60499
9.45812
4 8.286363 7.66353 7.071548
Days payables outstanding 44.40389
42.7304
4 41.97741 40.58104 46.16319
Cash conversion cycle 25.55 25.08 26.88 27.61 20.09
Paraphrase This Document
Need a fresh take? Get an instant paraphrase of this document with our AI Paraphraser
10FINANCE PORTFOLIO MANAGEMENT
2018 2017 2016 2015 2014
0.00
5.00
10.00
15.00
20.00
25.00
30.00
25.55 25.08 26.88 27.61
20.09
Cash conversion cycle
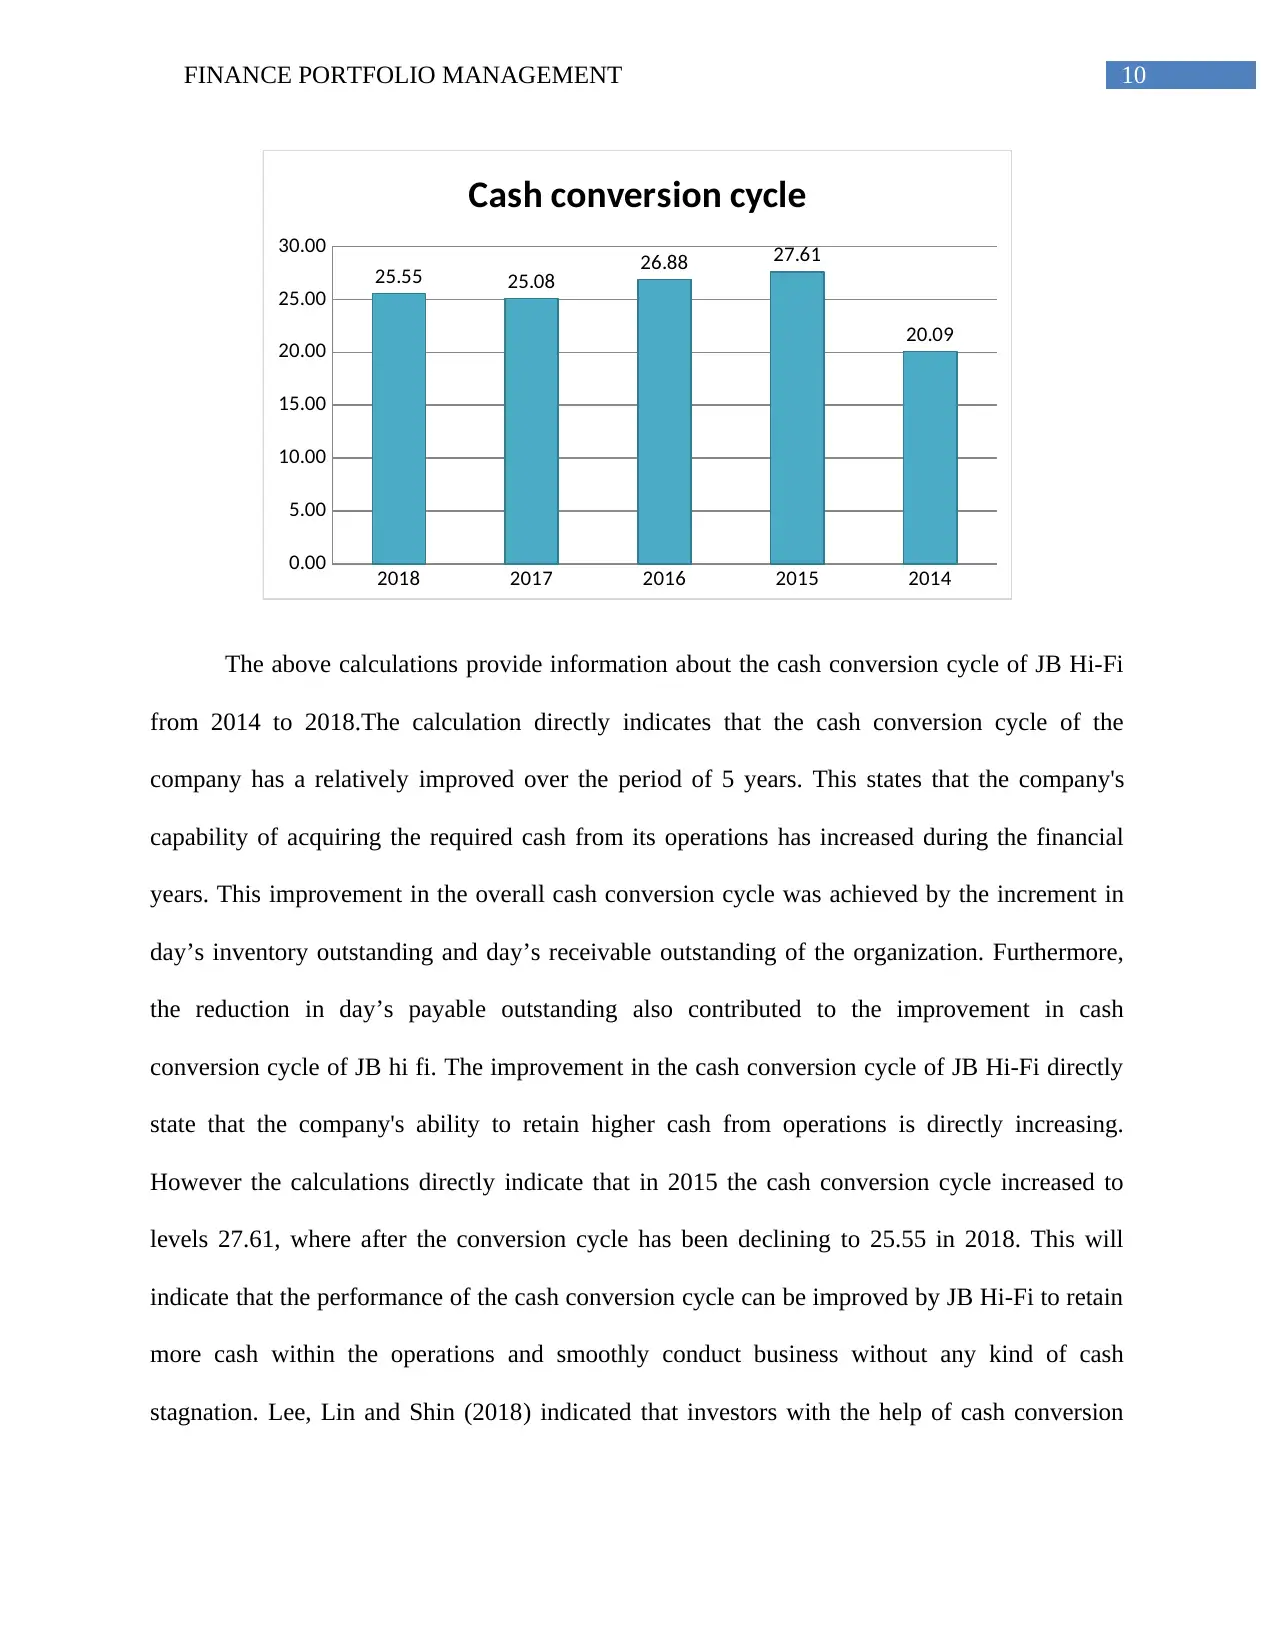
The above calculations provide information about the cash conversion cycle of JB Hi-Fi
from 2014 to 2018.The calculation directly indicates that the cash conversion cycle of the
company has a relatively improved over the period of 5 years. This states that the company's
capability of acquiring the required cash from its operations has increased during the financial
years. This improvement in the overall cash conversion cycle was achieved by the increment in
day’s inventory outstanding and day’s receivable outstanding of the organization. Furthermore,
the reduction in day’s payable outstanding also contributed to the improvement in cash
conversion cycle of JB hi fi. The improvement in the cash conversion cycle of JB Hi-Fi directly
state that the company's ability to retain higher cash from operations is directly increasing.
However the calculations directly indicate that in 2015 the cash conversion cycle increased to
levels 27.61, where after the conversion cycle has been declining to 25.55 in 2018. This will
indicate that the performance of the cash conversion cycle can be improved by JB Hi-Fi to retain
more cash within the operations and smoothly conduct business without any kind of cash
stagnation. Lee, Lin and Shin (2018) indicated that investors with the help of cash conversion
2018 2017 2016 2015 2014
0.00
5.00
10.00
15.00
20.00
25.00
30.00
25.55 25.08 26.88 27.61
20.09
Cash conversion cycle
The above calculations provide information about the cash conversion cycle of JB Hi-Fi
from 2014 to 2018.The calculation directly indicates that the cash conversion cycle of the
company has a relatively improved over the period of 5 years. This states that the company's
capability of acquiring the required cash from its operations has increased during the financial
years. This improvement in the overall cash conversion cycle was achieved by the increment in
day’s inventory outstanding and day’s receivable outstanding of the organization. Furthermore,
the reduction in day’s payable outstanding also contributed to the improvement in cash
conversion cycle of JB hi fi. The improvement in the cash conversion cycle of JB Hi-Fi directly
state that the company's ability to retain higher cash from operations is directly increasing.
However the calculations directly indicate that in 2015 the cash conversion cycle increased to
levels 27.61, where after the conversion cycle has been declining to 25.55 in 2018. This will
indicate that the performance of the cash conversion cycle can be improved by JB Hi-Fi to retain
more cash within the operations and smoothly conduct business without any kind of cash
stagnation. Lee, Lin and Shin (2018) indicated that investors with the help of cash conversion
11FINANCE PORTFOLIO MANAGEMENT
cycle is able to detect whether the performance of the management is efficiently being conducted
to minimize the negative impact on capital blockage.
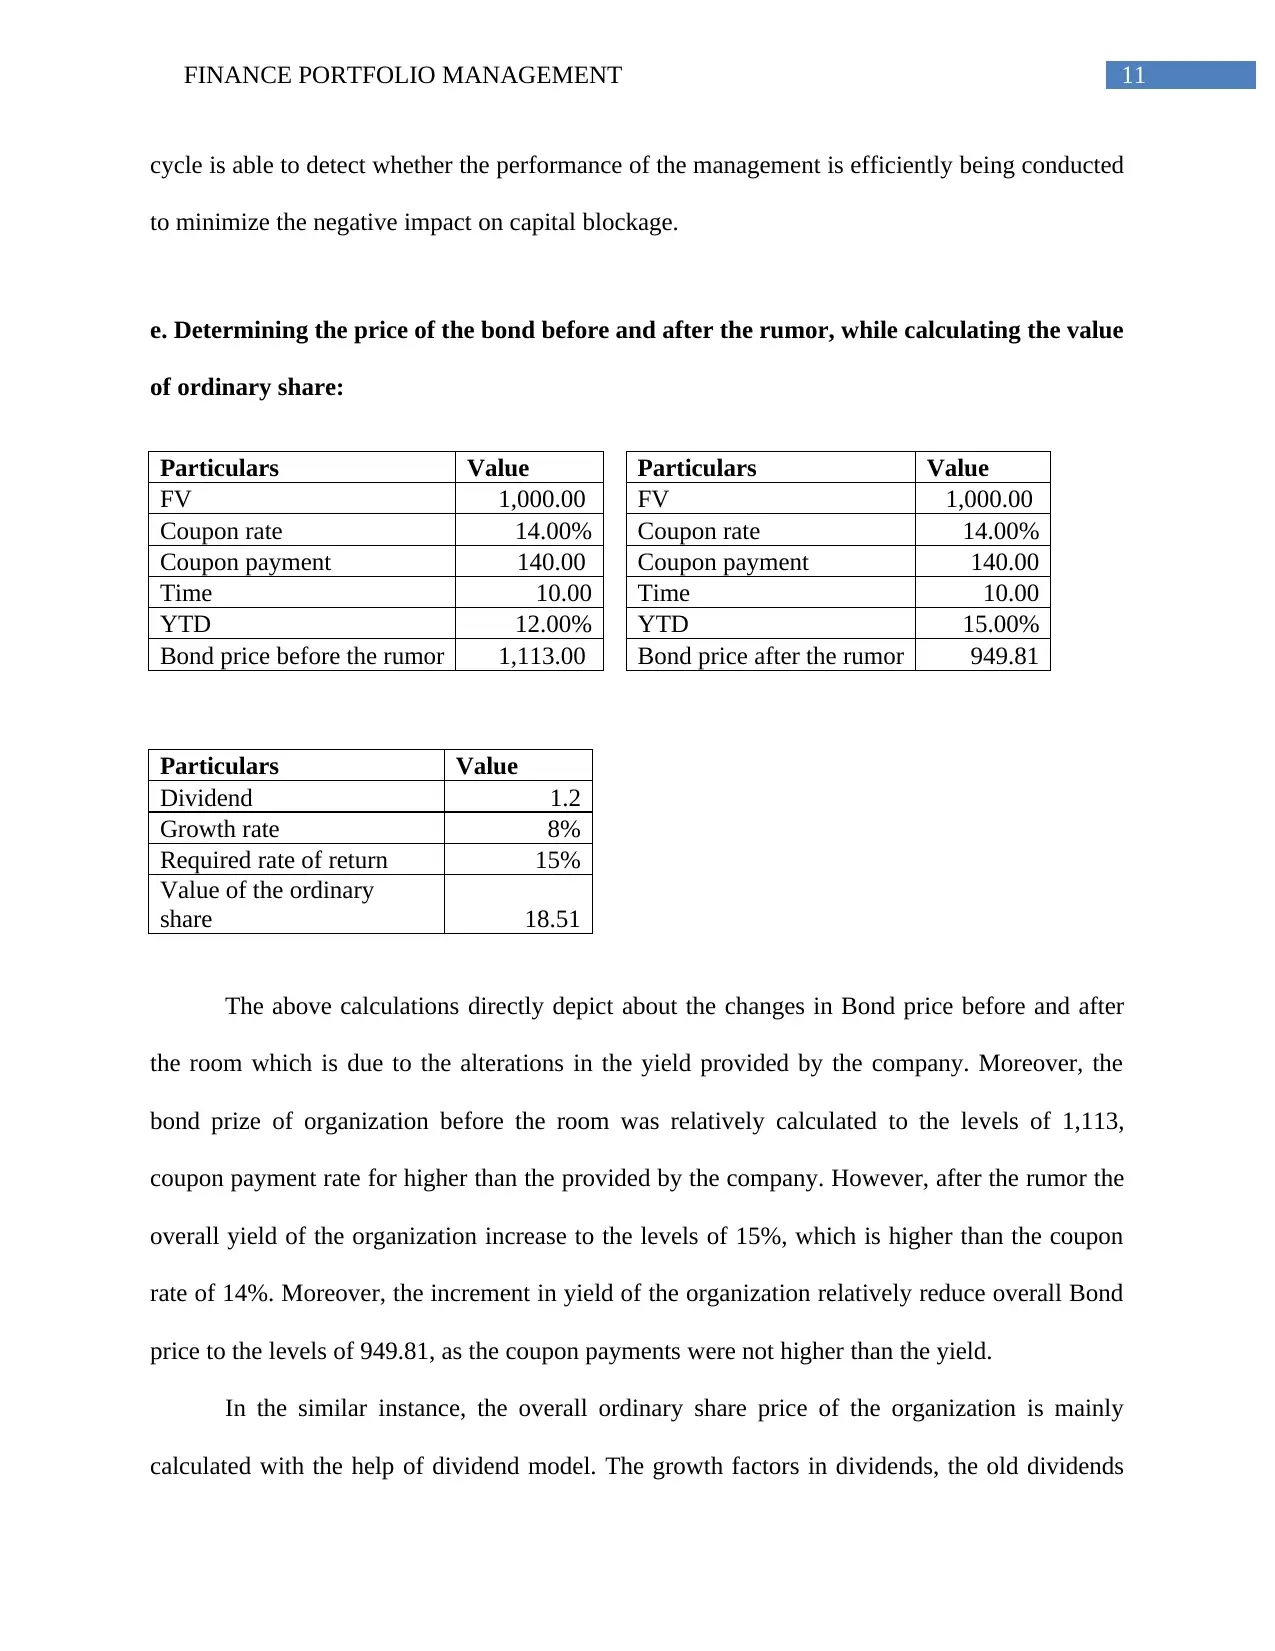
e. Determining the price of the bond before and after the rumor, while calculating the value
of ordinary share:
Particulars Value Particulars Value
FV 1,000.00 FV 1,000.00
Coupon rate 14.00% Coupon rate 14.00%
Coupon payment 140.00 Coupon payment 140.00
Time 10.00 Time 10.00
YTD 12.00% YTD 15.00%
Bond price before the rumor 1,113.00 Bond price after the rumor 949.81
Particulars Value
Dividend 1.2
Growth rate 8%
Required rate of return 15%
Value of the ordinary
share 18.51
The above calculations directly depict about the changes in Bond price before and after
the room which is due to the alterations in the yield provided by the company. Moreover, the
bond prize of organization before the room was relatively calculated to the levels of 1,113,
coupon payment rate for higher than the provided by the company. However, after the rumor the
overall yield of the organization increase to the levels of 15%, which is higher than the coupon
rate of 14%. Moreover, the increment in yield of the organization relatively reduce overall Bond
price to the levels of 949.81, as the coupon payments were not higher than the yield.
In the similar instance, the overall ordinary share price of the organization is mainly
calculated with the help of dividend model. The growth factors in dividends, the old dividends
cycle is able to detect whether the performance of the management is efficiently being conducted
to minimize the negative impact on capital blockage.
e. Determining the price of the bond before and after the rumor, while calculating the value
of ordinary share:
Particulars Value Particulars Value
FV 1,000.00 FV 1,000.00
Coupon rate 14.00% Coupon rate 14.00%
Coupon payment 140.00 Coupon payment 140.00
Time 10.00 Time 10.00
YTD 12.00% YTD 15.00%
Bond price before the rumor 1,113.00 Bond price after the rumor 949.81
Particulars Value
Dividend 1.2
Growth rate 8%
Required rate of return 15%
Value of the ordinary
share 18.51
The above calculations directly depict about the changes in Bond price before and after
the room which is due to the alterations in the yield provided by the company. Moreover, the
bond prize of organization before the room was relatively calculated to the levels of 1,113,
coupon payment rate for higher than the provided by the company. However, after the rumor the
overall yield of the organization increase to the levels of 15%, which is higher than the coupon
rate of 14%. Moreover, the increment in yield of the organization relatively reduce overall Bond
price to the levels of 949.81, as the coupon payments were not higher than the yield.
In the similar instance, the overall ordinary share price of the organization is mainly
calculated with the help of dividend model. The growth factors in dividends, the old dividends
⊘ This is a preview!⊘
Do you want full access?
Subscribe today to unlock all pages.
Trusted by 1+ million students worldwide
1 out of 16
Related Documents


Your All-in-One AI-Powered Toolkit for Academic Success.
+13062052269
info@desklib.com
Available 24*7 on WhatsApp / Email
![[object Object]](/_next/static/media/star-bottom.7253800d.svg)
Unlock your academic potential
Copyright © 2020–2026 A2Z Services. All Rights Reserved. Developed and managed by ZUCOL.