JB Hi-Fi & Good Guys Merger: Financial Performance and Truck Project

Verified

Added on  2019/09/30

|24
|4661
|227
Project
AI Summary
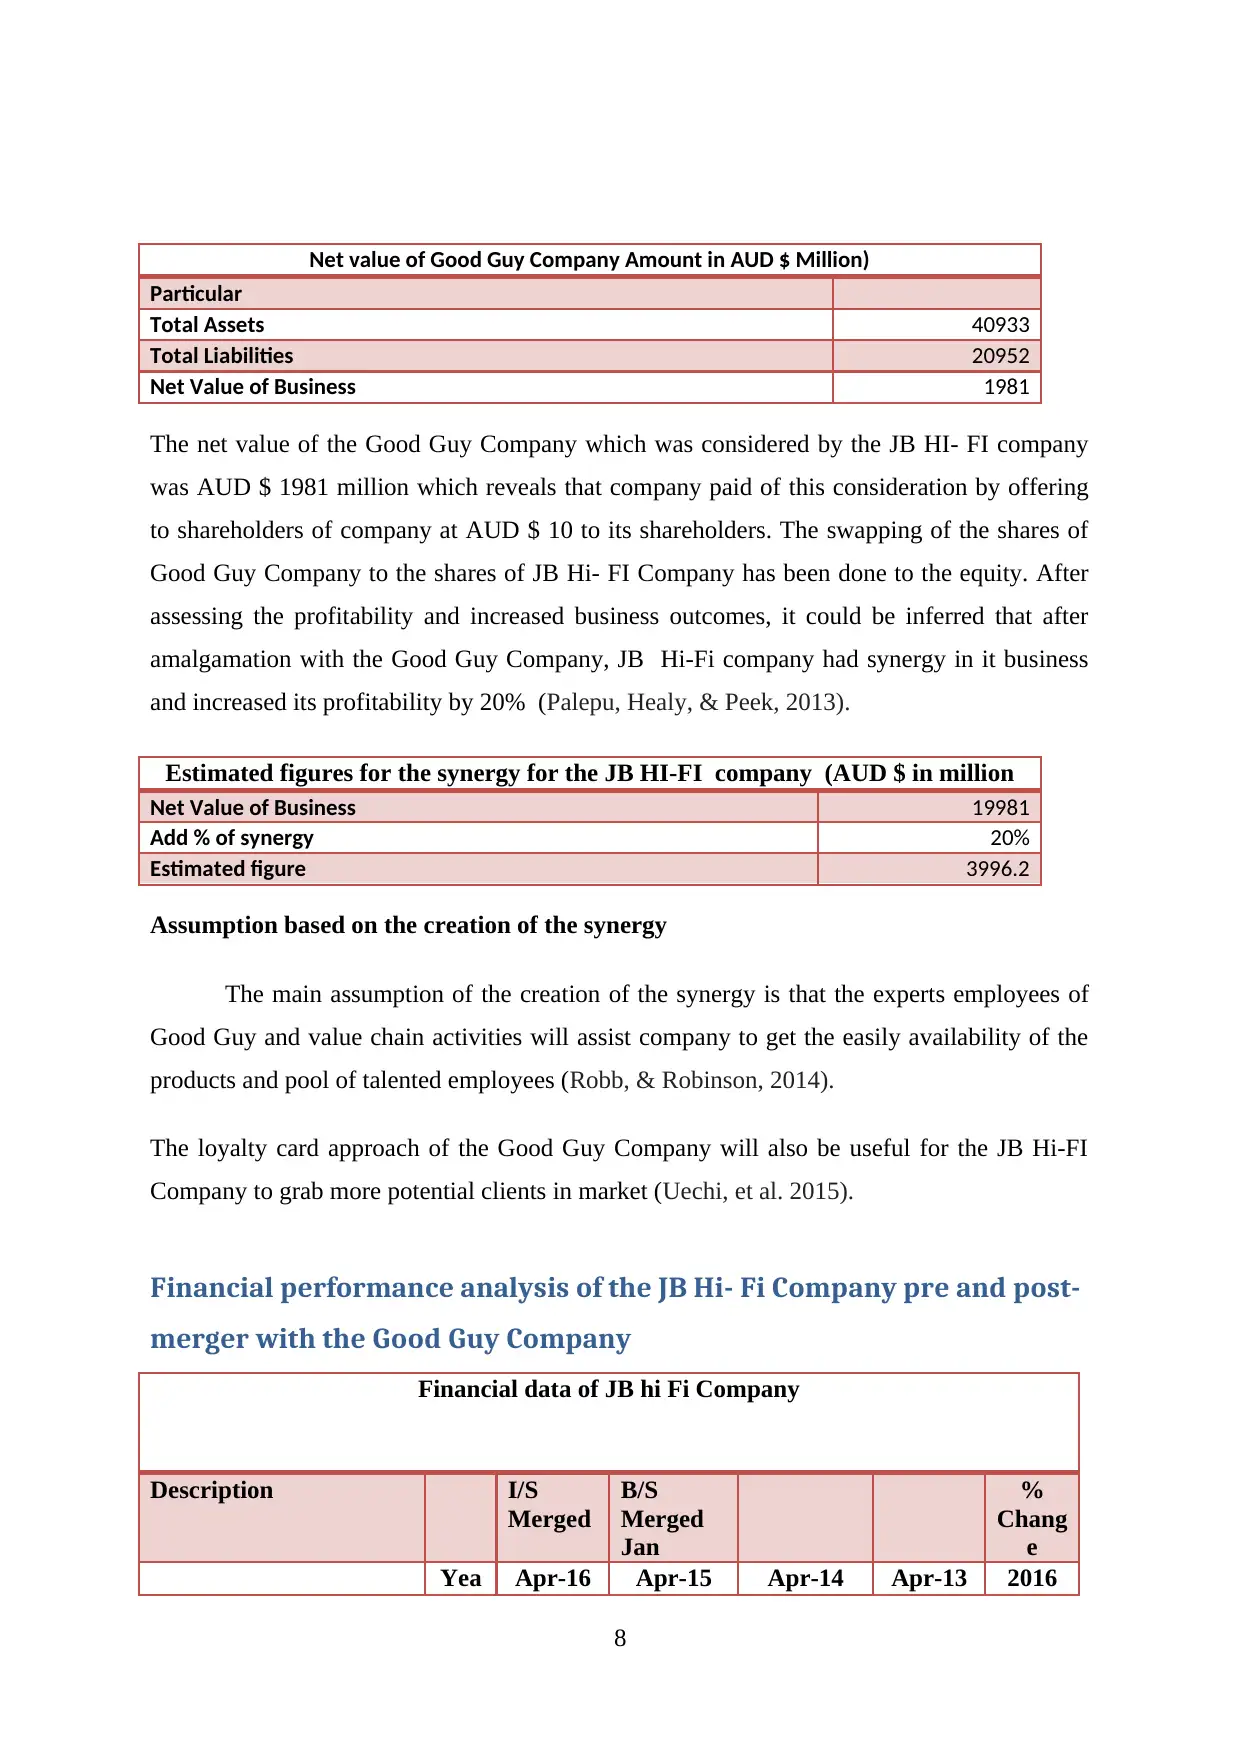
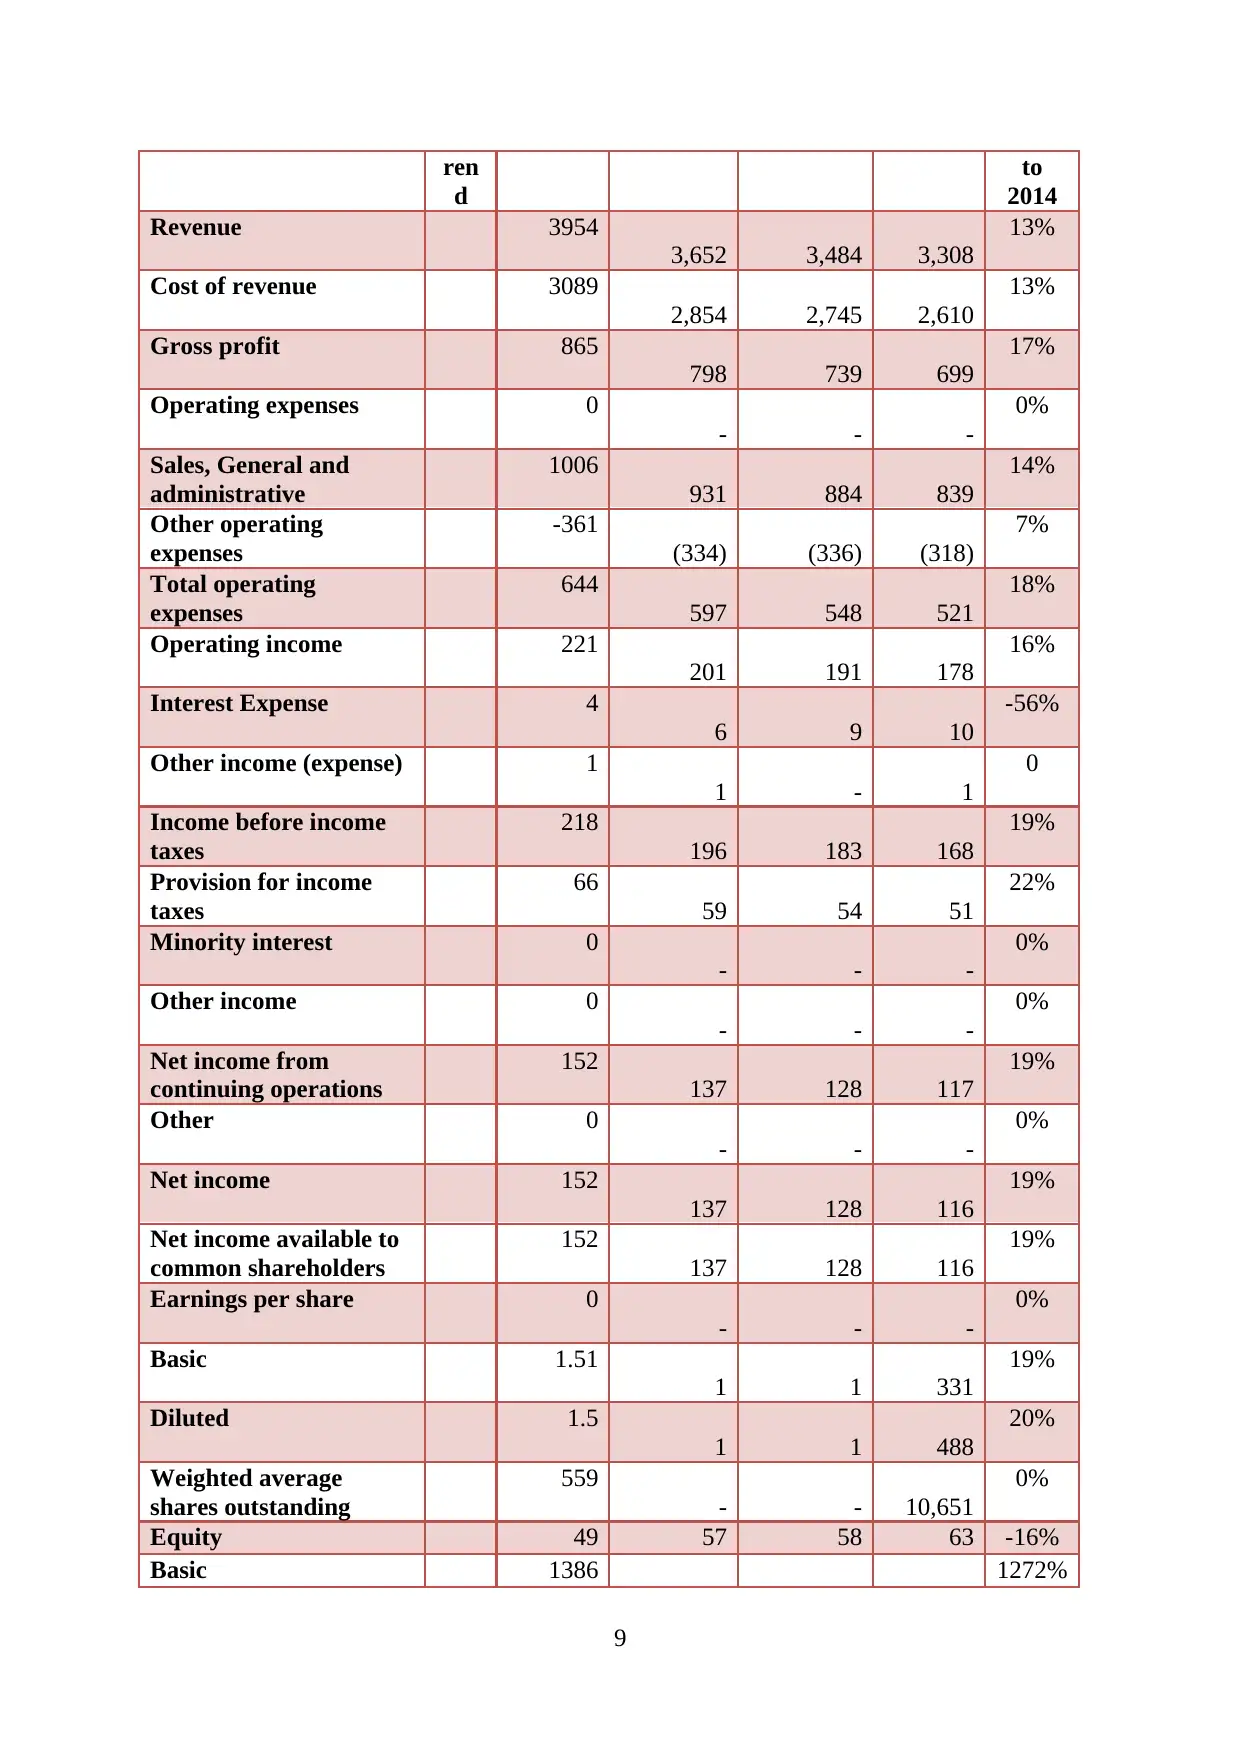
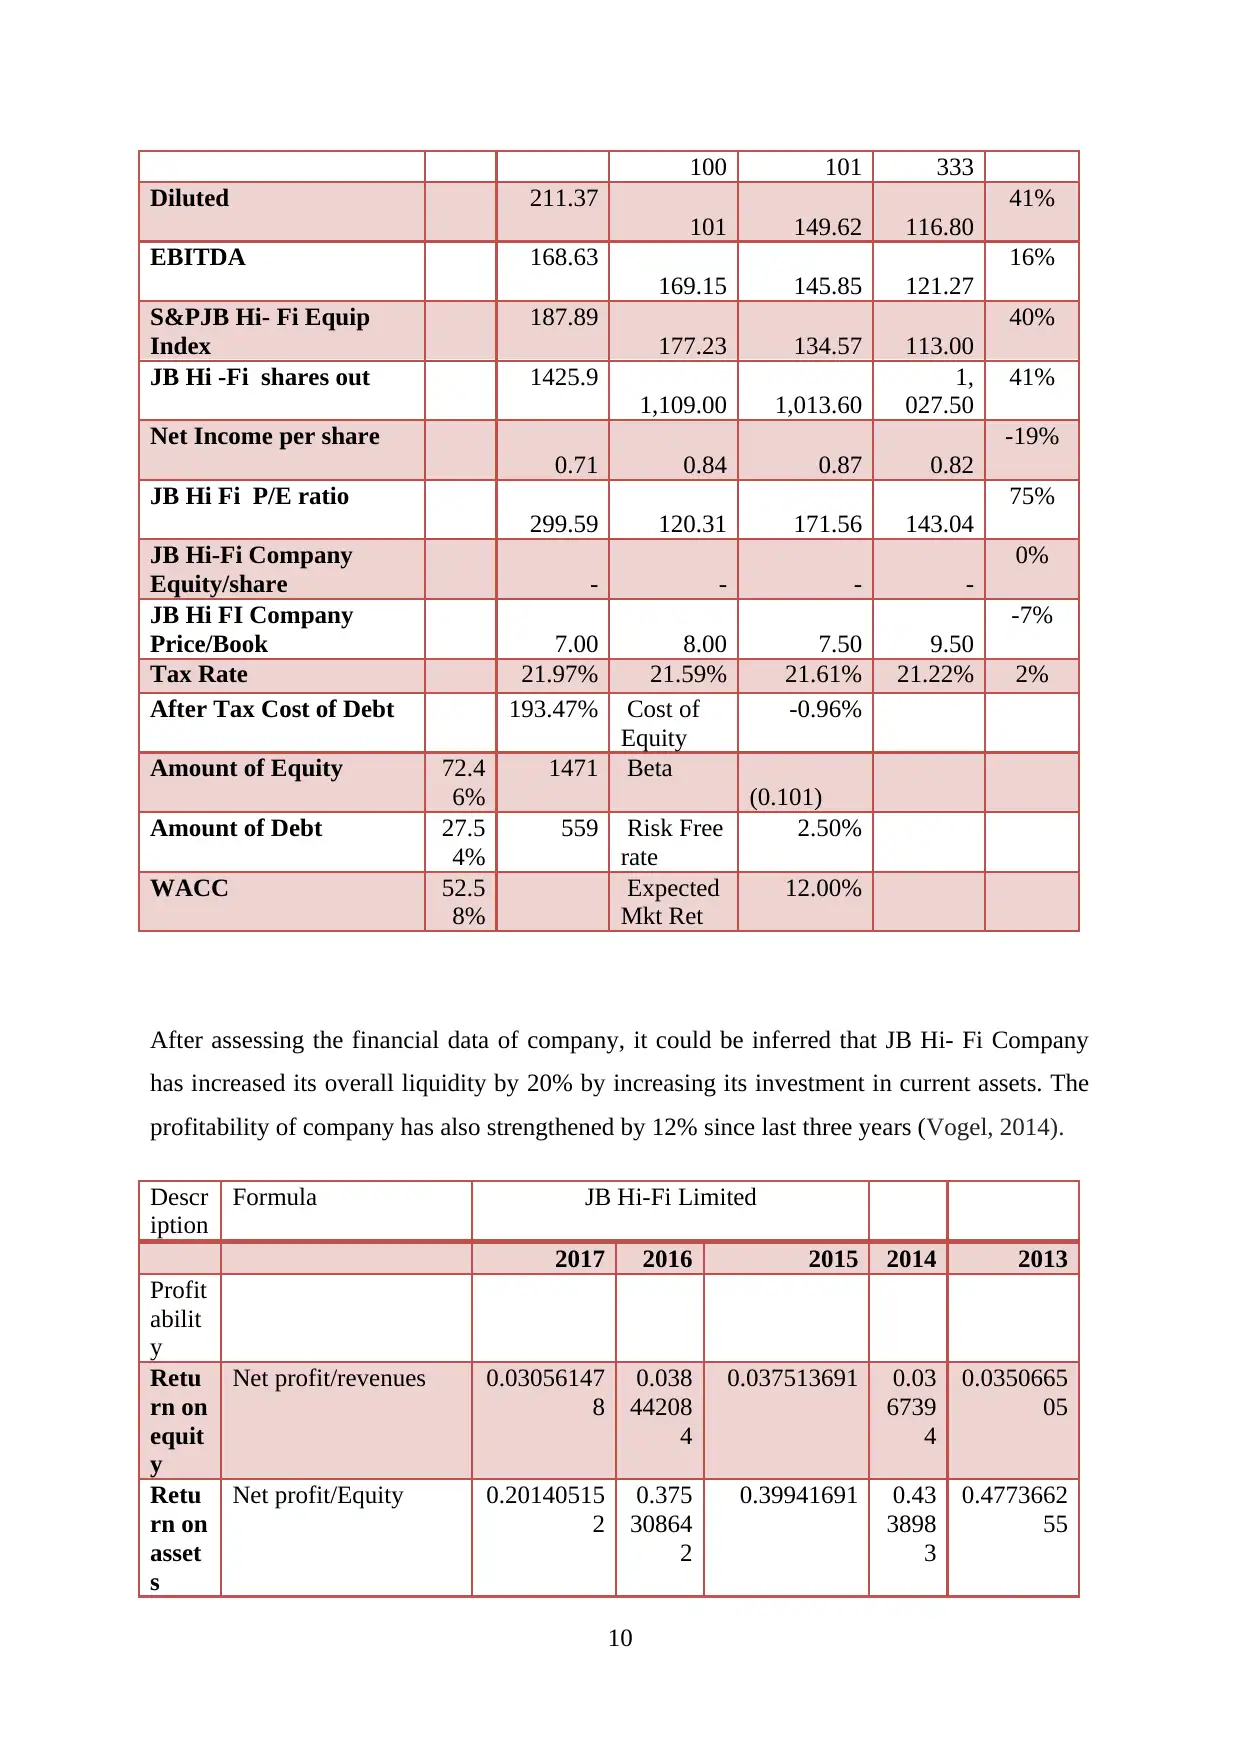
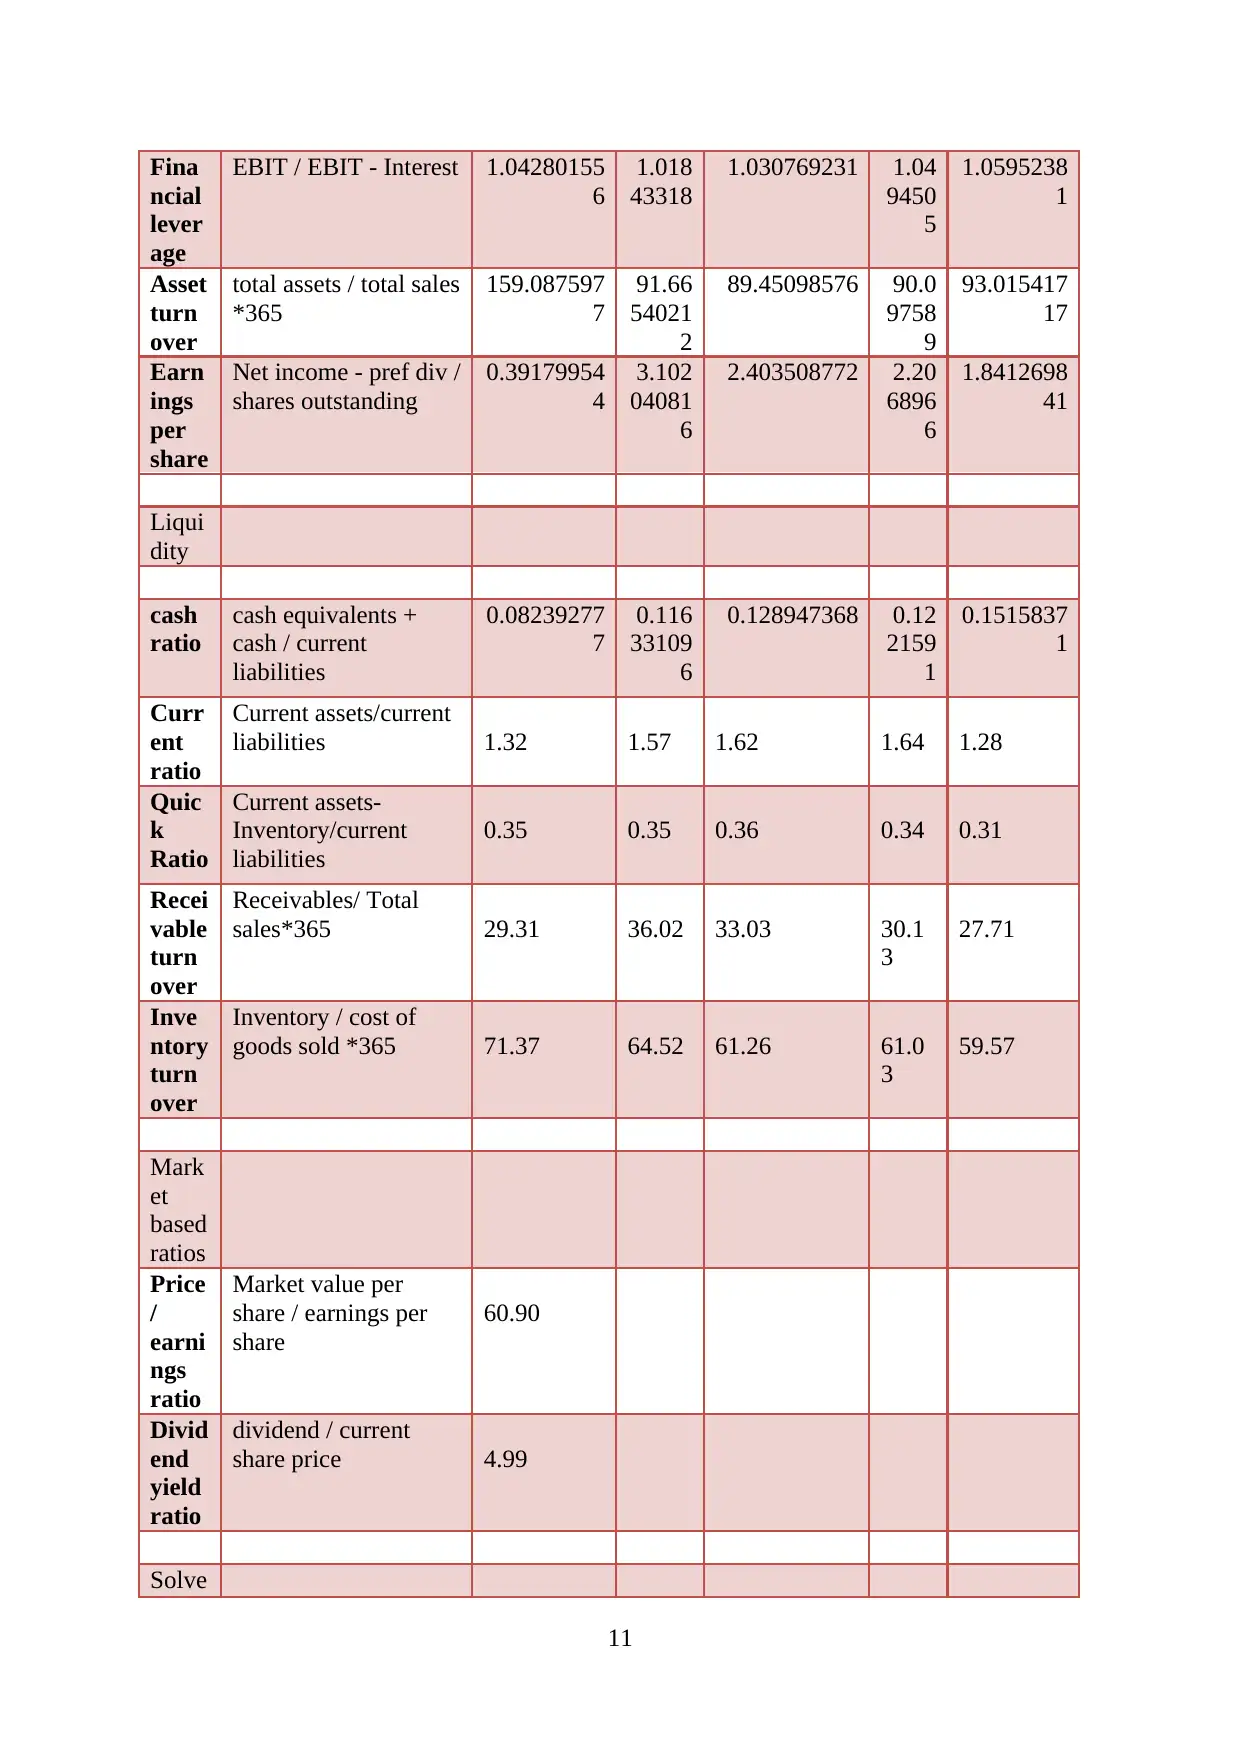
This project provides a comprehensive financial analysis of the JB Hi-Fi and Good Guys merger, focusing on the evaluation of a new truck project. The analysis includes calculating the net investment, operating cash flows, and Net Present Value (NPV) of the truck project. It further examines the market capitalization of JB Hi-Fi post-merger and delves into the pre and post-merger financial performance, including profitability, liquidity, and solvency ratios. The project also computes the cost of equity and the post-merger stock price. Key findings include an NPV of $4,134.48 for the truck project and insights into the synergy created by the merger, such as increased market share and improved financial ratios like return on equity and asset turnover. The report also addresses the impact of the merger on the company's debt-to-equity ratio and provides recommendations based on the financial analysis.
Document Page
JB Hi- FI company merged with GOod Guys Company
Amalgamation and Merger Acquisition analysis of new special-purpose truck
Business Finance
System-PPP
University Name-
EXECUTIVE SUMMARY
With the ramified economic changes, there are several financial analysis tools
which could be used by company to evaluate the post-merger and pre-merger options
available for the company. The capital budgeting tool is used to evaluate the financial
tabler-icon-diamond-filled.svg

Paraphrase This Document

Need a fresh take? Get an instant paraphrase of this document with our AI Paraphraser
Document Page
performance of company and its associated benefits with the proposed project. In this report,
net investment to buy the new truck project has been analyzed by evaluating the cash outflow
and NPV of the project. This report reveals the details analysis of the pre and post-merger
financial position of JB Hi-Fi Company.
.
1
Document Page
Table of Contents
EXECUTIVE SUMMARY........................................................................................................2
INTRODUCTION......................................................................................................................4
(a) What is the net investment in the truck project? (That is, what is the Year 0 net cash
flow?) 6
(b) What are the operating cash flows in Year 1 & 2?.........................................................6
(c). what is the NPV of this project?..........................................................................................7
Market capitalization of the JB HI- Fi Company after takeover of Good Guy Company.....8
Financial performance analysis of the JB Hi- Fi Company pre and post-merger with the Good
Guy Company............................................................................................................................9
Computation of the cost of equity of company....................................................................13
Cost of equity of company...............................................................................................13
Computation of the Post-Merger stock Price of JB Hi- FI Company..............................14
Recommendation and conclusion............................................................................................15
References................................................................................................................................16
Appendix..................................................................................................................................18
2
Document Page
INTRODUCTION
The project selection and evaluation is critical process which helps in identification of
the possible benefits and losses to organization after accepting the project. The capital
budgeting tool, top down analysis, bottom up analysis, du pont analysis are used to analysis
the financial performance of company. This report will focuses on the financial performance
of company and how well company will functions after accepting the new truck project.
Description of the JB Hi- Fi Company
It is an Australian Company indulged in consumer goods selling and specialised in the
electronic video games, HD ultra-blue rays and retail selling of the DVD and CD electronic
hardware appliances. All the employees are accustomed to act as per the directions of CEO
Richard Murray. The current share price of company has been traded at
JBH (ASX) A$ 25.00 -0.28 (-1.11%). Currently, total turnover of JB Hi-Fi Company
increased to AUD $ AUD $ 1125 billion. The net profit and overall turnover of JB Hi-Fi
Company has increased by 12% after merging with the Good Guy Company (JB HI-FI,
2017).
During the research, it was found that JB Hi- Fi Company acquired Good Guy
Company with a view to strengthen its busienss outcomes and grabbing more market share by
using the loyalty card and manpower of Good Guy Company.
3
tabler-icon-diamond-filled.svg

Paraphrase This Document

Need a fresh take? Get an instant paraphrase of this document with our AI Paraphraser
Document Page
(JB HI-FI, 2017).
4
Document Page
(a) What is the net investment in the truck project? (That is,
what is the Year 0 net cash flow?)
The net investment is the amount of cash outflow which is required to accept the particular
project. The net investment in the truck project is the amount of consideration paid to truck
project seller (Garrett, Hoitash & Prawitt, 2014).
Computation of the cash outflow for acquiring the new truck
Particular Amount in $
Initial investment $ 50,000.00
Additional costing $ 10,000.00
Inventory costing $ 2,000.00
Total Initial cash outflow $ 62,000.00
(b) What are the operating cash flows in Year 1 & 2?
The operating cash outflow is the amount of cash inflow which company would have after
accepting the particular project. It will be the possible benefits which company would have if
the truck project is accepted in company (Kundakchyan, & Zulfakarova, 20140.
Data Year Year Year
Particular 0 1 2
Total sales
$
-
$
20,000.00
$
20,000.00
(-) Variable Costs
$
-
$
-
$
-
Contribution
$
-
$
20,000.00
$
20,000.00
(-) Fixed Cost
$
-
$
-
$
-
Net Profit
$
-
$
20,000.00
$
20,000.00
(-)Depreciation
$
-
$
0.50
$
0.50
Net Profit before Tax
$
-
$
19,999.50
$
19,999.50
(-) Tax @40%
$
-
$
7,999.80
$
7,999.80
Net Profit after tax
$
-
$
11,999.70
$
11,999.70
(+) Depreciation
$
-
$
5,500.00
$
5,500.00
Cash Inflows $ $ $
5
Document Page
- 17,499.70 17,499.70
(+) Salvage Value 40000
Working Capital 2000
Free Cash Flows in
Australian Dollars 0.00 17499.70 59499.70
(c). what is the NPV of this project?
The NPV is the net present value which reveals the differences between the present
value of cash inflow and present value of cash outflow. The NPV of the project is computed
as below (Lunev, et al. 2016).
Computation of the Net present value
of the Truck Project
Data Year Year Year
Particular 0 1 2
Total sales
$
-
$
20,000.00
$
20,000.00
(-) Variable Costs
$
-
$
-
$
-
Contribution
$
-
$
20,000.00
$
20,000.00
(-) Fixed Cost
$
-
$
-
$
-
Net Profit
$
-
$
20,000.00
$
20,000.00
(-)Depreciation
$
-
$
0.50
$
0.50
Net Profit before Tax
$
-
$
19,999.50
$
19,999.50
(-) Tax @40%
$
-
$
7,999.80
$
7,999.80
Net Profit after tax
$
-
$
11,999.70
$
11,999.70
(+) Depreciation
$
-
$
5,500.00
$
5,500.00
Cash Inflows
$
-
$
17,499.70
$
17,499.70
(+) Salvage Value 40000
Working Capital 2000
Free Cash Flows in 0.00 17499.70 59499.70
6
tabler-icon-diamond-filled.svg

Paraphrase This Document

Need a fresh take? Get an instant paraphrase of this document with our AI Paraphraser
Document Page
Australian Dollars
*Present value factor
@9% 1.000 0.917 0.842
Present Value
$
-
$
16,054.77
$
50,079.71
Total Present values(A)
$
66,134.48
(-)Cash Outflows
Initial investment
$
50,000.00
Working capital
investment
$
2,000.00
(+)Cost Of equipment
$
10,000.00
Total(B)
$
62,000.00
Net Present Value(A-
B) 4,134.48
Market capitalization of the JB HI- Fi Company after takeover of Good Guy
Company
The market capitalization is the total value of the company which is equal to the price of the
total number of the shares outstanding in the market (Ehiedu, 2014). Before merging with
the Good Guy Company, the market capitalization was AUD$ 1212 million which increased
to AUD $ 1933 million after merging with the Good Guy Company (Palepu, Healy, & Peek,
2013).
7
Document Page
Net value of Good Guy Company Amount in AUD $ Million)
Particular
Total Assets 40933
Total Liabilities 20952
Net Value of Business 1981
The net value of the Good Guy Company which was considered by the JB HI- FI company
was AUD $ 1981 million which reveals that company paid of this consideration by offering
to shareholders of company at AUD $ 10 to its shareholders. The swapping of the shares of
Good Guy Company to the shares of JB Hi- FI Company has been done to the equity. After
assessing the profitability and increased business outcomes, it could be inferred that after
amalgamation with the Good Guy Company, JB Hi-Fi company had synergy in it business
and increased its profitability by 20% (Palepu, Healy, & Peek, 2013).
Estimated figures for the synergy for the JB HI-FI company (AUD $ in million
Net Value of Business 19981
Add % of synergy 20%
Estimated figure 3996.2
Assumption based on the creation of the synergy
The main assumption of the creation of the synergy is that the experts employees of
Good Guy and value chain activities will assist company to get the easily availability of the
products and pool of talented employees (Robb, & Robinson, 2014).
The loyalty card approach of the Good Guy Company will also be useful for the JB Hi-FI
Company to grab more potential clients in market (Uechi, et al. 2015).
Financial performance analysis of the JB Hi- Fi Company pre and post-
merger with the Good Guy Company
Financial data of JB hi Fi Company
Description I/S
Merged
B/S
Merged
Jan
%
Chang
e
Yea Apr-16 Apr-15 Apr-14 Apr-13 2016
8
Document Page
ren
d
to
2014
Revenue 3954
3,652 3,484 3,308
13%
Cost of revenue 3089
2,854 2,745 2,610
13%
Gross profit 865
798 739 699
17%
Operating expenses 0
- - -
0%
Sales, General and
administrative
1006
931 884 839
14%
Other operating
expenses
-361
(334) (336) (318)
7%
Total operating
expenses
644
597 548 521
18%
Operating income 221
201 191 178
16%
Interest Expense 4
6 9 10
-56%
Other income (expense) 1
1 - 1
0
Income before income
taxes
218
196 183 168
19%
Provision for income
taxes
66
59 54 51
22%
Minority interest 0
- - -
0%
Other income 0
- - -
0%
Net income from
continuing operations
152
137 128 117
19%
Other 0
- - -
0%
Net income 152
137 128 116
19%
Net income available to
common shareholders
152
137 128 116
19%
Earnings per share 0
- - -
0%
Basic 1.51
1 1 331
19%
Diluted 1.5
1 1 488
20%
Weighted average
shares outstanding
559
- - 10,651
0%
Equity 49 57 58 63 -16%
Basic 1386 1272%
9
tabler-icon-diamond-filled.svg

Paraphrase This Document

Need a fresh take? Get an instant paraphrase of this document with our AI Paraphraser
Document Page
100 101 333
Diluted 211.37
101 149.62 116.80
41%
EBITDA 168.63
169.15 145.85 121.27
16%
S&PJB Hi- Fi Equip
Index
187.89
177.23 134.57 113.00
40%
JB Hi -Fi shares out 1425.9
1,109.00 1,013.60
1,
027.50
41%
Net Income per share
0.71 0.84 0.87 0.82
-19%
JB Hi Fi P/E ratio
299.59 120.31 171.56 143.04
75%
JB Hi-Fi Company
Equity/share - - - -
0%
JB Hi FI Company
Price/Book 7.00 8.00 7.50 9.50
-7%
Tax Rate 21.97% 21.59% 21.61% 21.22% 2%
After Tax Cost of Debt 193.47% Cost of
Equity
-0.96%
Amount of Equity 72.4
6%
1471 Beta
(0.101)
Amount of Debt 27.5
4%
559 Risk Free
rate
2.50%
WACC 52.5
8%
Expected
Mkt Ret
12.00%
After assessing the financial data of company, it could be inferred that JB Hi- Fi Company
has increased its overall liquidity by 20% by increasing its investment in current assets. The
profitability of company has also strengthened by 12% since last three years (Vogel, 2014).
Descr
iption
Formula JB Hi-Fi Limited
2017 2016 2015 2014 2013
Profit
abilit
y
Retu
rn on
equit
y
Net profit/revenues 0.03056147
8
0.038
44208
4
0.037513691 0.03
6739
4
0.0350665
05
Retu
rn on
asset
s
Net profit/Equity 0.20140515
2
0.375
30864
2
0.39941691 0.43
3898
3
0.4773662
55
10
Document Page
Fina
ncial
lever
age
EBIT / EBIT - Interest 1.04280155
6
1.018
43318
1.030769231 1.04
9450
5
1.0595238
1
Asset
turn
over
total assets / total sales
*365
159.087597
7
91.66
54021
2
89.45098576 90.0
9758
9
93.015417
17
Earn
ings
per
share
Net income - pref div /
shares outstanding
0.39179954
4
3.102
04081
6
2.403508772 2.20
6896
6
1.8412698
41
Liqui
dity
cash
ratio
cash equivalents +
cash / current
liabilities
0.08239277
7
0.116
33109
6
0.128947368 0.12
2159
1
0.1515837
1
Curr
ent
ratio
Current assets/current
liabilities 1.32 1.57 1.62 1.64 1.28
Quic
k
Ratio
Current assets-
Inventory/current
liabilities
0.35 0.35 0.36 0.34 0.31
Recei
vable
turn
over
Receivables/ Total
sales*365 29.31 36.02 33.03 30.1
3
27.71
Inve
ntory
turn
over
Inventory / cost of
goods sold *365 71.37 64.52 61.26 61.0
3
59.57
Mark
et
based
ratios
Price
/
earni
ngs
ratio
Market value per
share / earnings per
share
60.90
Divid
end
yield
ratio
dividend / current
share price 4.99
Solve
11
chevron_up_icon
1 out of 24
circle_padding
hide_on_mobile
zoom_out_icon
[object Object]