7242AFE Equity Investments: JB Hi Fi Stock Analysis Report

Verified

Added on  2022/10/12

|8
|398
|11
Report
AI Summary
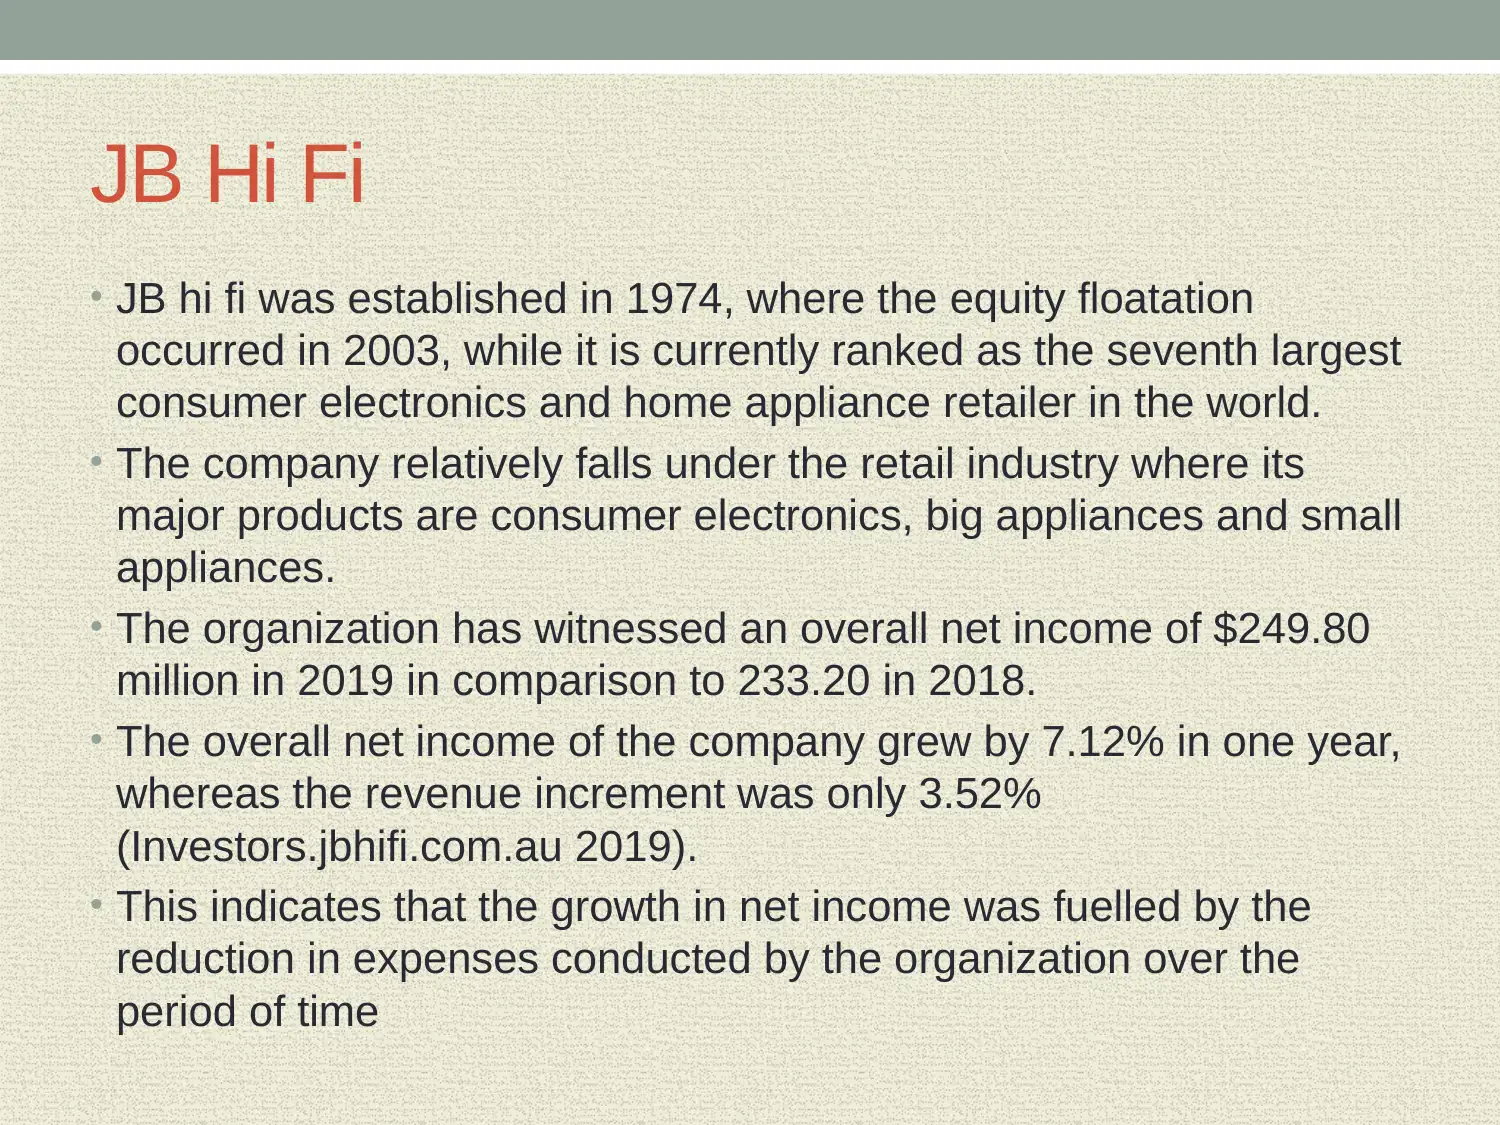
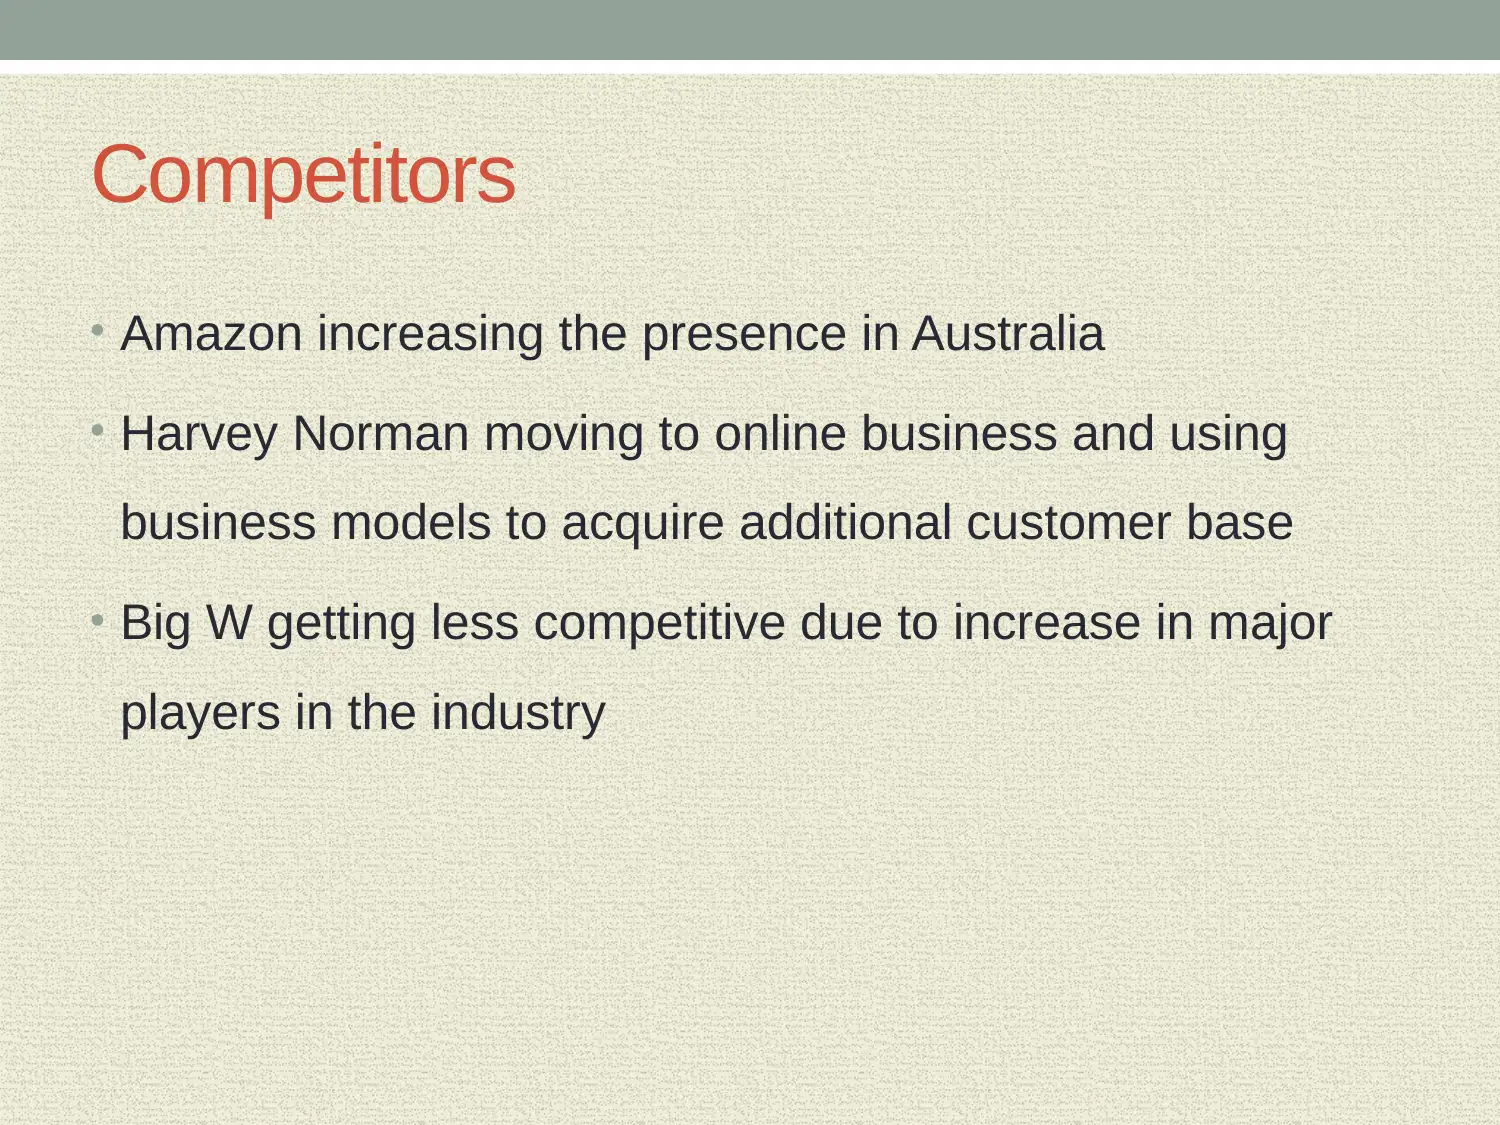
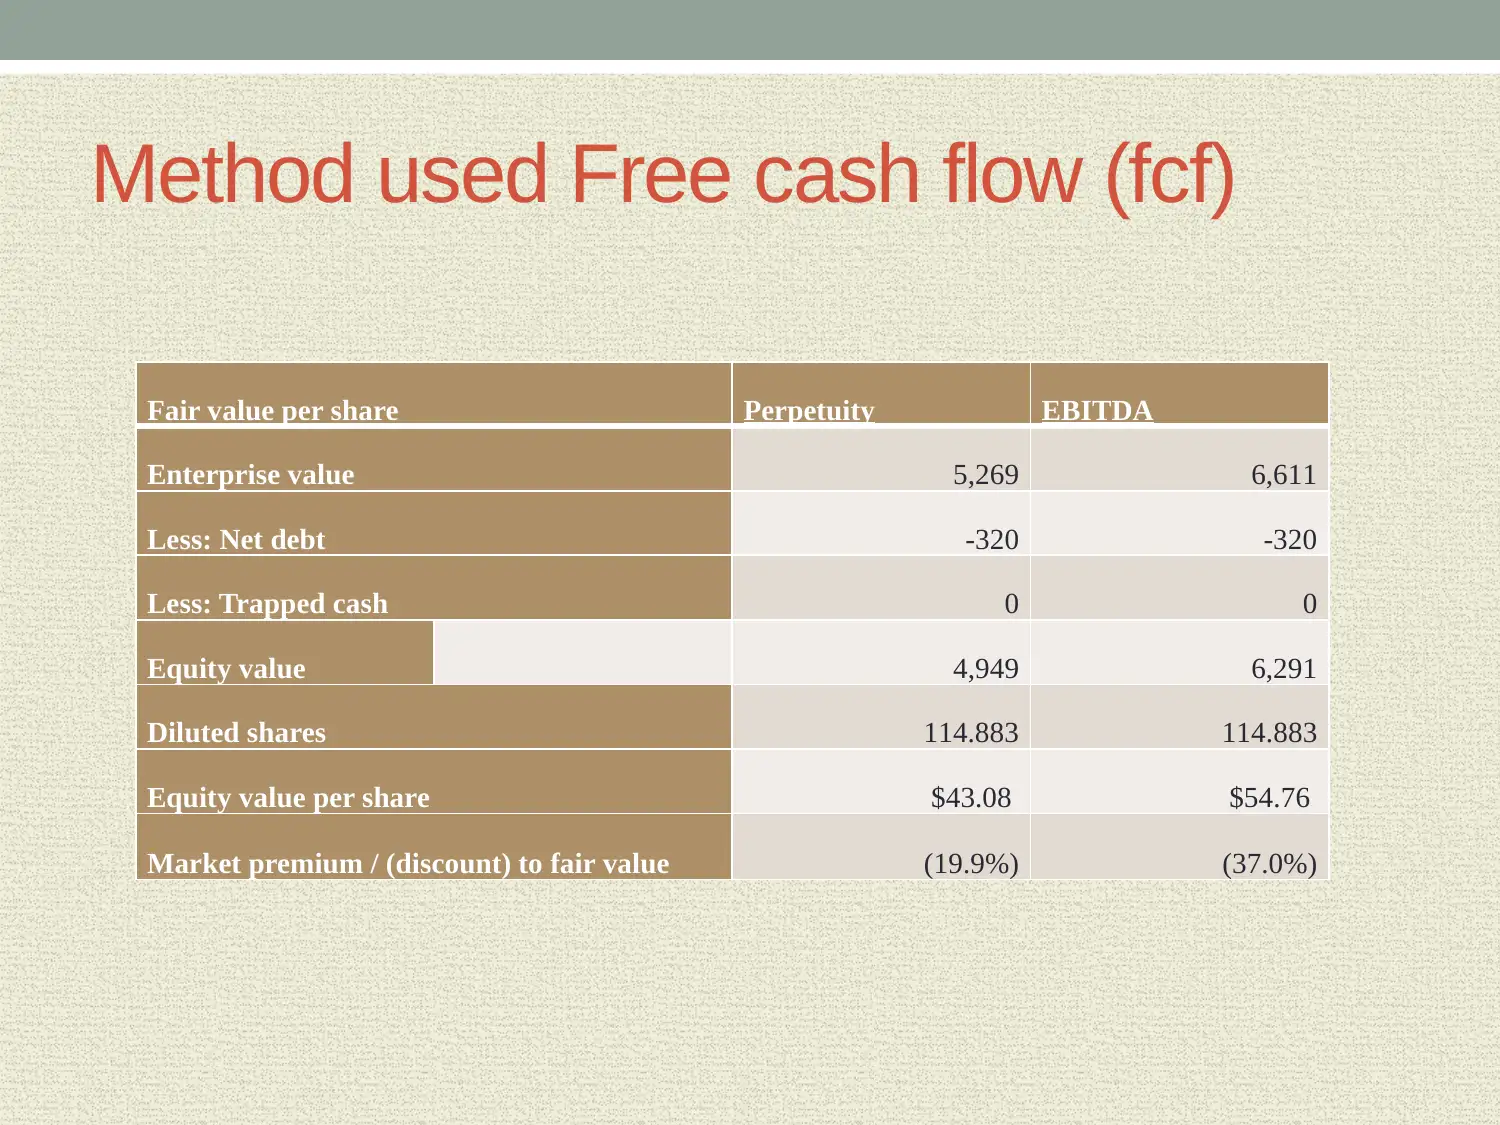
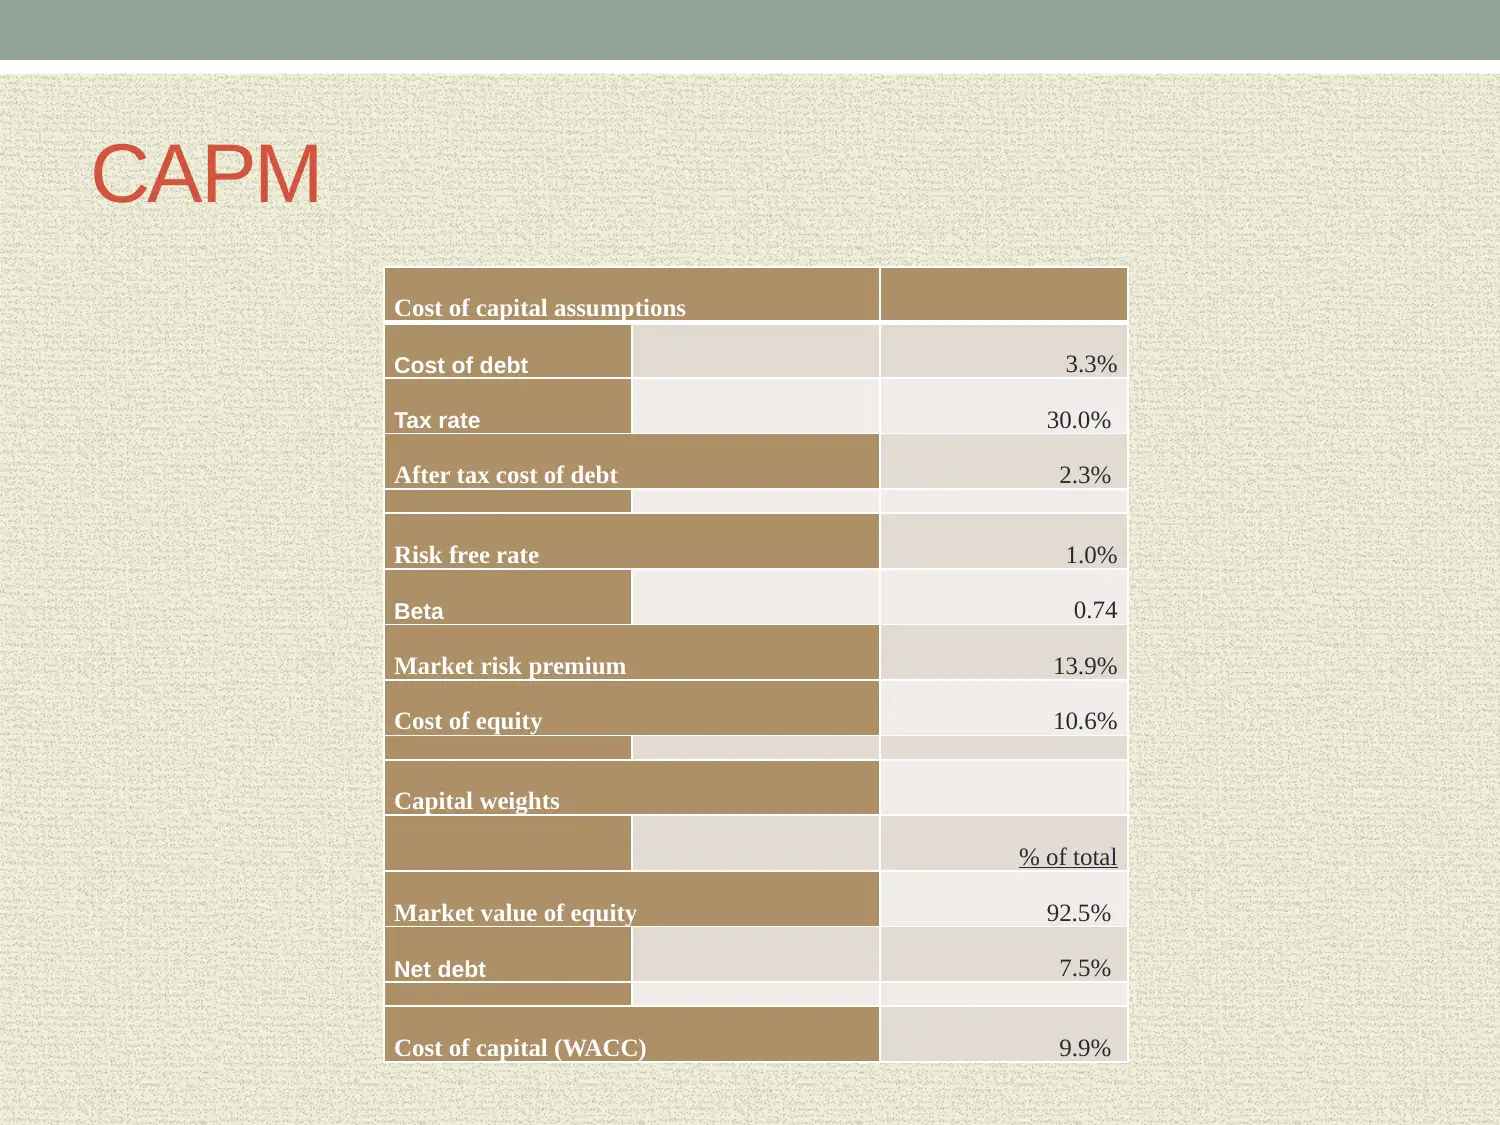
This report provides a comprehensive analysis of JB Hi Fi as a potential equity investment, examining its financial performance, industry position, and future prospects. The analysis includes an overview of JB Hi Fi's business operations, including its establishment and market ranking. The report delves into the company's financial data, highlighting revenue and net income trends, and identifies key competitors such as Amazon and Harvey Norman. The methodology used for valuation includes Free Cash Flow (FCF) and CAPM models. The report assesses the pros and cons of investing in JB Hi Fi, considering factors such as market competition, consumer loyalty, political factors, and the evolving retail landscape. The report concludes with a valuation of the stock and investment recommendations.
Document Page
JB HI FI
Equity Method of Investment
tabler-icon-diamond-filled.svg

Paraphrase This Document

Need a fresh take? Get an instant paraphrase of this document with our AI Paraphraser
Document Page
JB Hi Fi
JB hi fi was established in 1974, where the equity floatation
occurred in 2003, while it is currently ranked as the seventh largest
consumer electronics and home appliance retailer in the world.
The company relatively falls under the retail industry where its
major products are consumer electronics, big appliances and small
appliances.
The organization has witnessed an overall net income of $249.80
million in 2019 in comparison to 233.20 in 2018.
The overall net income of the company grew by 7.12% in one year,
whereas the revenue increment was only 3.52%
(Investors.jbhifi.com.au 2019).
This indicates that the growth in net income was fuelled by the
reduction in expenses conducted by the organization over the
period of time
Document Page
Competitors
Amazon increasing the presence in Australia
Harvey Norman moving to online business and using
business models to acquire additional customer base
Big W getting less competitive due to increase in major
players in the industry
Document Page
Method used Free cash flow (fcf)
Fair value per share Perpetuity EBITDA
Enterprise value 5,269 6,611
Less: Net debt -320 -320
Less: Trapped cash 0 0
Equity value 4,949 6,291
Diluted shares 114.883 114.883
Equity value per share $43.08 $54.76
Market premium / (discount) to fair value (19.9%) (37.0%)
tabler-icon-diamond-filled.svg

Paraphrase This Document

Need a fresh take? Get an instant paraphrase of this document with our AI Paraphraser
Document Page
CAPM
Cost of capital assumptions
Cost of debt 3.3%
Tax rate 30.0%
After tax cost of debt 2.3%
Risk free rate 1.0%
Beta 0.74
Market risk premium 13.9%
Cost of equity 10.6%
Capital weights
% of total
Market value of equity 92.5%
Net debt 7.5%
Cost of capital (WACC) 9.9%
Document Page
Why should you invest in flt
The financial analysis of JB Hi Fi directly helps in
understanding the current progression of the company,
which is relatively used for projecting future incomes.
In addition, the industry overview and competitive
positioning of JB Hi Fi is also detected to be positive, which
will contribute to the future incomes of the organization.
Thus, investments in JB Hi Fi would be attractive and
strategic move by an investor, as it would ensure high
growth and future income.
The DCF model has indicated that the current share price
value of the organization is at a discount, which would help
investors generate higher returns in the long run.
Document Page
Cons of investing
High competition of e-retailers
company does not have a business model, which
incentivizes for consumer loyalty
Unfavourable political stance in form of tariff, import tax
and quotas
Changing landscape of physical stores and increasing
demand for online stations
Reduced growth in net income and revenues
tabler-icon-diamond-filled.svg

Paraphrase This Document

Need a fresh take? Get an instant paraphrase of this document with our AI Paraphraser
Document Page
References
Investors.jbhifi.com.au. 2019. [online] Available at:
https://investors.jbhifi.com.au/wp-content/uploads/2019/08
/4E_FY19.pdf [Accessed 29 Sep. 2019].
Investors.jbhifi.com.au. 2019. [online] Available at:
https://investors.jbhifi.com.au/wp-content/uploads/2018/10
/Annual-Report-2018-with-Chairmans-CEOs-Report.pdf
[Accessed 29 Sep. 2019].
chevron_up_icon
1 out of 8
circle_padding
hide_on_mobile
zoom_out_icon
[object Object]