Financial Analysis & Acquisition Decision: JD Sport & J Barbour Ltd
VerifiedAdded on 2023/06/10
|28
|8494
|151
Report
AI Summary
This report provides a comprehensive financial analysis of JD Sport Fashion Plc and J Barbour & Son Ltd, examining the potential acquisition of J Barbour by JD Sport. The analysis includes a detailed ratio analysis covering profitability, asset management, liquidity, and investor relations, along with an assessment of capital structure and cost of capital. The report evaluates the purchase price, the potential impact on JD Sport's financial statements post-acquisition, and share price movements. Furthermore, it provides recommendations for improving the business structure, considering factors like financial performance, debt management, and investment strategies. The analysis considers the competitive landscape, comparing the companies to industry peers like WH Smith Plc, to provide a well-rounded perspective on the acquisition's financial implications. Desklib is your go-to platform for accessing similar solved assignments and study resources.

Running head: FINANICIAL MANAGEMENT
Financial Management
Name of the Student:
Name of the University:
Author’s Note
Financial Management
Name of the Student:
Name of the University:
Author’s Note
Paraphrase This Document
Need a fresh take? Get an instant paraphrase of this document with our AI Paraphraser
1
FINANICIAL MANAGEMENT
Executive Summary
The main purpose of this assessment is to analyze the financial performance of two companies
and also take an acquisition decision rgarding whether the management of JD Sport Fashion Plc
will purchase the enterprise of J Barbour & Son Ltd. In order to do so, the assessment will be
containing ratio analysis with result interpretation for the same, capital structure and cost of
capital related decisions of the business. The assessment will be also showing the changes which
takes place in the business and the overall impact on the profitability is also shown in the
assessment. The assessment will also show impact on the financial statements after the
acquisition process is implemented and the various disclosures which are related to the same.
Lastly, this assessment will be suggesting recommendation to the management as to how the
business structure can further be improved.
2
FINANICIAL MANAGEMENT
Table of Contents
Introduction......................................................................................................................................3
Financial Analysis of the Companies..............................................................................................3
Profitability Ratios.......................................................................................................................4
Asset Management Ratios...........................................................................................................6
Liquidity Ratios...........................................................................................................................8
Investor Relation Ratios............................................................................................................10
Cost of Capital Analysis................................................................................................................12
Purchase Price of the Business......................................................................................................14
Impact on the Financial Statements of the business......................................................................15
Share Price Movements.................................................................................................................15
Recommendation...........................................................................................................................16
Reference.......................................................................................................................................17
Appendix........................................................................................................................................19
⊘ This is a preview!⊘
Do you want full access?
Subscribe today to unlock all pages.
Trusted by 1+ million students worldwide
3
FINANICIAL MANAGEMENT
Introduction
The main purpose of this assessment is to analyze the business of JD Sport Fashion Plc
which is engaged in the business of providing retail services for products like sport goods and
fashion wears. The management of JD Sport Fashion Plc is thinking of purchasing the business
of J Barbour & Son Ltd for which the business needs to analyze the performance of both the
companies and also its close competitors. The assessment will be including analysis of cost of
capital for the companies and also share prices analysis of both the companies1. The assessment
will also be showing impact on the business of JD Sport Fashion Plc after the acquisition
process. The assessment will be including various calculations which will be included in the
appendi section of the assessment.
Financial Analysis of the Companies
The financial analysis of JD Sport Fashion Plc and J Barbour & Son Ltd is to be done
considering the profit and loss statement and balance sheet results of both the companies2. In
order to analyze the financial performance of the companies, significant ratios are computed
which are based on profitability, Asset management ratios, liquidity ratios and investors relation
ratios.
1 Ongore, Vincent Okoth, and Gemechu Berhanu Kusa. "Determinants of financial performance of commercial
banks in Kenya." International Journal of Economics and Financial Issues 3, no. 1 (2013): 237-252.
2 Boons, Frank, Carlos Montalvo, Jaco Quist, and Marcus Wagner. "Sustainable innovation, business models and
economic performance: an overview." Journal of Cleaner Production 45 (2013): 1-8.
Paraphrase This Document
Need a fresh take? Get an instant paraphrase of this document with our AI Paraphraser
4
FINANICIAL MANAGEMENT
Profitability Ratios
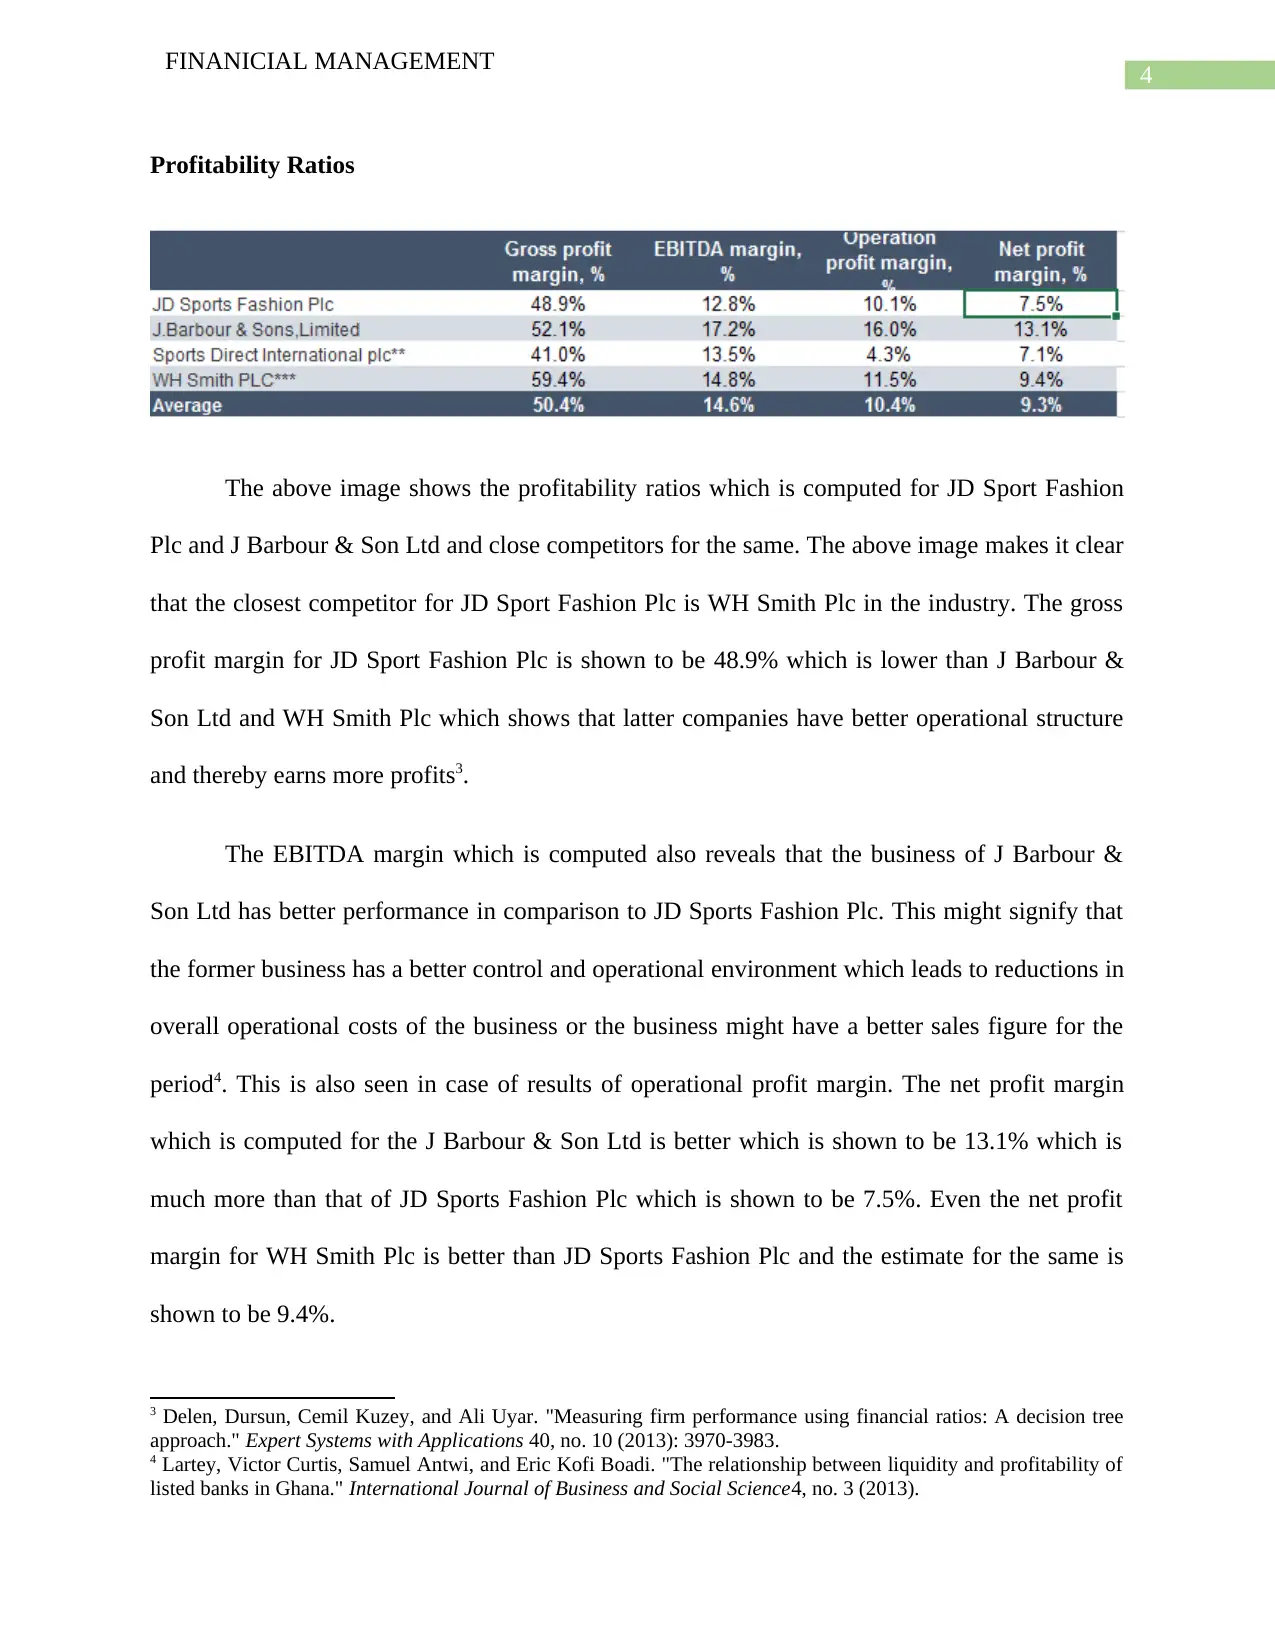
The above image shows the profitability ratios which is computed for JD Sport Fashion
Plc and J Barbour & Son Ltd and close competitors for the same. The above image makes it clear
that the closest competitor for JD Sport Fashion Plc is WH Smith Plc in the industry. The gross
profit margin for JD Sport Fashion Plc is shown to be 48.9% which is lower than J Barbour &
Son Ltd and WH Smith Plc which shows that latter companies have better operational structure
and thereby earns more profits3.
The EBITDA margin which is computed also reveals that the business of J Barbour &
Son Ltd has better performance in comparison to JD Sports Fashion Plc. This might signify that
the former business has a better control and operational environment which leads to reductions in
overall operational costs of the business or the business might have a better sales figure for the
period4. This is also seen in case of results of operational profit margin. The net profit margin
which is computed for the J Barbour & Son Ltd is better which is shown to be 13.1% which is
much more than that of JD Sports Fashion Plc which is shown to be 7.5%. Even the net profit
margin for WH Smith Plc is better than JD Sports Fashion Plc and the estimate for the same is
shown to be 9.4%.
3 Delen, Dursun, Cemil Kuzey, and Ali Uyar. "Measuring firm performance using financial ratios: A decision tree
approach." Expert Systems with Applications 40, no. 10 (2013): 3970-3983.
4 Lartey, Victor Curtis, Samuel Antwi, and Eric Kofi Boadi. "The relationship between liquidity and profitability of
listed banks in Ghana." International Journal of Business and Social Science4, no. 3 (2013).
FINANICIAL MANAGEMENT
Profitability Ratios
The above image shows the profitability ratios which is computed for JD Sport Fashion
Plc and J Barbour & Son Ltd and close competitors for the same. The above image makes it clear
that the closest competitor for JD Sport Fashion Plc is WH Smith Plc in the industry. The gross
profit margin for JD Sport Fashion Plc is shown to be 48.9% which is lower than J Barbour &
Son Ltd and WH Smith Plc which shows that latter companies have better operational structure
and thereby earns more profits3.
The EBITDA margin which is computed also reveals that the business of J Barbour &
Son Ltd has better performance in comparison to JD Sports Fashion Plc. This might signify that
the former business has a better control and operational environment which leads to reductions in
overall operational costs of the business or the business might have a better sales figure for the
period4. This is also seen in case of results of operational profit margin. The net profit margin
which is computed for the J Barbour & Son Ltd is better which is shown to be 13.1% which is
much more than that of JD Sports Fashion Plc which is shown to be 7.5%. Even the net profit
margin for WH Smith Plc is better than JD Sports Fashion Plc and the estimate for the same is
shown to be 9.4%.
3 Delen, Dursun, Cemil Kuzey, and Ali Uyar. "Measuring firm performance using financial ratios: A decision tree
approach." Expert Systems with Applications 40, no. 10 (2013): 3970-3983.
4 Lartey, Victor Curtis, Samuel Antwi, and Eric Kofi Boadi. "The relationship between liquidity and profitability of
listed banks in Ghana." International Journal of Business and Social Science4, no. 3 (2013).
5
FINANICIAL MANAGEMENT
2013 2014 2015 2016 2017
0.0%
10.0%
20.0%
30.0%
40.0%
50.0%
60.0%
Profitability JD Sports Fashion Plc
Gross profit margin, % EBITDA margin, %
Operation profit margin, % Net profit margin, %
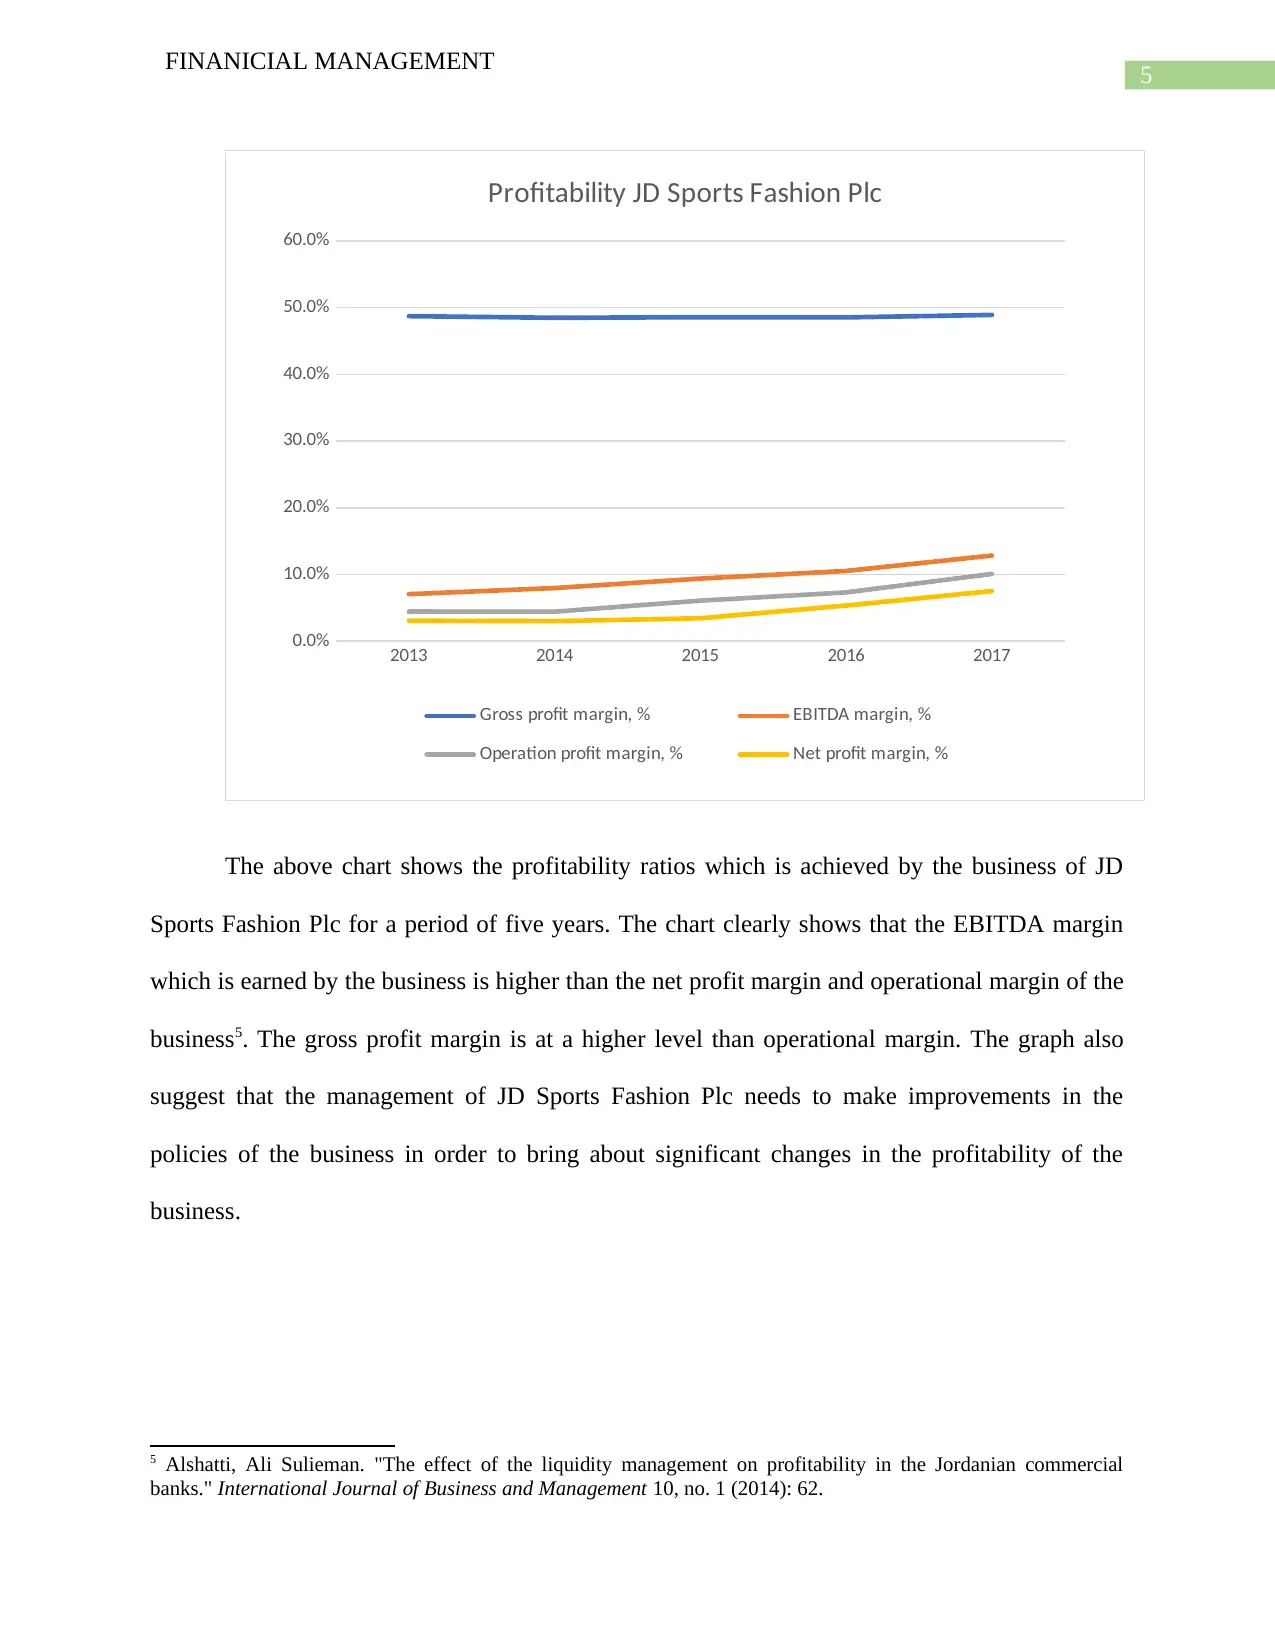
The above chart shows the profitability ratios which is achieved by the business of JD
Sports Fashion Plc for a period of five years. The chart clearly shows that the EBITDA margin
which is earned by the business is higher than the net profit margin and operational margin of the
business5. The gross profit margin is at a higher level than operational margin. The graph also
suggest that the management of JD Sports Fashion Plc needs to make improvements in the
policies of the business in order to bring about significant changes in the profitability of the
business.
5 Alshatti, Ali Sulieman. "The effect of the liquidity management on profitability in the Jordanian commercial
banks." International Journal of Business and Management 10, no. 1 (2014): 62.
FINANICIAL MANAGEMENT
2013 2014 2015 2016 2017
0.0%
10.0%
20.0%
30.0%
40.0%
50.0%
60.0%
Profitability JD Sports Fashion Plc
Gross profit margin, % EBITDA margin, %
Operation profit margin, % Net profit margin, %
The above chart shows the profitability ratios which is achieved by the business of JD
Sports Fashion Plc for a period of five years. The chart clearly shows that the EBITDA margin
which is earned by the business is higher than the net profit margin and operational margin of the
business5. The gross profit margin is at a higher level than operational margin. The graph also
suggest that the management of JD Sports Fashion Plc needs to make improvements in the
policies of the business in order to bring about significant changes in the profitability of the
business.
5 Alshatti, Ali Sulieman. "The effect of the liquidity management on profitability in the Jordanian commercial
banks." International Journal of Business and Management 10, no. 1 (2014): 62.
⊘ This is a preview!⊘
Do you want full access?
Subscribe today to unlock all pages.
Trusted by 1+ million students worldwide
6
FINANICIAL MANAGEMENT
2013 2014 2016 (16 months) 2017
0.0%
10.0%
20.0%
30.0%
40.0%
50.0%
60.0%
Profitability J.Barbour & Sons,Limited
Gross profit margin, % EBITDA margin, %
Operation profit margin, % Net profit margin, %
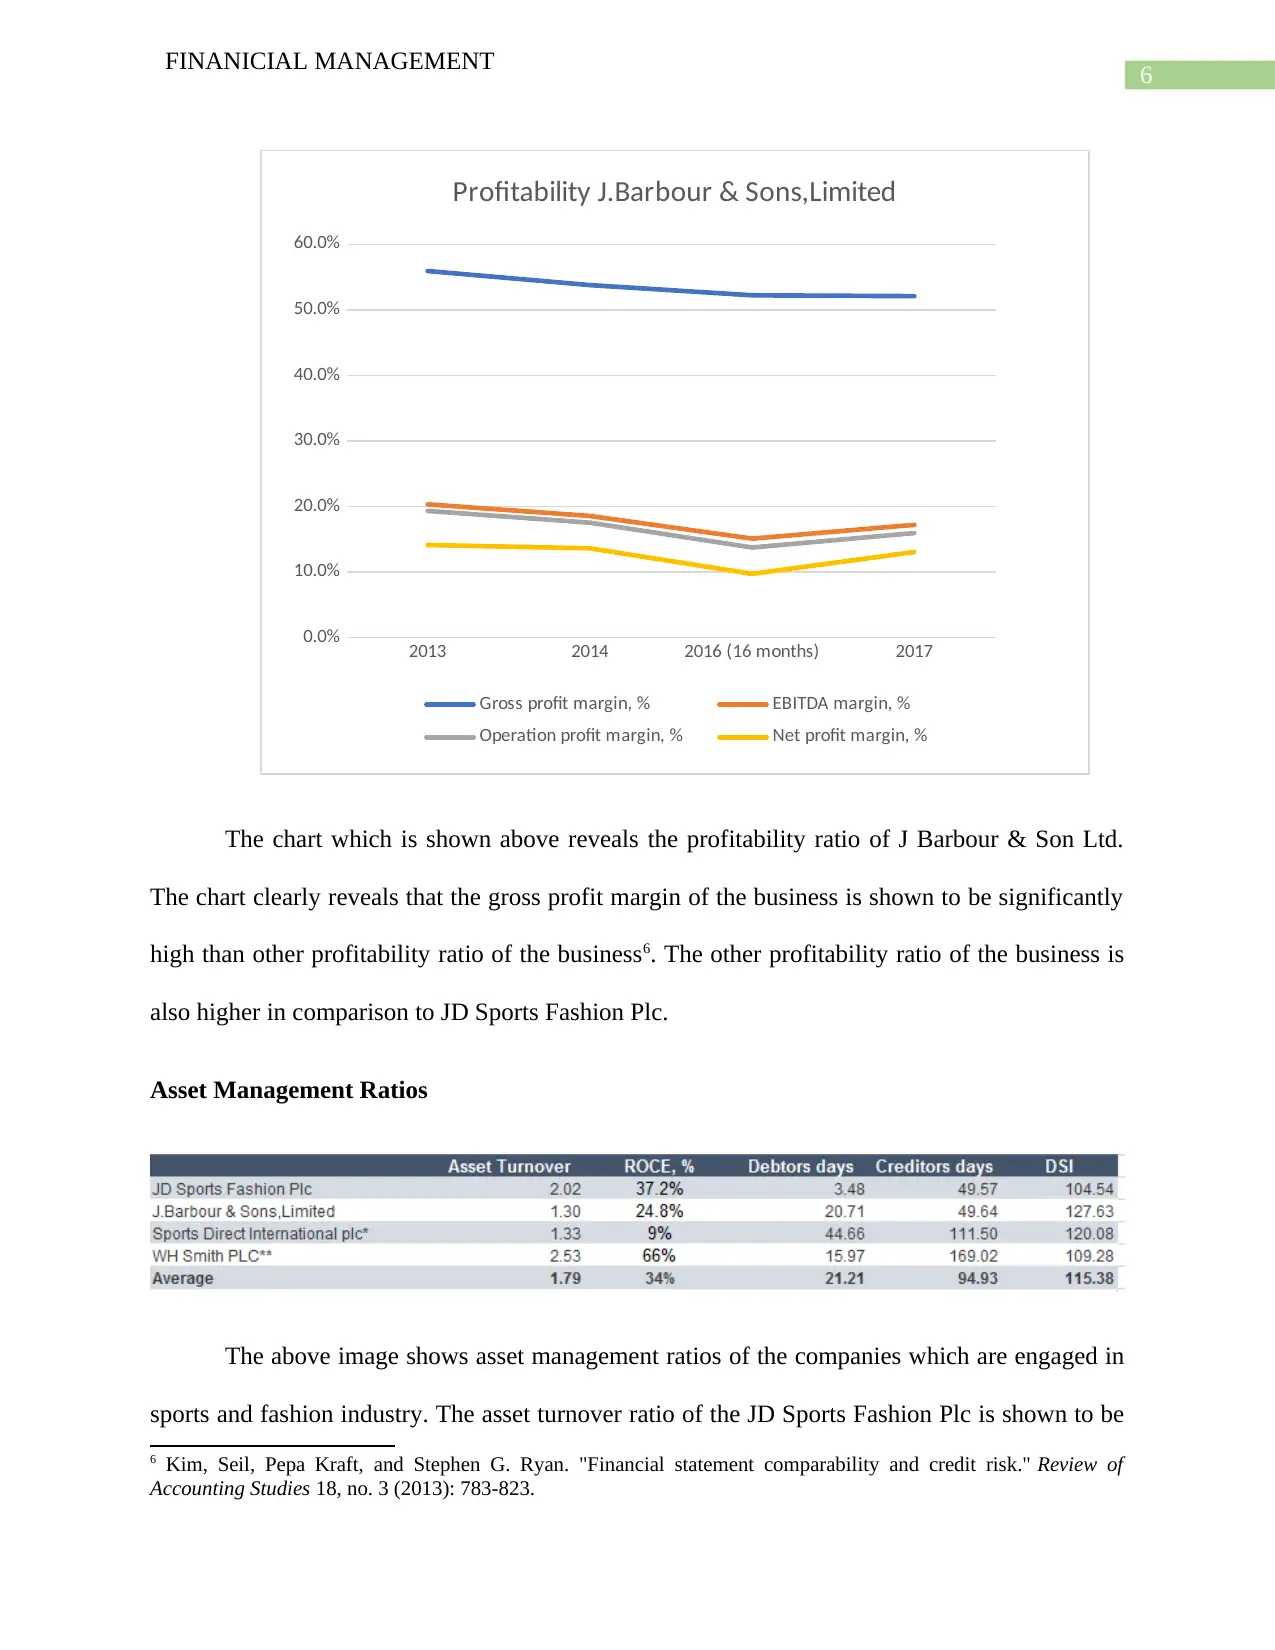
The chart which is shown above reveals the profitability ratio of J Barbour & Son Ltd.
The chart clearly reveals that the gross profit margin of the business is shown to be significantly
high than other profitability ratio of the business6. The other profitability ratio of the business is
also higher in comparison to JD Sports Fashion Plc.
Asset Management Ratios
The above image shows asset management ratios of the companies which are engaged in
sports and fashion industry. The asset turnover ratio of the JD Sports Fashion Plc is shown to be
6 Kim, Seil, Pepa Kraft, and Stephen G. Ryan. "Financial statement comparability and credit risk." Review of
Accounting Studies 18, no. 3 (2013): 783-823.
FINANICIAL MANAGEMENT
2013 2014 2016 (16 months) 2017
0.0%
10.0%
20.0%
30.0%
40.0%
50.0%
60.0%
Profitability J.Barbour & Sons,Limited
Gross profit margin, % EBITDA margin, %
Operation profit margin, % Net profit margin, %
The chart which is shown above reveals the profitability ratio of J Barbour & Son Ltd.
The chart clearly reveals that the gross profit margin of the business is shown to be significantly
high than other profitability ratio of the business6. The other profitability ratio of the business is
also higher in comparison to JD Sports Fashion Plc.
Asset Management Ratios
The above image shows asset management ratios of the companies which are engaged in
sports and fashion industry. The asset turnover ratio of the JD Sports Fashion Plc is shown to be
6 Kim, Seil, Pepa Kraft, and Stephen G. Ryan. "Financial statement comparability and credit risk." Review of
Accounting Studies 18, no. 3 (2013): 783-823.
Paraphrase This Document
Need a fresh take? Get an instant paraphrase of this document with our AI Paraphraser
7
FINANICIAL MANAGEMENT
2.02 which is more than the industry average and it is only second to the close competitor WH
Smith Plc. The asset turnover ratio is shown to be favorable for the business of JD Sports
Fashion Plc. The return on capital employed of the business is also significant and more than the
industry average and the same is shown to be 37.2% and the same is shown to be 24.8% for J
Barbour & Sons Ltd. ROCE is one of the financial indicators for overall success of a business
and therefore, it signifies that the JD Sports Fashion Plc is meet the needs of the investors and is
in its growth phase7. The debtor days of JD Sports Fashion Plc is the best in comparison to its
competitors which is a favorable sign for the business and suggest that the business has a
superior debt collection policy8. The debtors period and creditor period suggest the overall
efficiency of a business and the efficiency of JD Sports Fashion Plc is appropriate as per current
estimates.
2013 2014 2015 2016 2017
0.0%
5.0%
10.0%
15.0%
20.0%
25.0%
30.0%
35.0%
40.0%
JD Sports Fashion Plc - ROCE, %
7 Brooks, Raymond, and Abhik Kumar Mukherjee. Financial management: core concepts. Pearson, 2013.
8 Malkiel, Burton G. "Asset management fees and the growth of finance." Journal of Economic Perspectives 27, no.
2 (2013): 97-108.
8
FINANICIAL MANAGEMENT
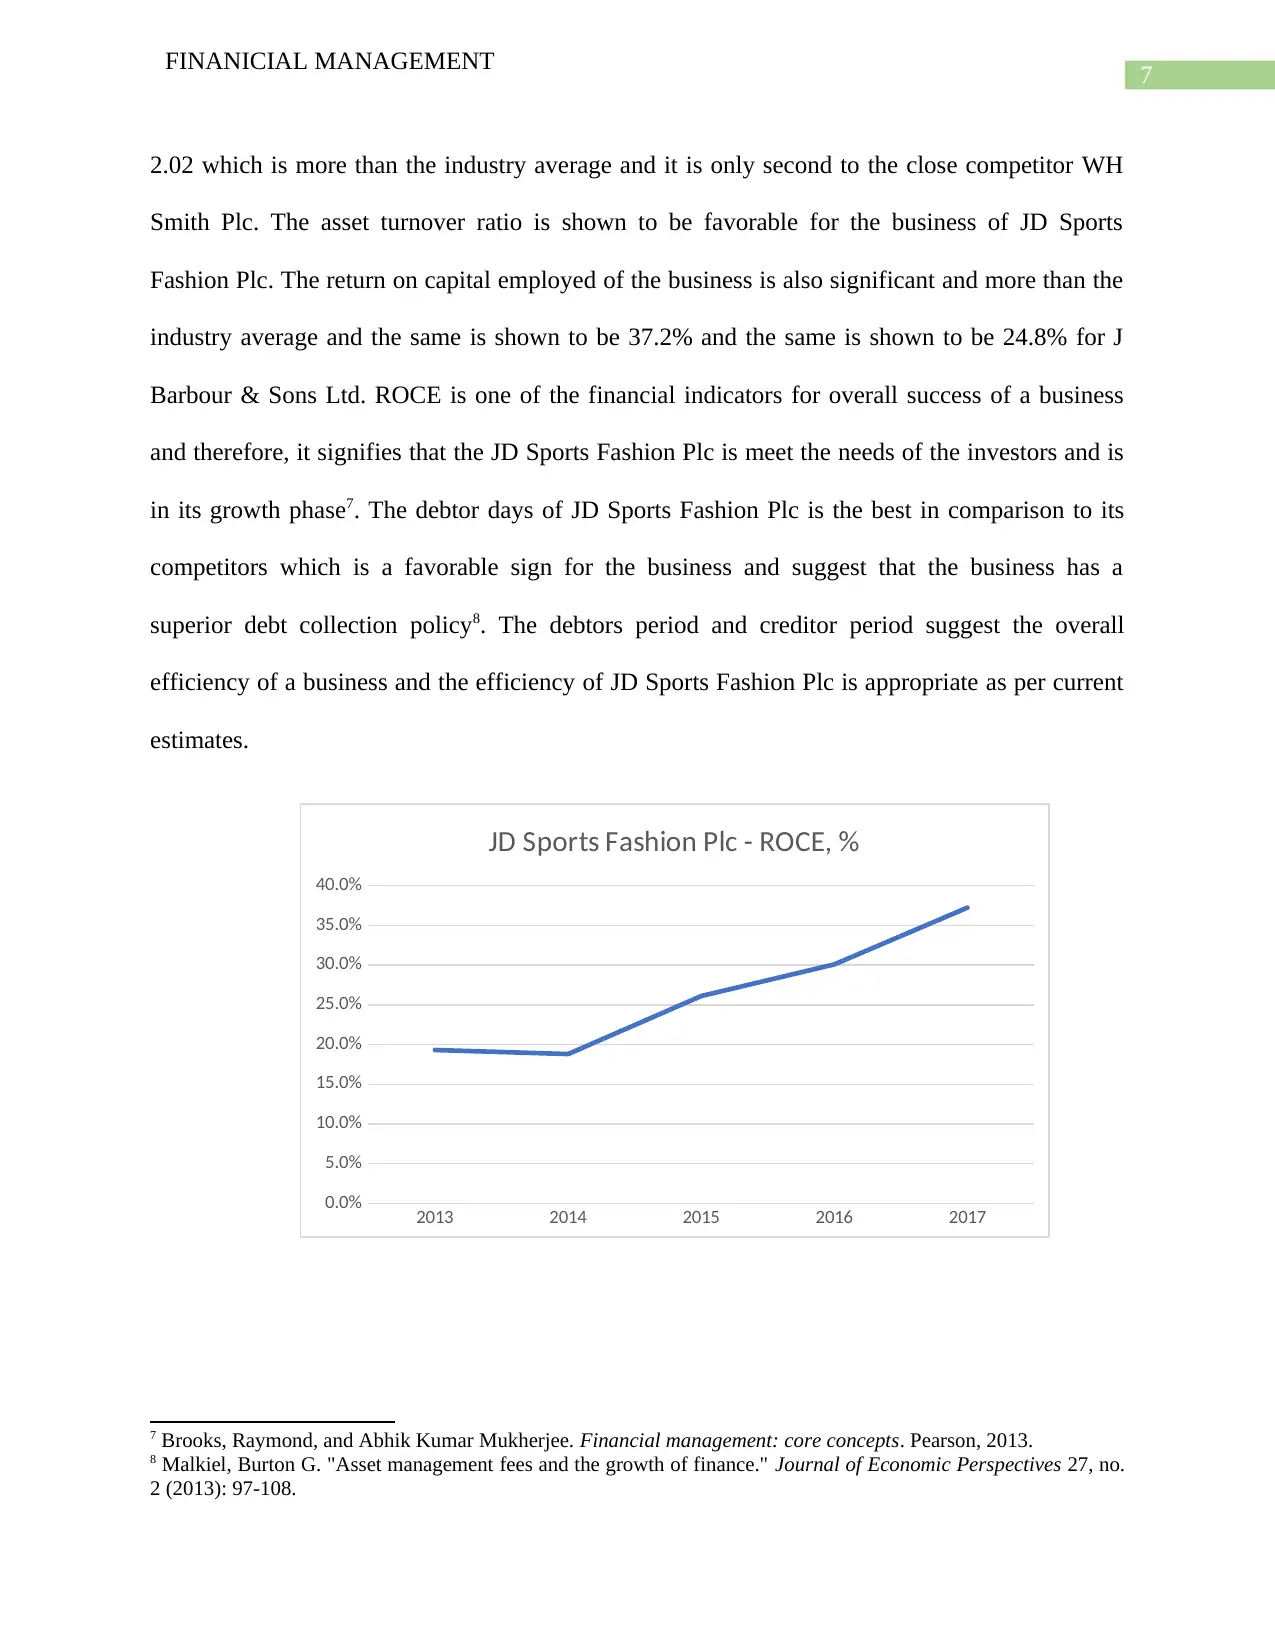
The ROCE of JD Sports Fashion Plc is shown above and the chart reveals a rising trend
in the ROCE % of the business. The ROCE estimate of the business is even better than most of
the companies which are present in the industry.
2013 2014 2016 (16 months) 2017
0.0%
5.0%
10.0%
15.0%
20.0%
25.0%
30.0%
35.0%
40.0%
45.0%
J.Barbour & Sons,Limited - ROCE, %
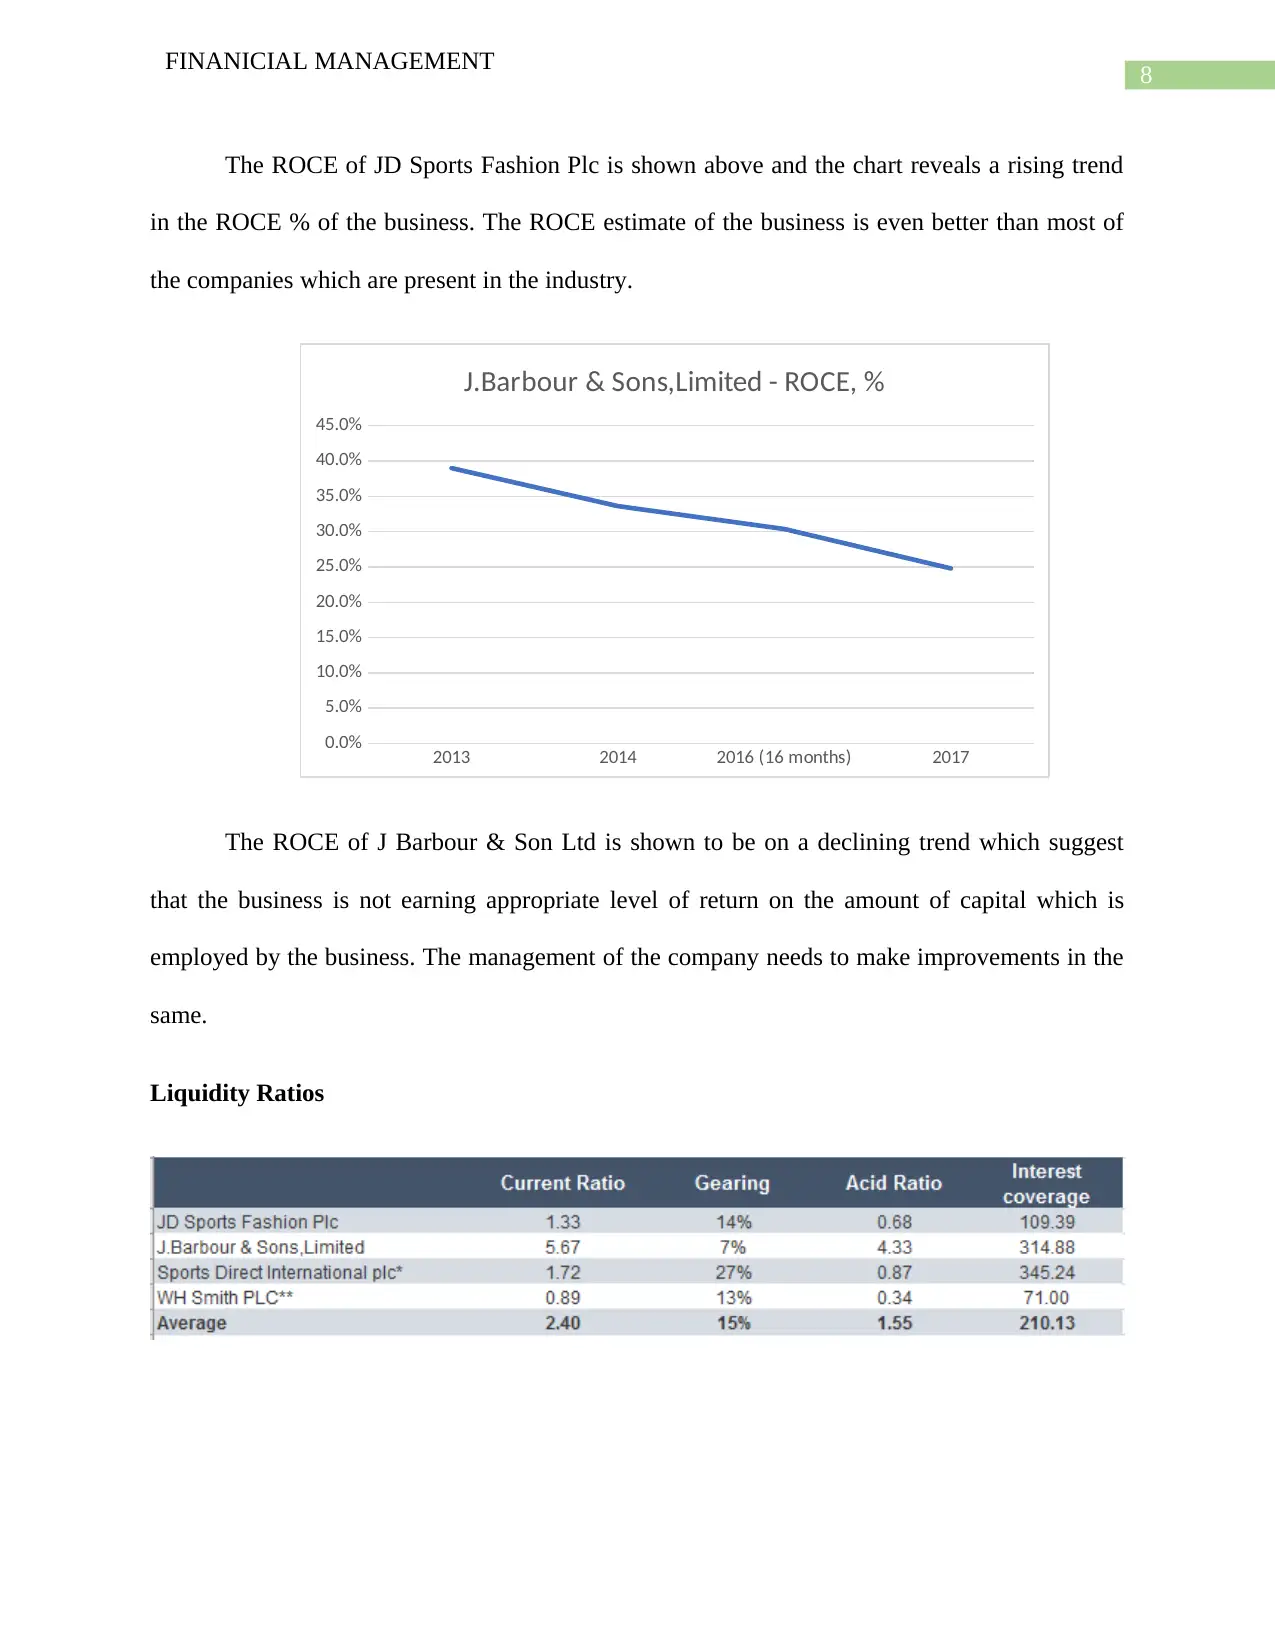
The ROCE of J Barbour & Son Ltd is shown to be on a declining trend which suggest
that the business is not earning appropriate level of return on the amount of capital which is
employed by the business. The management of the company needs to make improvements in the
same.
Liquidity Ratios
FINANICIAL MANAGEMENT
The ROCE of JD Sports Fashion Plc is shown above and the chart reveals a rising trend
in the ROCE % of the business. The ROCE estimate of the business is even better than most of
the companies which are present in the industry.
2013 2014 2016 (16 months) 2017
0.0%
5.0%
10.0%
15.0%
20.0%
25.0%
30.0%
35.0%
40.0%
45.0%
J.Barbour & Sons,Limited - ROCE, %
The ROCE of J Barbour & Son Ltd is shown to be on a declining trend which suggest
that the business is not earning appropriate level of return on the amount of capital which is
employed by the business. The management of the company needs to make improvements in the
same.
Liquidity Ratios
⊘ This is a preview!⊘
Do you want full access?
Subscribe today to unlock all pages.
Trusted by 1+ million students worldwide
9
FINANICIAL MANAGEMENT
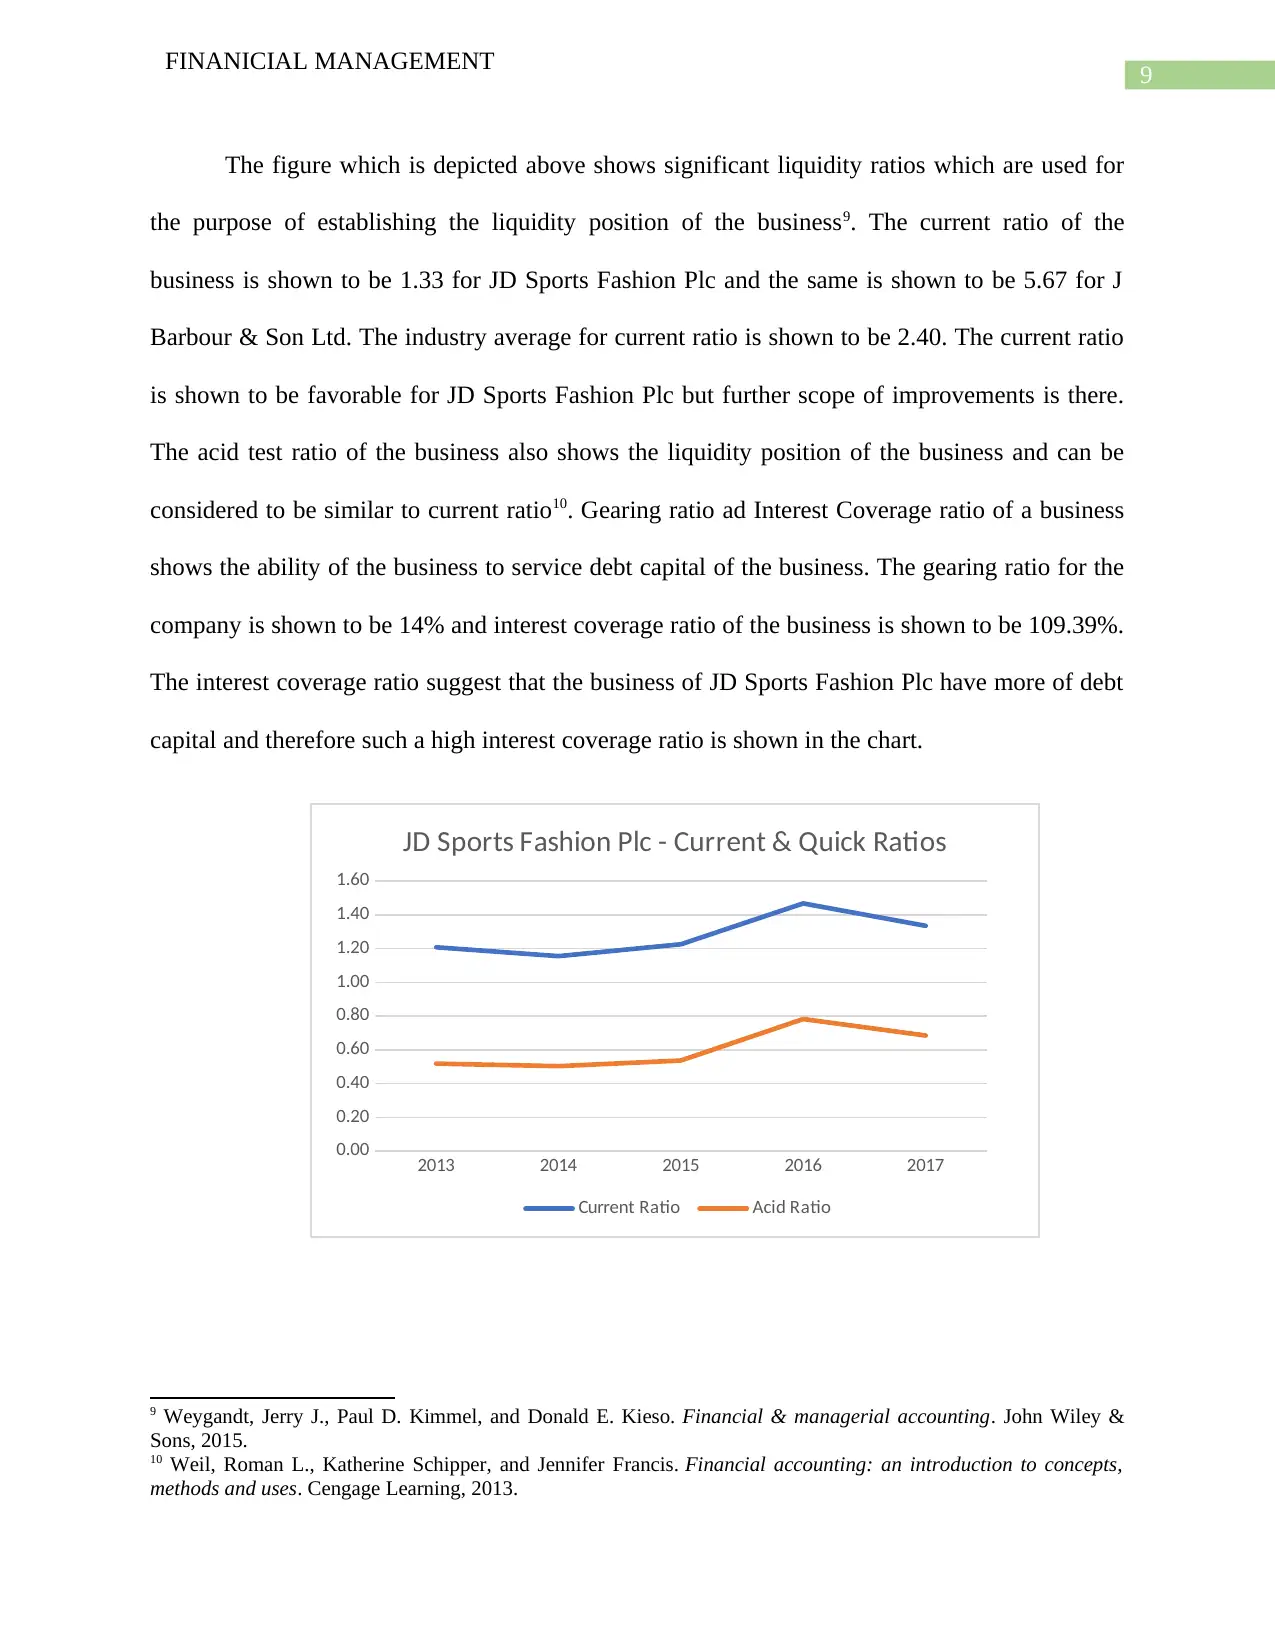
The figure which is depicted above shows significant liquidity ratios which are used for
the purpose of establishing the liquidity position of the business9. The current ratio of the
business is shown to be 1.33 for JD Sports Fashion Plc and the same is shown to be 5.67 for J
Barbour & Son Ltd. The industry average for current ratio is shown to be 2.40. The current ratio
is shown to be favorable for JD Sports Fashion Plc but further scope of improvements is there.
The acid test ratio of the business also shows the liquidity position of the business and can be
considered to be similar to current ratio10. Gearing ratio ad Interest Coverage ratio of a business
shows the ability of the business to service debt capital of the business. The gearing ratio for the
company is shown to be 14% and interest coverage ratio of the business is shown to be 109.39%.
The interest coverage ratio suggest that the business of JD Sports Fashion Plc have more of debt
capital and therefore such a high interest coverage ratio is shown in the chart.
2013 2014 2015 2016 2017
0.00
0.20
0.40
0.60
0.80
1.00
1.20
1.40
1.60
JD Sports Fashion Plc - Current & Quick Ratios
Current Ratio Acid Ratio
9 Weygandt, Jerry J., Paul D. Kimmel, and Donald E. Kieso. Financial & managerial accounting. John Wiley &
Sons, 2015.
10 Weil, Roman L., Katherine Schipper, and Jennifer Francis. Financial accounting: an introduction to concepts,
methods and uses. Cengage Learning, 2013.
FINANICIAL MANAGEMENT
The figure which is depicted above shows significant liquidity ratios which are used for
the purpose of establishing the liquidity position of the business9. The current ratio of the
business is shown to be 1.33 for JD Sports Fashion Plc and the same is shown to be 5.67 for J
Barbour & Son Ltd. The industry average for current ratio is shown to be 2.40. The current ratio
is shown to be favorable for JD Sports Fashion Plc but further scope of improvements is there.
The acid test ratio of the business also shows the liquidity position of the business and can be
considered to be similar to current ratio10. Gearing ratio ad Interest Coverage ratio of a business
shows the ability of the business to service debt capital of the business. The gearing ratio for the
company is shown to be 14% and interest coverage ratio of the business is shown to be 109.39%.
The interest coverage ratio suggest that the business of JD Sports Fashion Plc have more of debt
capital and therefore such a high interest coverage ratio is shown in the chart.
2013 2014 2015 2016 2017
0.00
0.20
0.40
0.60
0.80
1.00
1.20
1.40
1.60
JD Sports Fashion Plc - Current & Quick Ratios
Current Ratio Acid Ratio
9 Weygandt, Jerry J., Paul D. Kimmel, and Donald E. Kieso. Financial & managerial accounting. John Wiley &
Sons, 2015.
10 Weil, Roman L., Katherine Schipper, and Jennifer Francis. Financial accounting: an introduction to concepts,
methods and uses. Cengage Learning, 2013.
Paraphrase This Document
Need a fresh take? Get an instant paraphrase of this document with our AI Paraphraser
10
FINANICIAL MANAGEMENT
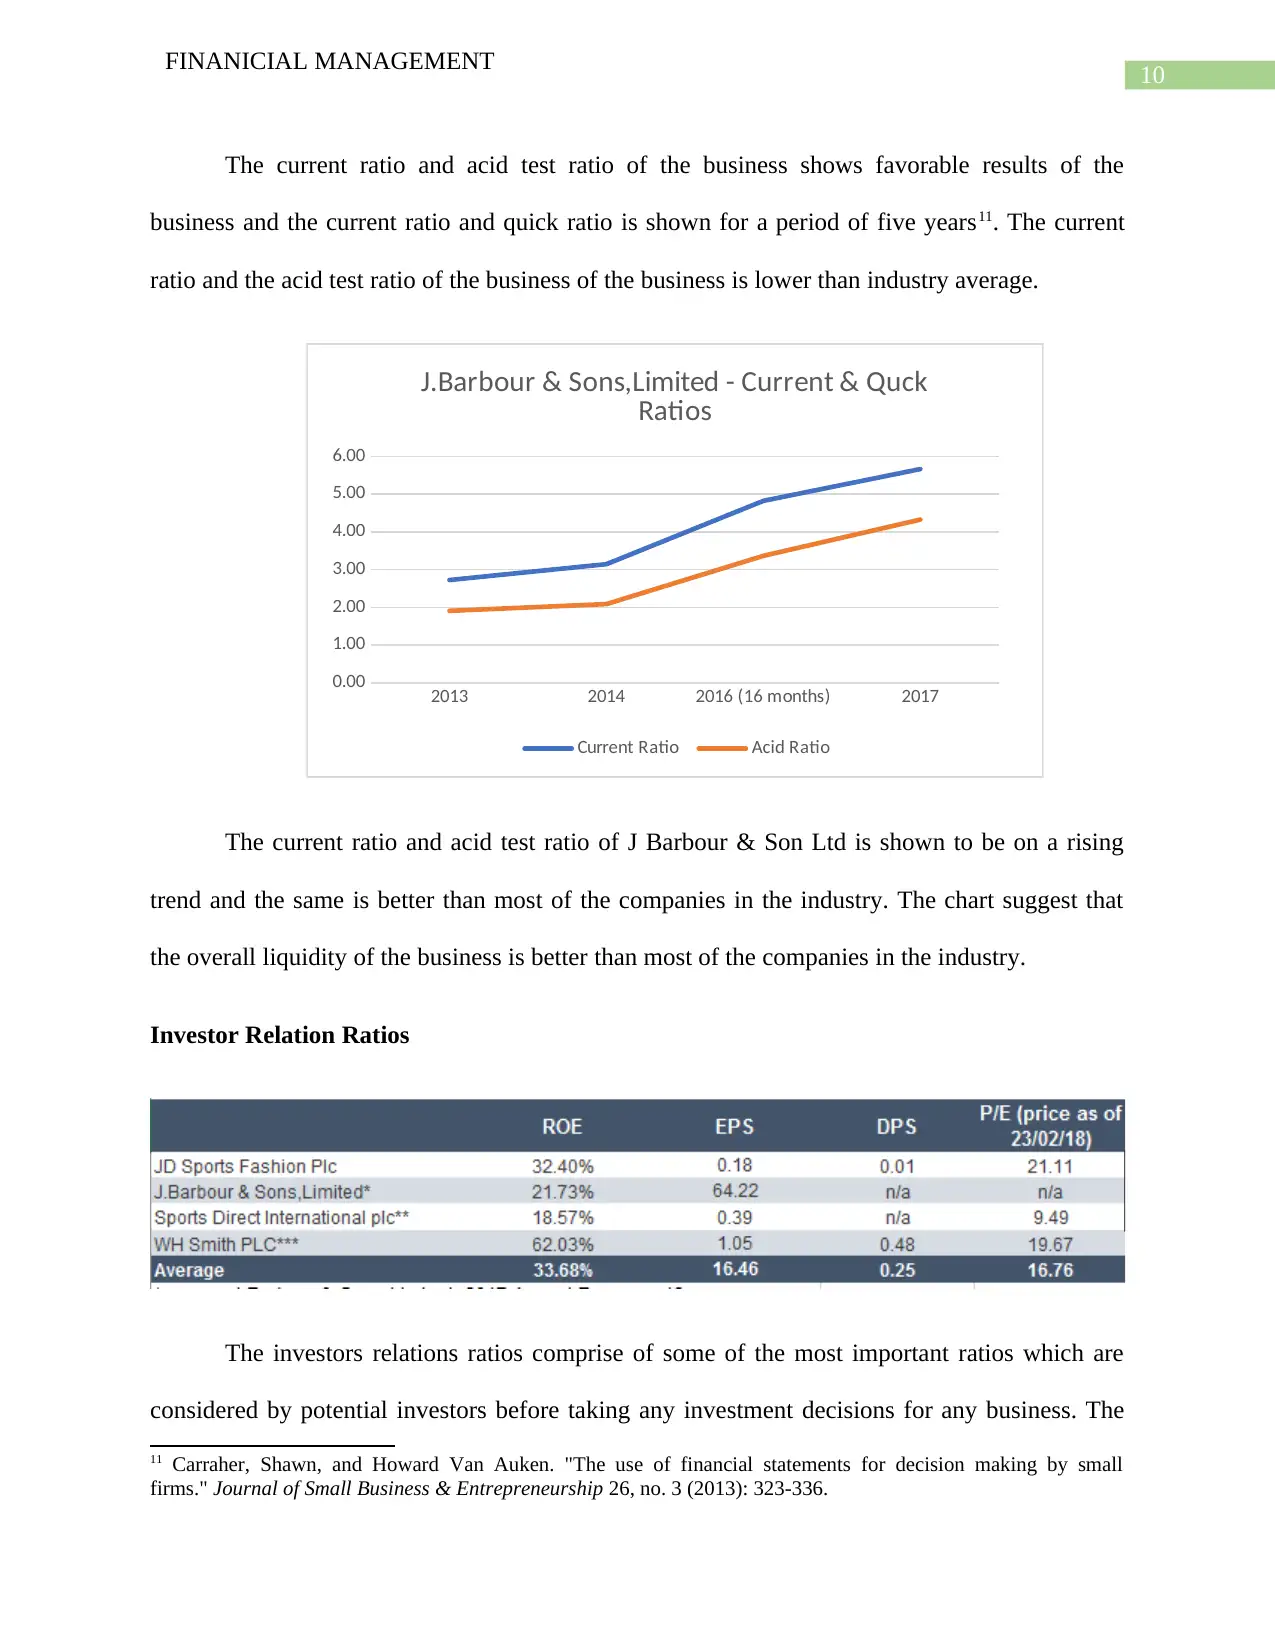
The current ratio and acid test ratio of the business shows favorable results of the
business and the current ratio and quick ratio is shown for a period of five years11. The current
ratio and the acid test ratio of the business of the business is lower than industry average.
2013 2014 2016 (16 months) 2017
0.00
1.00
2.00
3.00
4.00
5.00
6.00
J.Barbour & Sons,Limited - Current & Quck
Ratios
Current Ratio Acid Ratio
The current ratio and acid test ratio of J Barbour & Son Ltd is shown to be on a rising
trend and the same is better than most of the companies in the industry. The chart suggest that
the overall liquidity of the business is better than most of the companies in the industry.
Investor Relation Ratios
The investors relations ratios comprise of some of the most important ratios which are
considered by potential investors before taking any investment decisions for any business. The
11 Carraher, Shawn, and Howard Van Auken. "The use of financial statements for decision making by small
firms." Journal of Small Business & Entrepreneurship 26, no. 3 (2013): 323-336.
FINANICIAL MANAGEMENT
The current ratio and acid test ratio of the business shows favorable results of the
business and the current ratio and quick ratio is shown for a period of five years11. The current
ratio and the acid test ratio of the business of the business is lower than industry average.
2013 2014 2016 (16 months) 2017
0.00
1.00
2.00
3.00
4.00
5.00
6.00
J.Barbour & Sons,Limited - Current & Quck
Ratios
Current Ratio Acid Ratio
The current ratio and acid test ratio of J Barbour & Son Ltd is shown to be on a rising
trend and the same is better than most of the companies in the industry. The chart suggest that
the overall liquidity of the business is better than most of the companies in the industry.
Investor Relation Ratios
The investors relations ratios comprise of some of the most important ratios which are
considered by potential investors before taking any investment decisions for any business. The
11 Carraher, Shawn, and Howard Van Auken. "The use of financial statements for decision making by small
firms." Journal of Small Business & Entrepreneurship 26, no. 3 (2013): 323-336.
11
FINANICIAL MANAGEMENT
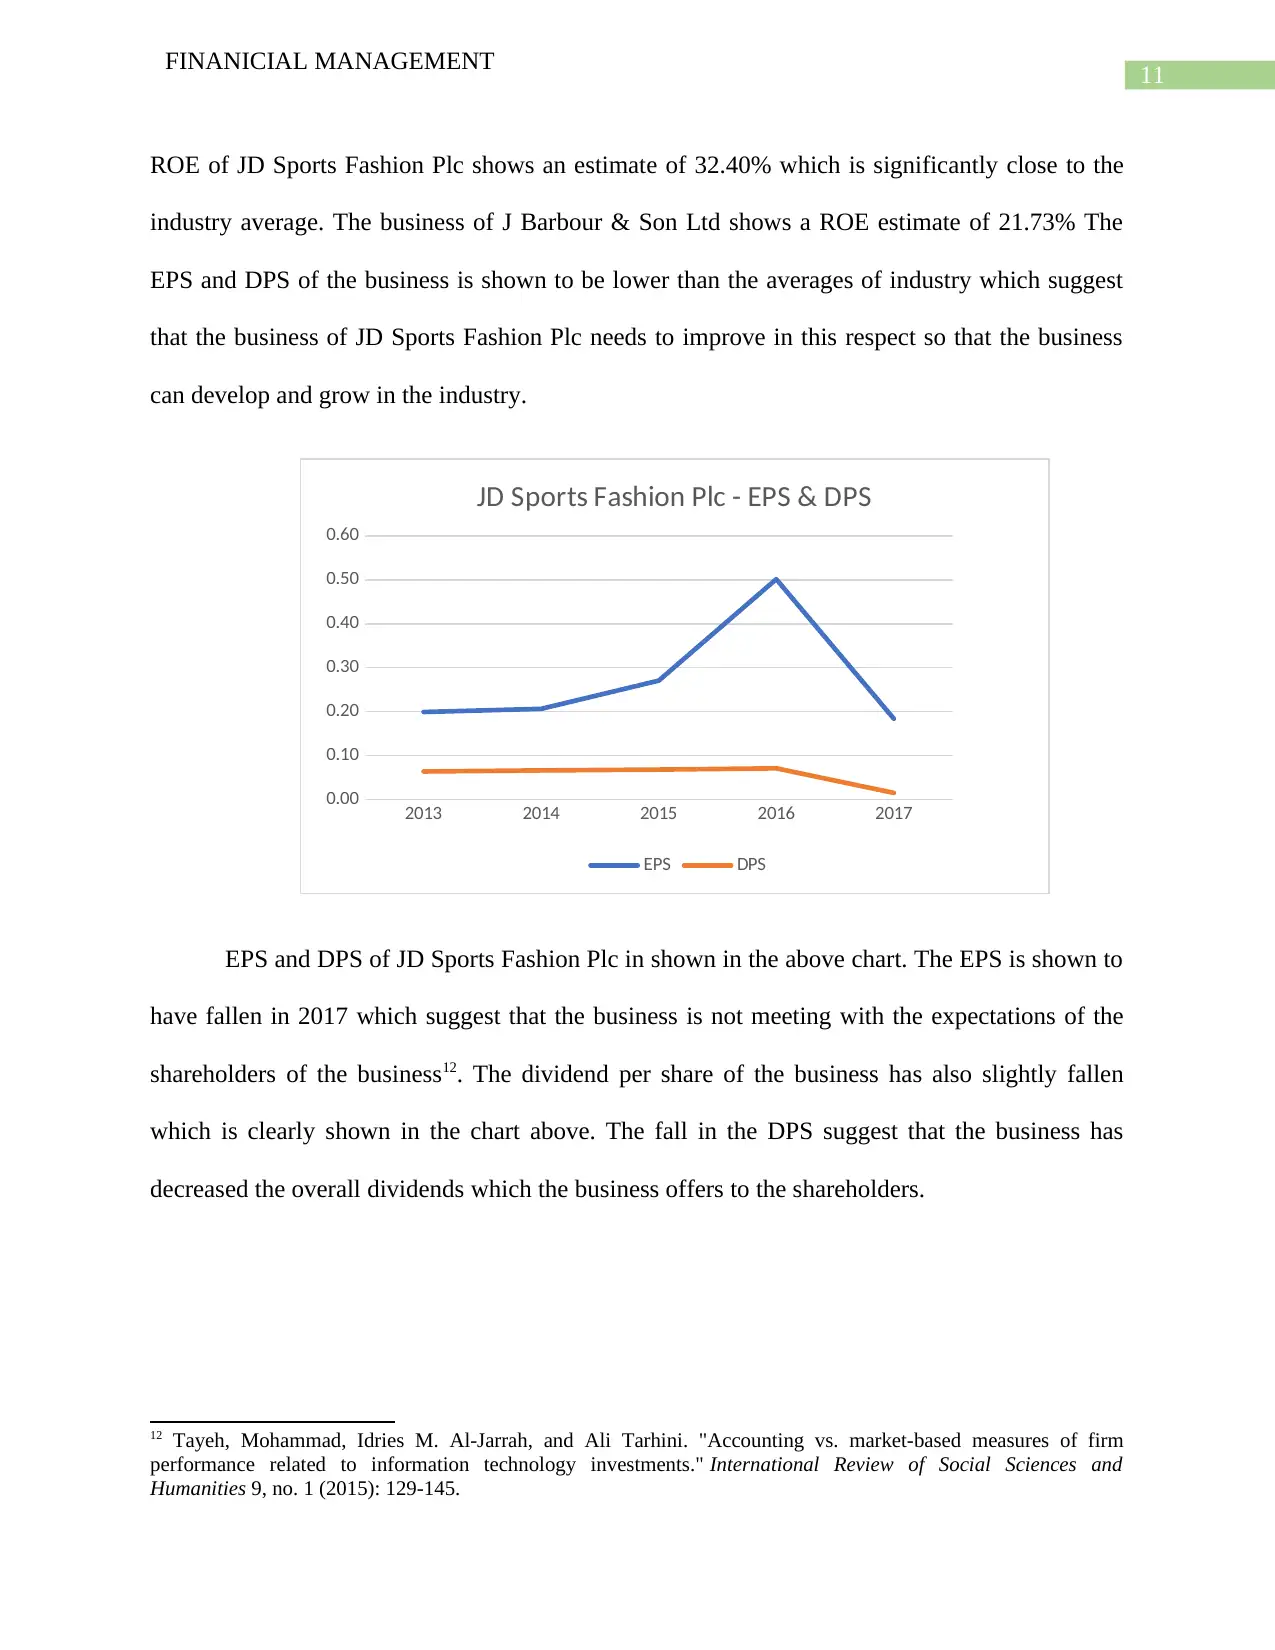
ROE of JD Sports Fashion Plc shows an estimate of 32.40% which is significantly close to the
industry average. The business of J Barbour & Son Ltd shows a ROE estimate of 21.73% The
EPS and DPS of the business is shown to be lower than the averages of industry which suggest
that the business of JD Sports Fashion Plc needs to improve in this respect so that the business
can develop and grow in the industry.
2013 2014 2015 2016 2017
0.00
0.10
0.20
0.30
0.40
0.50
0.60
JD Sports Fashion Plc - EPS & DPS
EPS DPS
EPS and DPS of JD Sports Fashion Plc in shown in the above chart. The EPS is shown to
have fallen in 2017 which suggest that the business is not meeting with the expectations of the
shareholders of the business12. The dividend per share of the business has also slightly fallen
which is clearly shown in the chart above. The fall in the DPS suggest that the business has
decreased the overall dividends which the business offers to the shareholders.
12 Tayeh, Mohammad, Idries M. Al-Jarrah, and Ali Tarhini. "Accounting vs. market-based measures of firm
performance related to information technology investments." International Review of Social Sciences and
Humanities 9, no. 1 (2015): 129-145.
FINANICIAL MANAGEMENT
ROE of JD Sports Fashion Plc shows an estimate of 32.40% which is significantly close to the
industry average. The business of J Barbour & Son Ltd shows a ROE estimate of 21.73% The
EPS and DPS of the business is shown to be lower than the averages of industry which suggest
that the business of JD Sports Fashion Plc needs to improve in this respect so that the business
can develop and grow in the industry.
2013 2014 2015 2016 2017
0.00
0.10
0.20
0.30
0.40
0.50
0.60
JD Sports Fashion Plc - EPS & DPS
EPS DPS
EPS and DPS of JD Sports Fashion Plc in shown in the above chart. The EPS is shown to
have fallen in 2017 which suggest that the business is not meeting with the expectations of the
shareholders of the business12. The dividend per share of the business has also slightly fallen
which is clearly shown in the chart above. The fall in the DPS suggest that the business has
decreased the overall dividends which the business offers to the shareholders.
12 Tayeh, Mohammad, Idries M. Al-Jarrah, and Ali Tarhini. "Accounting vs. market-based measures of firm
performance related to information technology investments." International Review of Social Sciences and
Humanities 9, no. 1 (2015): 129-145.
⊘ This is a preview!⊘
Do you want full access?
Subscribe today to unlock all pages.
Trusted by 1+ million students worldwide
1 out of 28
Related Documents


Your All-in-One AI-Powered Toolkit for Academic Success.
+13062052269
info@desklib.com
Available 24*7 on WhatsApp / Email
![[object Object]](/_next/static/media/star-bottom.7253800d.svg)
Unlock your academic potential
Copyright © 2020–2026 A2Z Services. All Rights Reserved. Developed and managed by ZUCOL.