Financial Analysis Report: JD Sports Fashion Plc. - 2017-2018
VerifiedAdded on 2023/04/21
|14
|3018
|178
Report
AI Summary
This report provides a financial analysis of JD Sports Fashion Plc., evaluating its performance based on the financial statements from 2017 and 2018. The analysis utilizes ratio analysis to assess profitability, efficiency, and financial position. Key areas of focus include gross profit margin, operating profit margin, return on capital employed, current ratio, and gearing ratio. The report highlights the company's stable financial position, with marginal decreases in profitability, while also assessing its operational efficiency. The analysis also examines the company's revenue sources, expense ratios, and tax rates, concluding with an overview of the financial position, which is highly dependent on the key drivers of the company such as liquidity and activity ratios, reflecting sustainable growth. The report also considers factors like receivables and payable days, and debt exposure, and provides a comprehensive overview of the company's financial health, identifying areas for improvement and potential for future growth.
JD SPORTS FASHION PLC.
FINANCIAL ANALYSIS
REPORT
Unit: Financial Reporting
Unit leader: Linda Brooks
Submission Date: 07/1/2019
FINANCIAL ANALYSIS
REPORT
Unit: Financial Reporting
Unit leader: Linda Brooks
Submission Date: 07/1/2019
Paraphrase This Document
Need a fresh take? Get an instant paraphrase of this document with our AI Paraphraser
Executive Summary
The aim of the assignment is to conduct a financial evaluation and performance of the JD
Sports Fashion Plc. Financial analysis of JD Sports was conducted with the help of ratio
analysis in evaluating the financial performance. The financial statement for the year 2017
and 2018 was taken into consideration for evaluating the financial statement of the company.
Overall profitability and efficiency of JD Sports was assessed in order to determine the
performance in the trend period analyzed for the company. JD Sport Financial position has
declined where the profitability for the company saw a marginal decrease from the year 2017-
18. However the financial position of the company was assessed to be at a stable rate where
the company has tried to manage the efficiency in the operations of the company.
1
Table of Contents
INTRODUCTION.....................................................3
DISCUSSION..........................................................4
FINANCIAL PERFORMANCE........................................................................4
FINANCIAL POSITION.................................................................................7
CONCLUSION.........................................................8
REFERENCE.........................................................10
APPENDIX 1........................................................12
2
⊘ This is a preview!⊘
Do you want full access?
Subscribe today to unlock all pages.
Trusted by 1+ million students worldwide
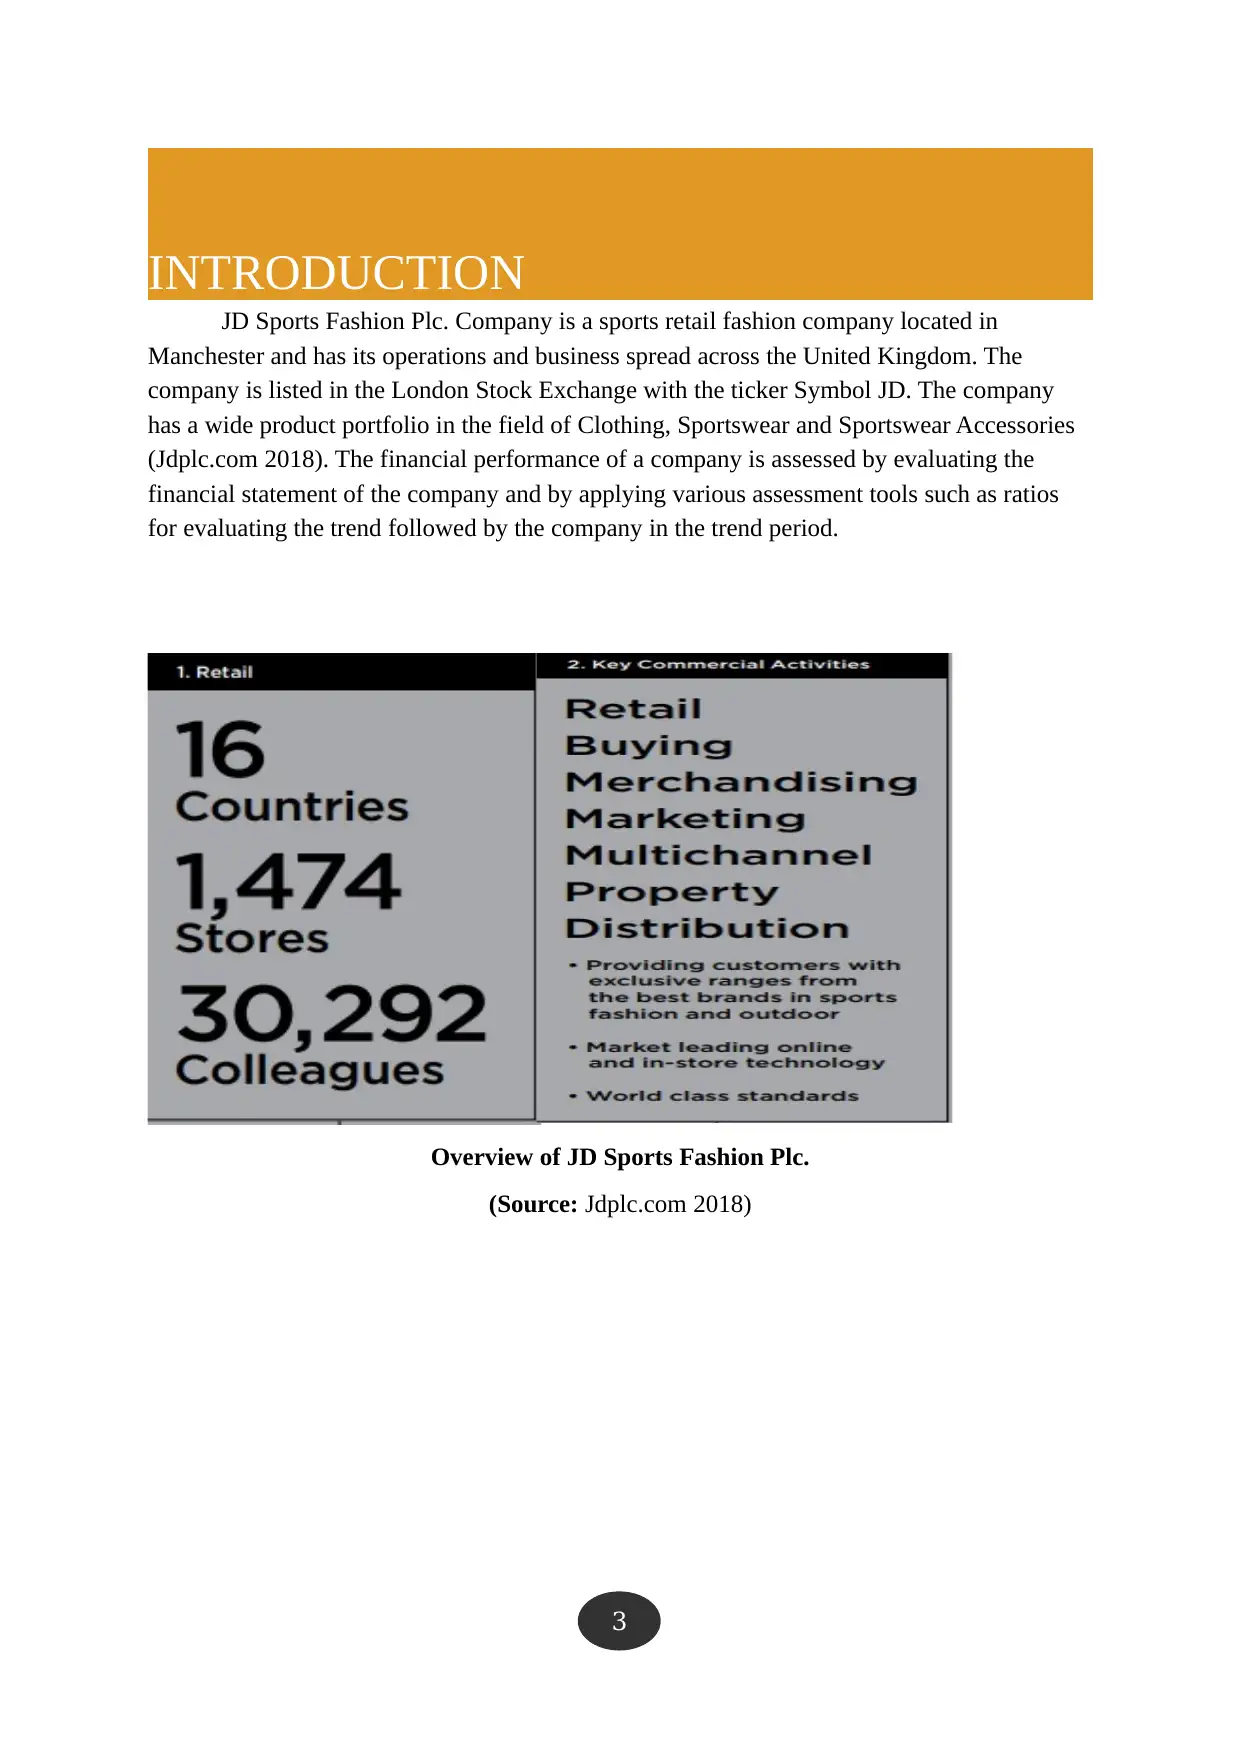
INTRODUCTION
JD Sports Fashion Plc. Company is a sports retail fashion company located in
Manchester and has its operations and business spread across the United Kingdom. The
company is listed in the London Stock Exchange with the ticker Symbol JD. The company
has a wide product portfolio in the field of Clothing, Sportswear and Sportswear Accessories
(Jdplc.com 2018). The financial performance of a company is assessed by evaluating the
financial statement of the company and by applying various assessment tools such as ratios
for evaluating the trend followed by the company in the trend period.
Overview of JD Sports Fashion Plc.
(Source: Jdplc.com 2018)
3
Paraphrase This Document
Need a fresh take? Get an instant paraphrase of this document with our AI Paraphraser
DISCUSSION
FINANCIAL PERFORMANCE
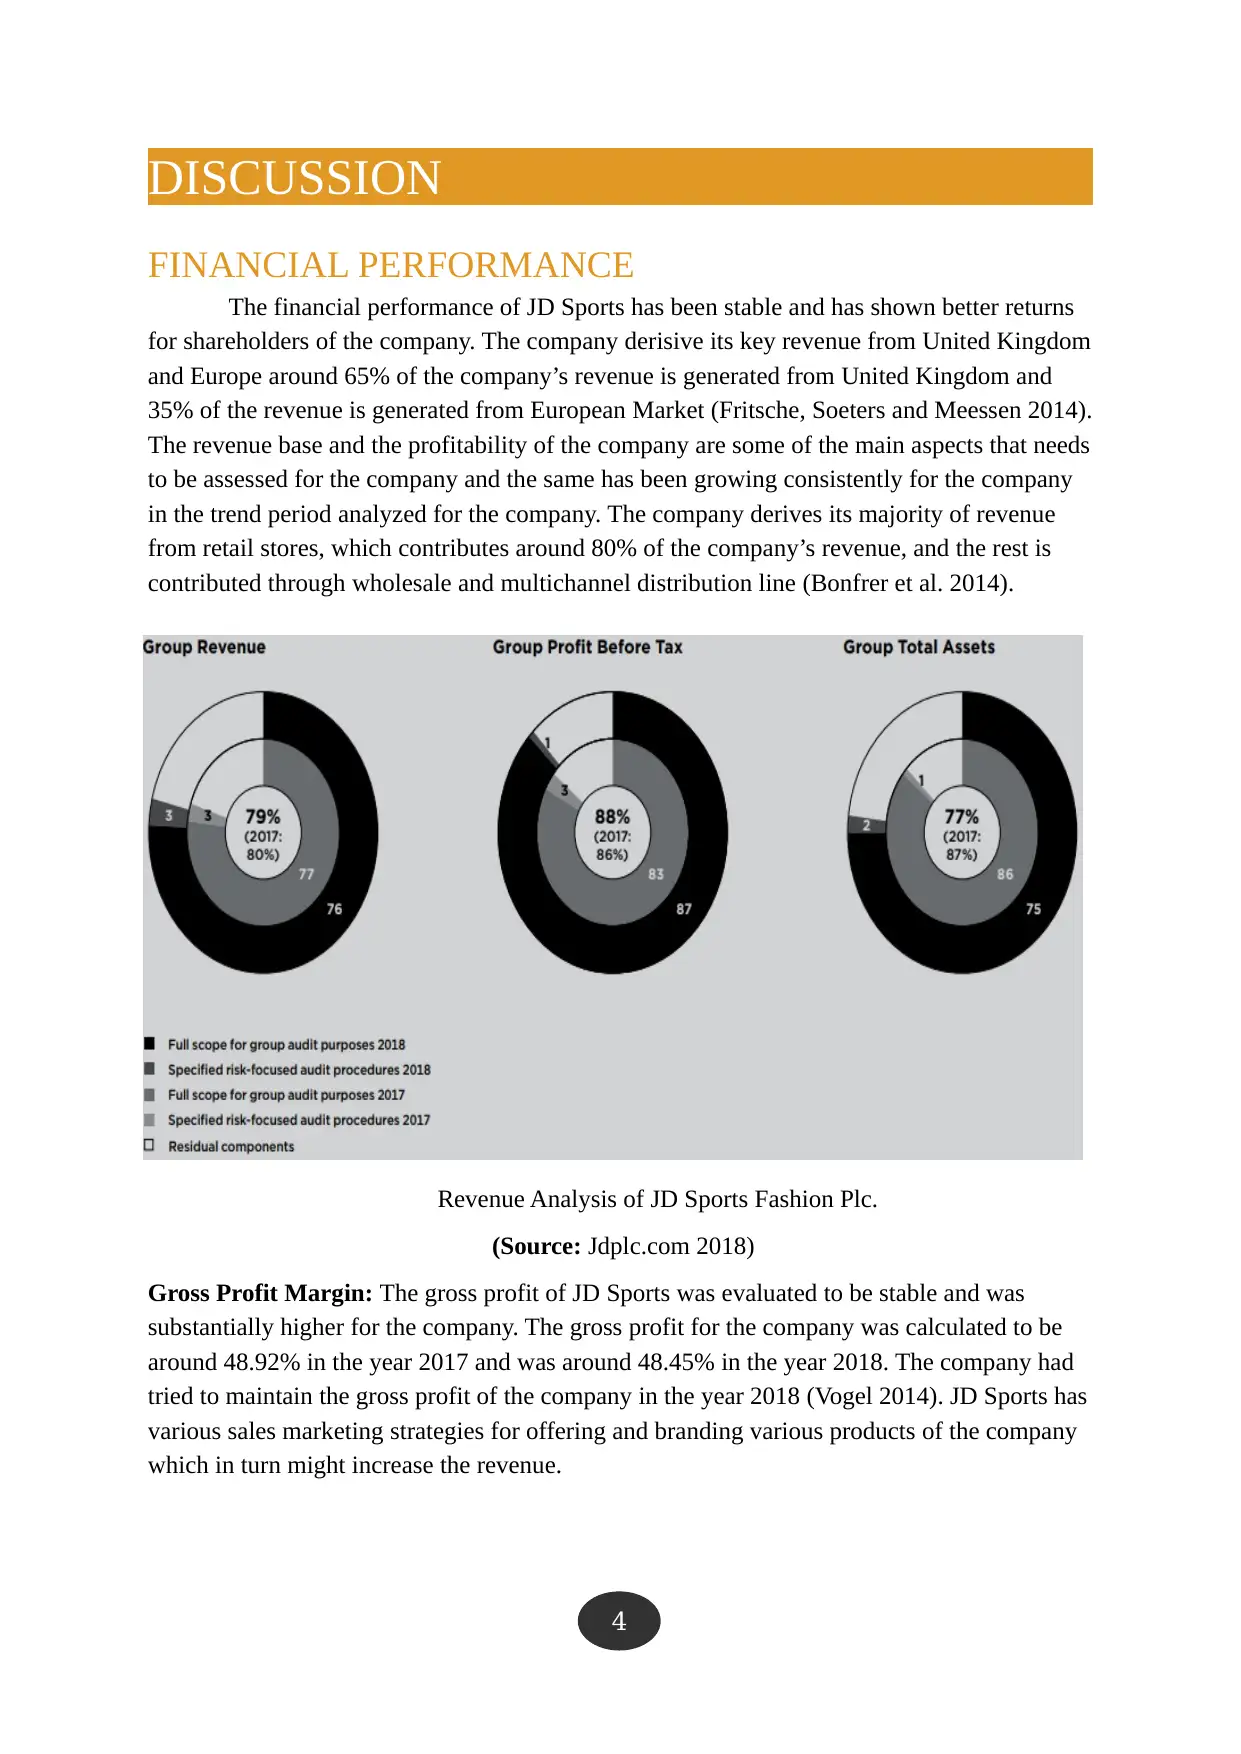
The financial performance of JD Sports has been stable and has shown better returns
for shareholders of the company. The company derisive its key revenue from United Kingdom
and Europe around 65% of the company’s revenue is generated from United Kingdom and
35% of the revenue is generated from European Market (Fritsche, Soeters and Meessen 2014).
The revenue base and the profitability of the company are some of the main aspects that needs
to be assessed for the company and the same has been growing consistently for the company
in the trend period analyzed for the company. The company derives its majority of revenue
from retail stores, which contributes around 80% of the company’s revenue, and the rest is
contributed through wholesale and multichannel distribution line (Bonfrer et al. 2014).
Revenue Analysis of JD Sports Fashion Plc.
(Source: Jdplc.com 2018)
Gross Profit Margin: The gross profit of JD Sports was evaluated to be stable and was
substantially higher for the company. The gross profit for the company was calculated to be
around 48.92% in the year 2017 and was around 48.45% in the year 2018. The company had
tried to maintain the gross profit of the company in the year 2018 (Vogel 2014). JD Sports has
various sales marketing strategies for offering and branding various products of the company
which in turn might increase the revenue.
4
FINANCIAL PERFORMANCE
The financial performance of JD Sports has been stable and has shown better returns
for shareholders of the company. The company derisive its key revenue from United Kingdom
and Europe around 65% of the company’s revenue is generated from United Kingdom and
35% of the revenue is generated from European Market (Fritsche, Soeters and Meessen 2014).
The revenue base and the profitability of the company are some of the main aspects that needs
to be assessed for the company and the same has been growing consistently for the company
in the trend period analyzed for the company. The company derives its majority of revenue
from retail stores, which contributes around 80% of the company’s revenue, and the rest is
contributed through wholesale and multichannel distribution line (Bonfrer et al. 2014).
Revenue Analysis of JD Sports Fashion Plc.
(Source: Jdplc.com 2018)
Gross Profit Margin: The gross profit of JD Sports was evaluated to be stable and was
substantially higher for the company. The gross profit for the company was calculated to be
around 48.92% in the year 2017 and was around 48.45% in the year 2018. The company had
tried to maintain the gross profit of the company in the year 2018 (Vogel 2014). JD Sports has
various sales marketing strategies for offering and branding various products of the company
which in turn might increase the revenue.
4
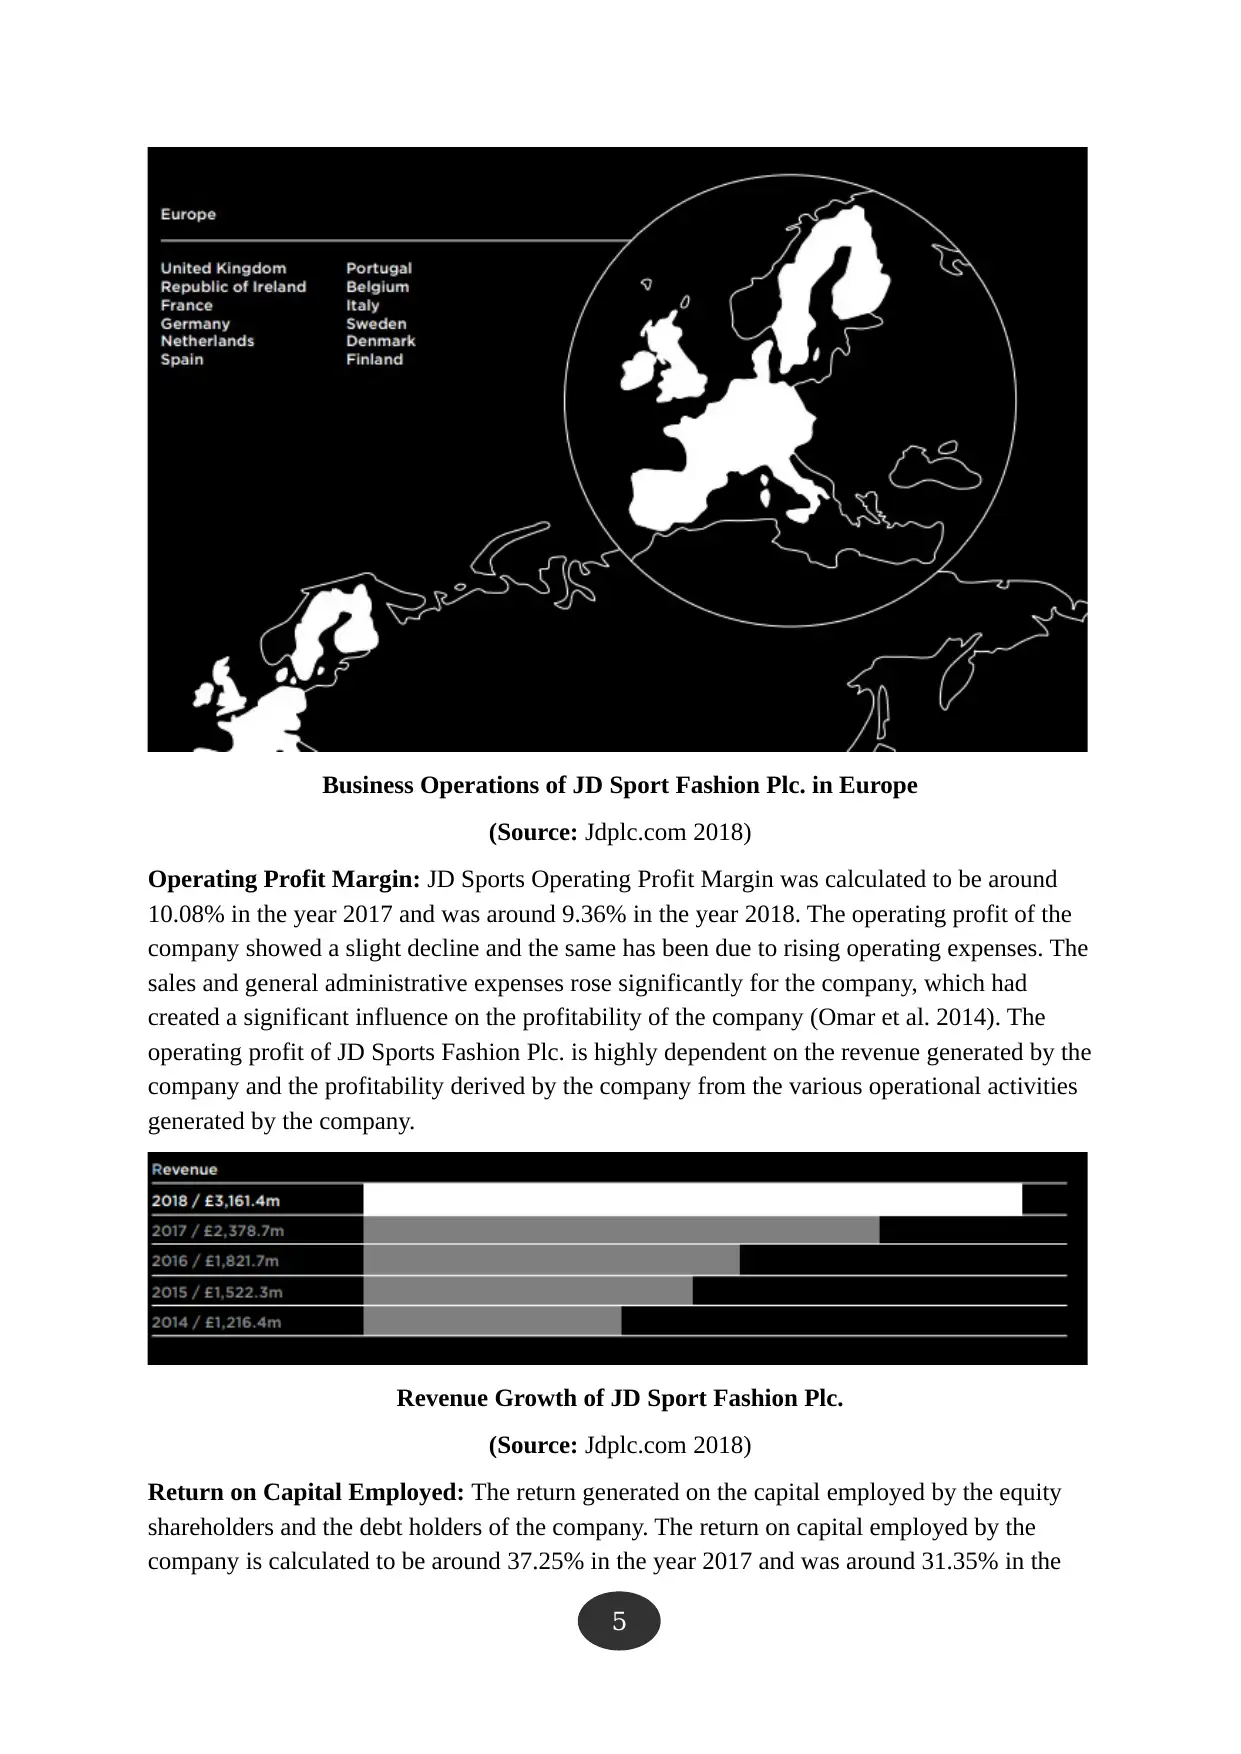
Business Operations of JD Sport Fashion Plc. in Europe
(Source: Jdplc.com 2018)
Operating Profit Margin: JD Sports Operating Profit Margin was calculated to be around
10.08% in the year 2017 and was around 9.36% in the year 2018. The operating profit of the
company showed a slight decline and the same has been due to rising operating expenses. The
sales and general administrative expenses rose significantly for the company, which had
created a significant influence on the profitability of the company (Omar et al. 2014). The
operating profit of JD Sports Fashion Plc. is highly dependent on the revenue generated by the
company and the profitability derived by the company from the various operational activities
generated by the company.
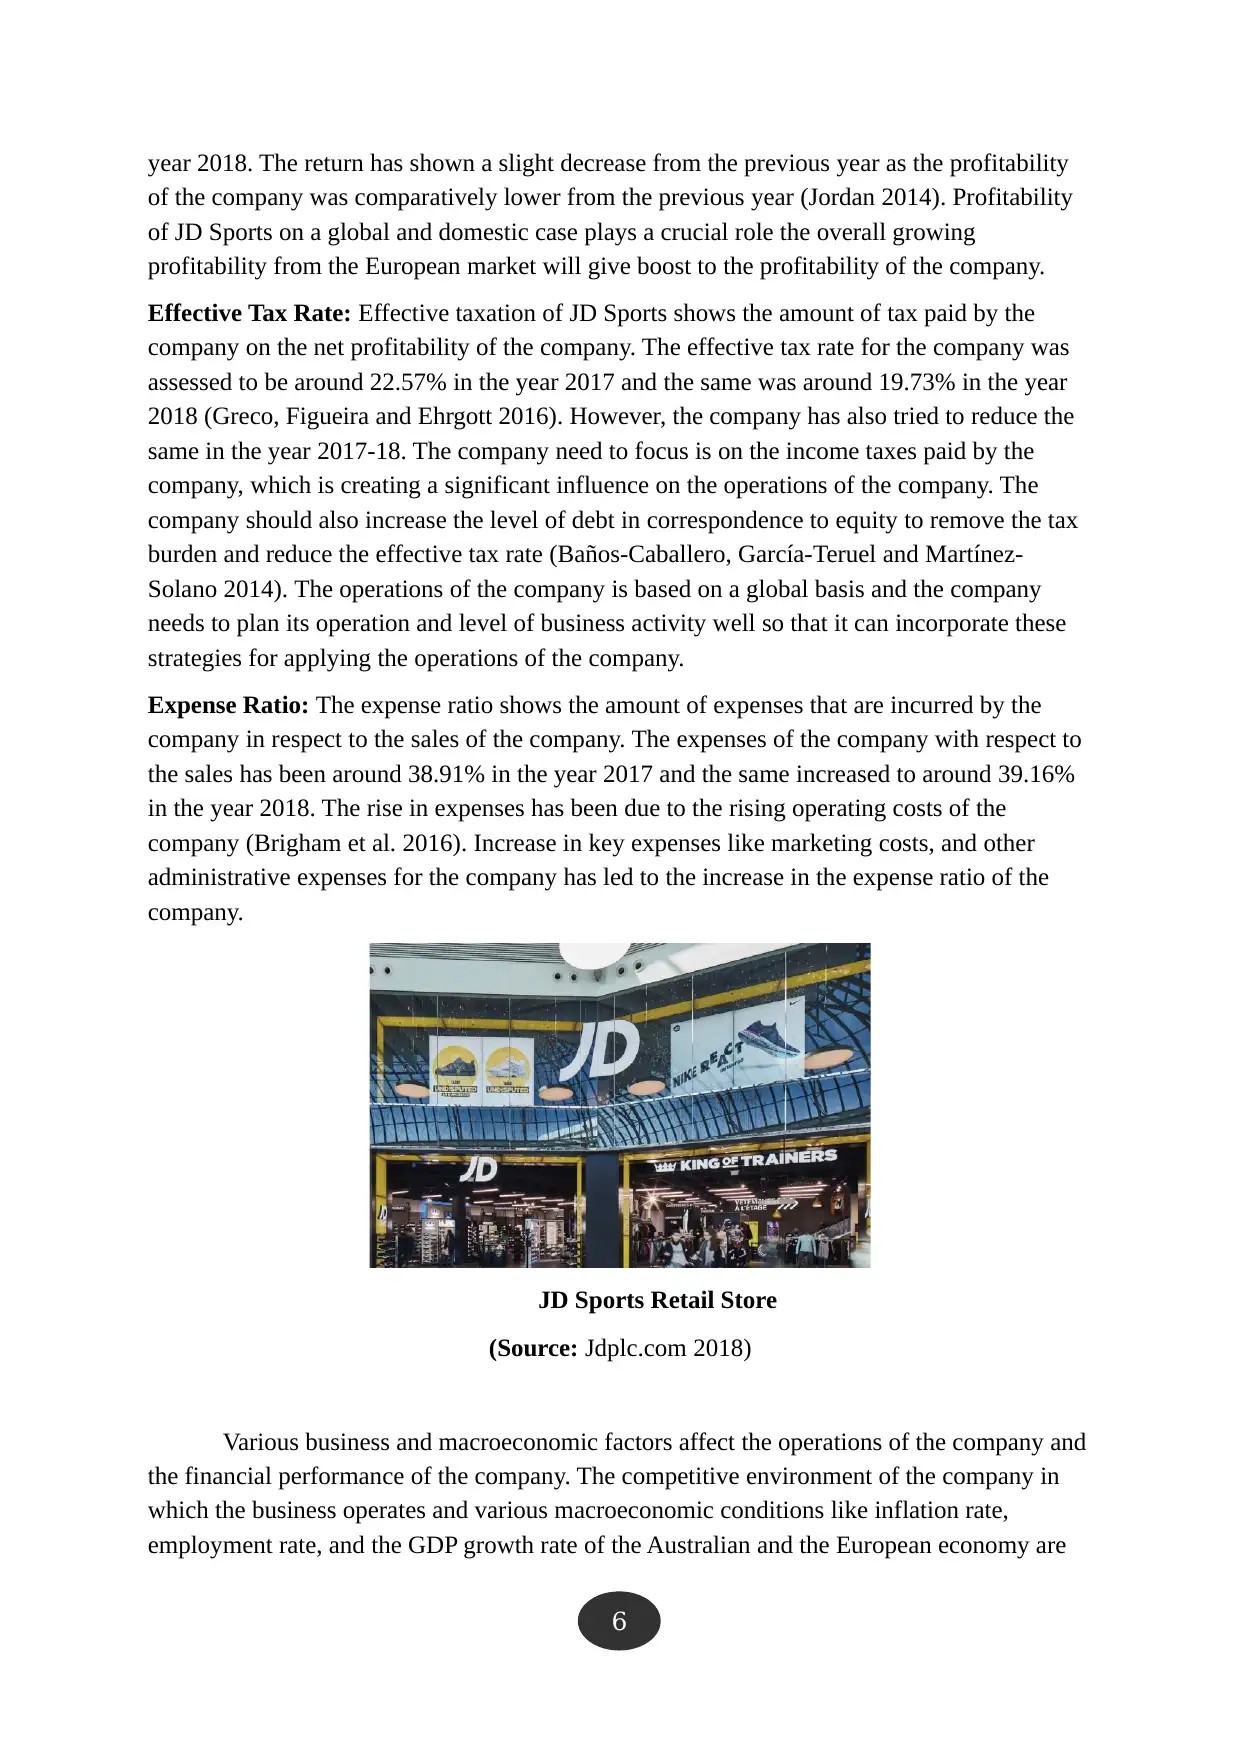
Revenue Growth of JD Sport Fashion Plc.
(Source: Jdplc.com 2018)
Return on Capital Employed: The return generated on the capital employed by the equity
shareholders and the debt holders of the company. The return on capital employed by the
company is calculated to be around 37.25% in the year 2017 and was around 31.35% in the
5
(Source: Jdplc.com 2018)
Operating Profit Margin: JD Sports Operating Profit Margin was calculated to be around
10.08% in the year 2017 and was around 9.36% in the year 2018. The operating profit of the
company showed a slight decline and the same has been due to rising operating expenses. The
sales and general administrative expenses rose significantly for the company, which had
created a significant influence on the profitability of the company (Omar et al. 2014). The
operating profit of JD Sports Fashion Plc. is highly dependent on the revenue generated by the
company and the profitability derived by the company from the various operational activities
generated by the company.
Revenue Growth of JD Sport Fashion Plc.
(Source: Jdplc.com 2018)
Return on Capital Employed: The return generated on the capital employed by the equity
shareholders and the debt holders of the company. The return on capital employed by the
company is calculated to be around 37.25% in the year 2017 and was around 31.35% in the
5
⊘ This is a preview!⊘
Do you want full access?
Subscribe today to unlock all pages.
Trusted by 1+ million students worldwide
year 2018. The return has shown a slight decrease from the previous year as the profitability
of the company was comparatively lower from the previous year (Jordan 2014). Profitability
of JD Sports on a global and domestic case plays a crucial role the overall growing
profitability from the European market will give boost to the profitability of the company.
Effective Tax Rate: Effective taxation of JD Sports shows the amount of tax paid by the
company on the net profitability of the company. The effective tax rate for the company was
assessed to be around 22.57% in the year 2017 and the same was around 19.73% in the year
2018 (Greco, Figueira and Ehrgott 2016). However, the company has also tried to reduce the
same in the year 2017-18. The company need to focus is on the income taxes paid by the
company, which is creating a significant influence on the operations of the company. The
company should also increase the level of debt in correspondence to equity to remove the tax
burden and reduce the effective tax rate (Baños-Caballero, García-Teruel and Martínez-
Solano 2014). The operations of the company is based on a global basis and the company
needs to plan its operation and level of business activity well so that it can incorporate these
strategies for applying the operations of the company.
Expense Ratio: The expense ratio shows the amount of expenses that are incurred by the
company in respect to the sales of the company. The expenses of the company with respect to
the sales has been around 38.91% in the year 2017 and the same increased to around 39.16%
in the year 2018. The rise in expenses has been due to the rising operating costs of the
company (Brigham et al. 2016). Increase in key expenses like marketing costs, and other
administrative expenses for the company has led to the increase in the expense ratio of the
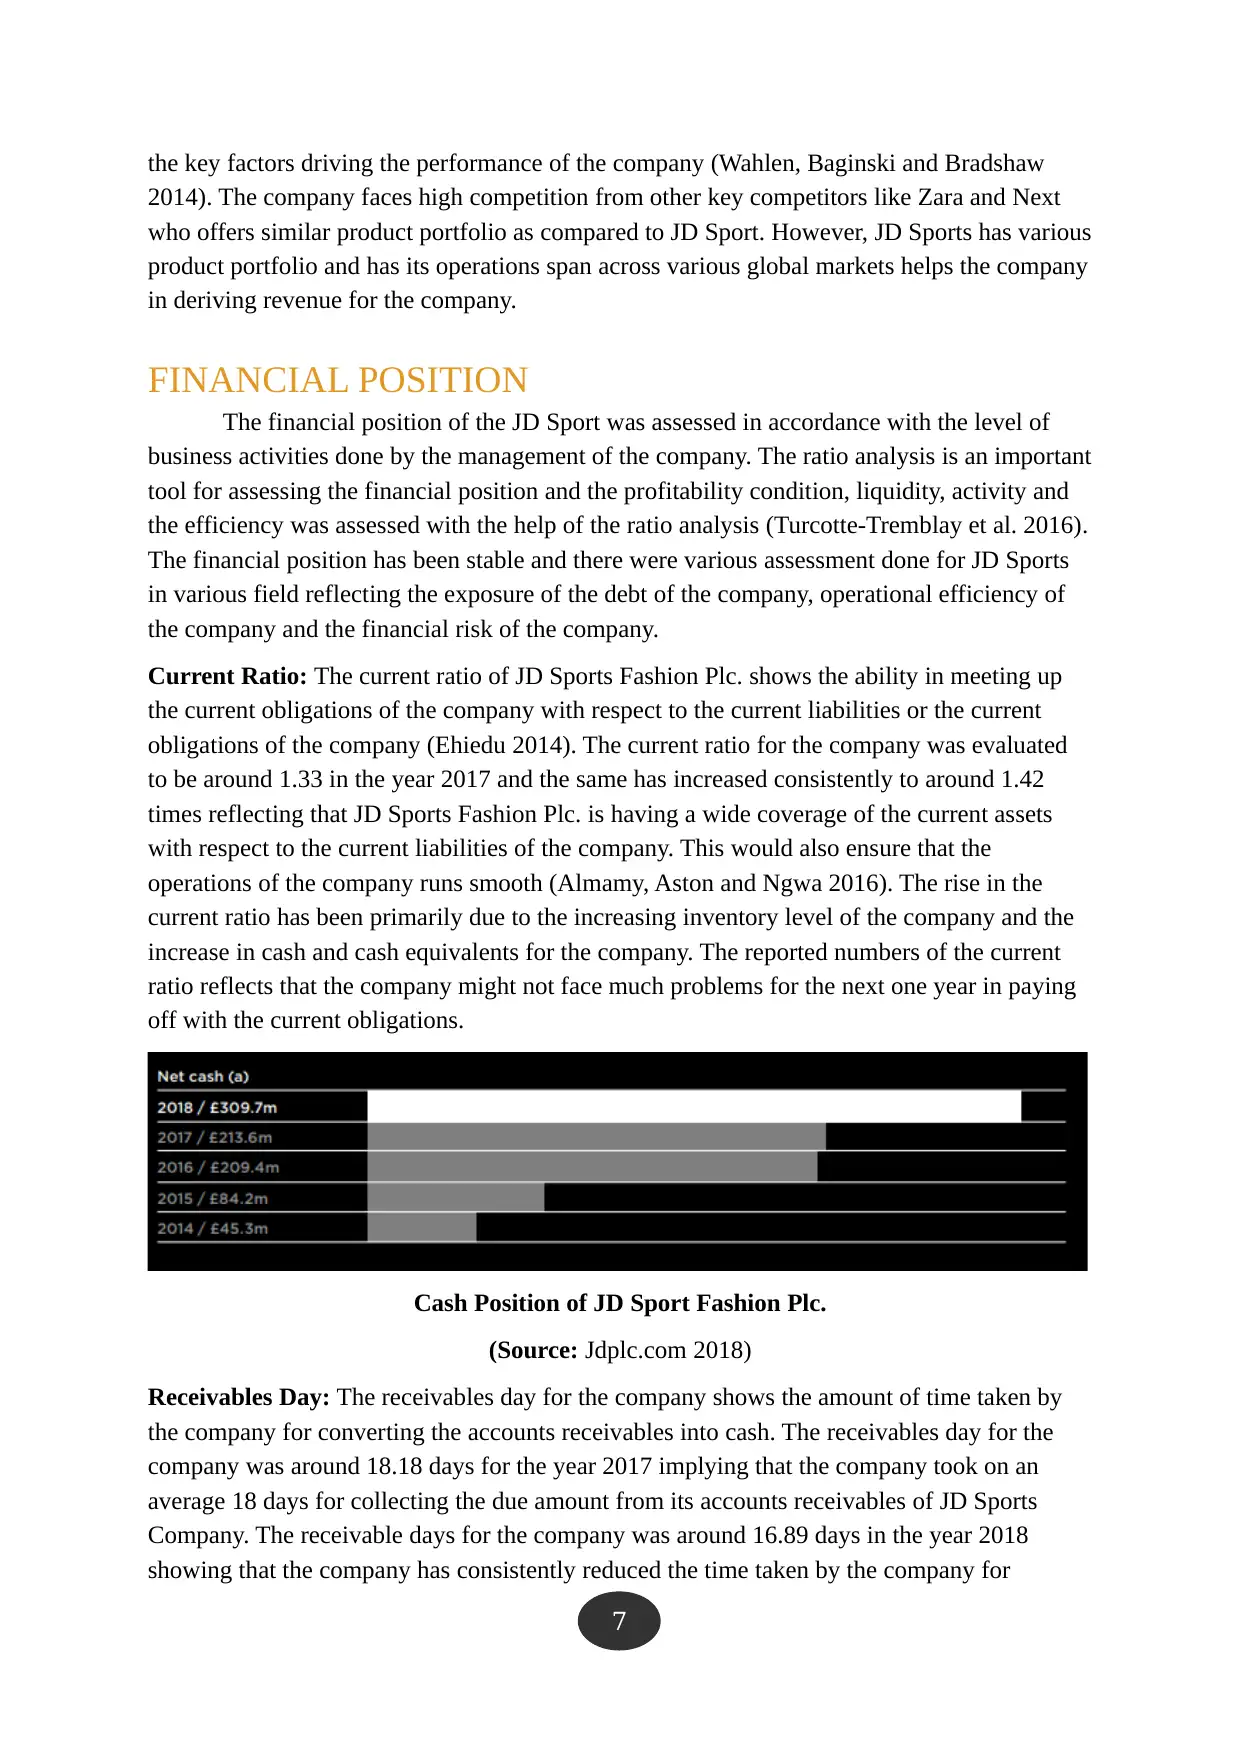
company.
JD Sports Retail Store
(Source: Jdplc.com 2018)
Various business and macroeconomic factors affect the operations of the company and
the financial performance of the company. The competitive environment of the company in
which the business operates and various macroeconomic conditions like inflation rate,
employment rate, and the GDP growth rate of the Australian and the European economy are
6
of the company was comparatively lower from the previous year (Jordan 2014). Profitability
of JD Sports on a global and domestic case plays a crucial role the overall growing
profitability from the European market will give boost to the profitability of the company.
Effective Tax Rate: Effective taxation of JD Sports shows the amount of tax paid by the
company on the net profitability of the company. The effective tax rate for the company was
assessed to be around 22.57% in the year 2017 and the same was around 19.73% in the year
2018 (Greco, Figueira and Ehrgott 2016). However, the company has also tried to reduce the
same in the year 2017-18. The company need to focus is on the income taxes paid by the
company, which is creating a significant influence on the operations of the company. The
company should also increase the level of debt in correspondence to equity to remove the tax
burden and reduce the effective tax rate (Baños-Caballero, García-Teruel and Martínez-
Solano 2014). The operations of the company is based on a global basis and the company
needs to plan its operation and level of business activity well so that it can incorporate these
strategies for applying the operations of the company.
Expense Ratio: The expense ratio shows the amount of expenses that are incurred by the
company in respect to the sales of the company. The expenses of the company with respect to
the sales has been around 38.91% in the year 2017 and the same increased to around 39.16%
in the year 2018. The rise in expenses has been due to the rising operating costs of the
company (Brigham et al. 2016). Increase in key expenses like marketing costs, and other
administrative expenses for the company has led to the increase in the expense ratio of the
company.
JD Sports Retail Store
(Source: Jdplc.com 2018)
Various business and macroeconomic factors affect the operations of the company and
the financial performance of the company. The competitive environment of the company in
which the business operates and various macroeconomic conditions like inflation rate,
employment rate, and the GDP growth rate of the Australian and the European economy are
6
Paraphrase This Document
Need a fresh take? Get an instant paraphrase of this document with our AI Paraphraser
the key factors driving the performance of the company (Wahlen, Baginski and Bradshaw
2014). The company faces high competition from other key competitors like Zara and Next
who offers similar product portfolio as compared to JD Sport. However, JD Sports has various
product portfolio and has its operations span across various global markets helps the company
in deriving revenue for the company.
FINANCIAL POSITION
The financial position of the JD Sport was assessed in accordance with the level of
business activities done by the management of the company. The ratio analysis is an important
tool for assessing the financial position and the profitability condition, liquidity, activity and
the efficiency was assessed with the help of the ratio analysis (Turcotte-Tremblay et al. 2016).
The financial position has been stable and there were various assessment done for JD Sports
in various field reflecting the exposure of the debt of the company, operational efficiency of
the company and the financial risk of the company.
Current Ratio: The current ratio of JD Sports Fashion Plc. shows the ability in meeting up
the current obligations of the company with respect to the current liabilities or the current
obligations of the company (Ehiedu 2014). The current ratio for the company was evaluated
to be around 1.33 in the year 2017 and the same has increased consistently to around 1.42
times reflecting that JD Sports Fashion Plc. is having a wide coverage of the current assets
with respect to the current liabilities of the company. This would also ensure that the
operations of the company runs smooth (Almamy, Aston and Ngwa 2016). The rise in the
current ratio has been primarily due to the increasing inventory level of the company and the
increase in cash and cash equivalents for the company. The reported numbers of the current
ratio reflects that the company might not face much problems for the next one year in paying
off with the current obligations.
Cash Position of JD Sport Fashion Plc.
(Source: Jdplc.com 2018)
Receivables Day: The receivables day for the company shows the amount of time taken by
the company for converting the accounts receivables into cash. The receivables day for the
company was around 18.18 days for the year 2017 implying that the company took on an
average 18 days for collecting the due amount from its accounts receivables of JD Sports
Company. The receivable days for the company was around 16.89 days in the year 2018
showing that the company has consistently reduced the time taken by the company for
7
collecting the due amount. The efficiency in the receivable period for the company would
reflect operation efficiency of the company (Dahmen and Rodríguez 2014).
Payable Days: The payable days of JD Sports shows the amount of time taken by the
company in paying off the accounts payable or the creditors. The payable days was around
71.98 days in the year 2017 and was around 71.95 days in the year 2018. JD Sports has
managed to pay the outstanding amount to the creditors of the company on an average in 71
days.
Gearing Ratio: The gearing ratio shows the effect of debt on the company. The level of debt
in correspondence to the equity level of the company was assessed. JD Sports Company is
having a very high amount of exposure to long-term debt of the company. The finance of the
company is currently financed from both equity and debt base which is the primary source of
finance for the company. The level of debt exposure for the company was around 51% in the
year 2017 and the same was around 48.69% in the year 2018. The debt in the financial
structure of the company will help the company in getting tax advantage in the form of
interest paid by the company which will reduce the effective tax rate of the company. The
company might be able to reduce the taxation burden and create more value for the
shareholders of the company. The company on the other hand should decrease the level of
debt for the company at the same time, which will though decrease the financial risk of the
company, but since the business risk is very low the company should keep optimal level of
debt in the company (Engelen, Fernandez and Hendrikse 2014).
Overall, the financial position is highly dependent on the key drivers of the company
such as the liquidity factors like the current ratio, which has been consistent for the company.
The activity ratio of JD Sports Fashion Plc. has also increased for the company thereby
reflecting that the management of the company is efficiently and actively managing the
resources of the company (Khidmat and Rehman 2014).
CONCLUSION
JD Sports has shown better profitability reflecting optimum utilisation and efficient
management by the company of the resources deployed by the shareholders of the
company but the same has been slightly down from the last year financial reporting. The
financial analysis of the company was conducted with the help of ratio analysis in
evaluating the financial performance of JD Sports Fashion. The liquidity position of the
company and the activity ratio’s was efficient for the company reflecting long-term
sustainable growth of the company. The company has also increased its activity ratio’s
thereby reducing the trade receivable period of the company. The operating profit
margin for the company and the return on capital employed generated by the company
has slightly decreased from the year 2017-2018. Thus, on an overall basis the revenue
base and the profitability of the company has increased sustainably for the company.
The key factor that the company need to focus is on the income taxes paid by the
8
⊘ This is a preview!⊘
Do you want full access?
Subscribe today to unlock all pages.
Trusted by 1+ million students worldwide

company, which is creating a significant influence on the operations of the company. JD
Sports can also increase the level of debt in correspondence to equity to remove the tax
burden and reduce the effective tax rate of the company. JD Sports Fashion Plc. should
recognize and analyze the same so that the same can bring operational efficiency in the
company.
9
Sports can also increase the level of debt in correspondence to equity to remove the tax
burden and reduce the effective tax rate of the company. JD Sports Fashion Plc. should
recognize and analyze the same so that the same can bring operational efficiency in the
company.
9
Paraphrase This Document
Need a fresh take? Get an instant paraphrase of this document with our AI Paraphraser
REFERENCE
Almamy, J., Aston, J. and Ngwa, L.N., 2016. An evaluation of Altman's Z-score using cash
flow ratio to predict corporate failure amid the recent financial crisis: Evidence from the
UK. Journal of Corporate Finance, 36, pp.278-285.
Baños-Caballero, S., García-Teruel, P.J. and Martínez-Solano, P., 2014. Working capital
management, corporate performance, and financial constraints. Journal of Business
Research, 67(3), pp.332-338.
Bonfrer, I., Soeters, R., Van de Poel, E., Basenya, O., Longin, G., van de Looij, F. and van
Doorslaer, E., 2014. Introduction of performance-based financing in Burundi was associated
with improvements in care and quality. Health Affairs, 33(12), pp.2179-2187.
Brigham, E.F., Ehrhardt, M.C., Nason, R.R. and Gessaroli, J., 2016. Financial Managment:
Theory And Practice, Canadian Edition. Nelson Education.
Dahmen, P. and Rodríguez, E., 2014. Financial literacy and the success of small businesses:
An observation from a small business development center. Numeracy, 7(1), p.3.
Ehiedu, V.C., 2014. The impact of liquidity on profitability of some selected companies: the
financial statement analysis (FSA) approach. Research Journal of Finance and
Accounting, 5(5), pp.81-90.
Engelen, E., Fernandez, R. and Hendrikse, R., 2014. How finance penetrates its other: A
cautionary tale on the financialization of a Dutch university. Antipode, 46(4), pp.1072-1091.
Fritsche, G.B., Soeters, R. and Meessen, B., 2014. Performance-based financing toolkit. The
World Bank.
Greco, S., Figueira, J. and Ehrgott, M., 2016. Multiple criteria decision analysis. New York:
Springer.
Jdplc.com. (2018). Annual Report. [online] Available at:
https://www.jdplc.com/~/media/Files/J/Jd-Sports-Fashion-Plc/reports-and-presentations/2018-
annual-report-v1.pdf [Accessed 4 Jan. 2019].
Jordan, B., 2014. Fundamentals of investments. McGraw-Hill Higher Education.
Khidmat, W. and Rehman, M., 2014. Impact of liquidity and solvency on profitability
chemical sector of Pakistan. Economics management innovation, 6(3), pp.34-67.
Omar, N., Koya, R.K., Sanusi, Z.M. and Shafie, N.A., 2014. Financial statement fraud: A case
examination using Beneish Model and ratio analysis. International Journal of Trade,
Economics and Finance, 5(2), p.184.
Turcotte-Tremblay, A.M., Spagnolo, J., De Allegri, M. and Ridde, V., 2016. Does
performance-based financing increase value for money in low-and middle-income countries?
A systematic review. Health economics review, 6(1), p.30.
1

Vogel, H.L., 2014. Entertainment industry economics: A guide for financial analysis.
Cambridge University Press.
Wahlen, J., Baginski, S. and Bradshaw, M., 2014. Financial reporting, financial statement
analysis and valuation. Nelson Education.
1
Cambridge University Press.
Wahlen, J., Baginski, S. and Bradshaw, M., 2014. Financial reporting, financial statement
analysis and valuation. Nelson Education.
1
⊘ This is a preview!⊘
Do you want full access?
Subscribe today to unlock all pages.
Trusted by 1+ million students worldwide
1 out of 14
Related Documents


Your All-in-One AI-Powered Toolkit for Academic Success.
+13062052269
info@desklib.com
Available 24*7 on WhatsApp / Email
![[object Object]](/_next/static/media/star-bottom.7253800d.svg)
Unlock your academic potential
Copyright © 2020–2026 A2Z Services. All Rights Reserved. Developed and managed by ZUCOL.