JD Sports Fashion PLC: Analysis and Comparison of Financial Reports
VerifiedAdded on 2020/07/23
|18
|3058
|54
Report
AI Summary
This report provides a comprehensive financial analysis of JD Sports Fashion PLC, comparing its performance with Sports Direct International PLC over a five-year period. The analysis includes a detailed examination of income statements, balance sheets, and cash flow statements, along with a comparative financial ratio analysis focusing on profitability, liquidity, and asset turnover. The report highlights key trends in revenue, cost of goods sold, gross profit, and net profit, as well as the financial position and cash flow activities of both companies. The financial ratios, including interest coverage, asset turnover, quick ratio, return on assets, return on equity, and profit margin, are calculated and interpreted to assess the financial health and investment potential of each company. The report also evaluates the shareholder's equity and capital structure of both firms, providing insights into their ability to meet debts and attract investments. This analysis, available on Desklib, aims to provide stakeholders with valuable information for making informed investment decisions in the competitive UK sports retail market.

Analyse and compare the financial reports
and related information for JD Sports
Fashion PLC
and related information for JD Sports
Fashion PLC
Paraphrase This Document
Need a fresh take? Get an instant paraphrase of this document with our AI Paraphraser
TABLE OF CONTENTS
INTRODUCTION...........................................................................................................................1
Scope and relevance of analysis.............................................................................................1
Arguments..............................................................................................................................7
Evidence.................................................................................................................................7
CONCLUSION................................................................................................................................8
BIBLIOGRAPHY............................................................................................................................9
REFERENCES..............................................................................................................................10
APPENDIX....................................................................................................................................11
INTRODUCTION
Financial disclosure affects the decisions of internal or external stakeholders of the
organisation. The directors, owners or managerial head uses such database to generate an
adequate information which in turn helpful for presenting the innovative changes in the
production and other relevant operational activities. Share holders of the firm will be beneficial
in identifying the profitability of business in such period as well as analyse the growth of
business during such years. However, in the present assessments there will be comparison
between two most successful sports brand of UK such as JD Sports Fashion PLC and Sport
Direct International PLC. There will be discussion based on the growth of both the companies
and how they compete with each other in this challenging world.
Scope and relevance of analysis
In accordance with making the comparison between both the organisation this will be
based on the financial reports and statements of last five years. Hence, in context with growth of
such companies there analysis which is based on analysing the income statement, financial
position, cash flow statements and the comparative ratio analysis of both firms. Hence, such
financial examination of accounts will be fruitful making better assumption or decision by
stakeholder for their investments decisions (Gaynor And et.al., 2016). Thus, this will be helpful
for them to compare and gather information about which organisation will be more profitable in
paying the returns of such investment as well as beneficial in gaining the adequate dividends.
1
⊘ This is a preview!⊘
Do you want full access?
Subscribe today to unlock all pages.
Trusted by 1+ million students worldwide
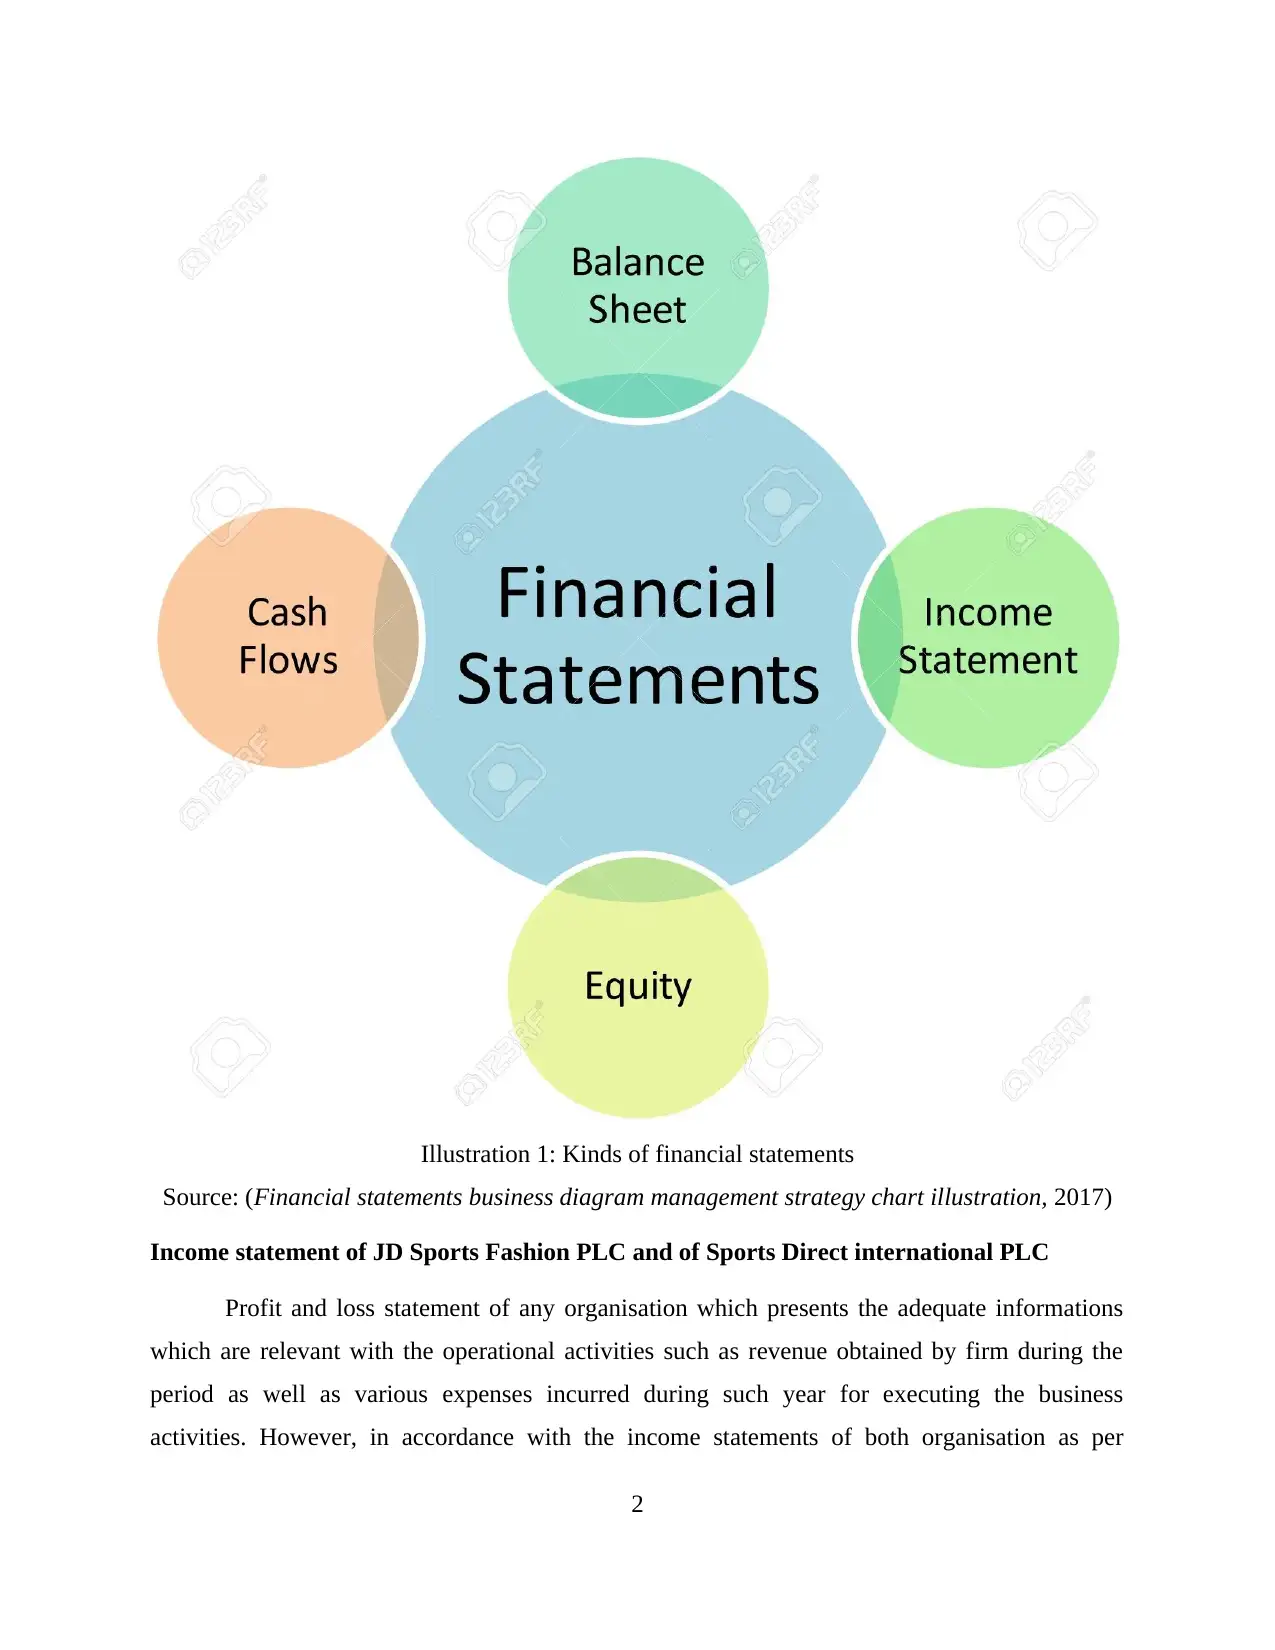
Illustration 1: Kinds of financial statements
Source: (Financial statements business diagram management strategy chart illustration, 2017)
Income statement of JD Sports Fashion PLC and of Sports Direct international PLC
Profit and loss statement of any organisation which presents the adequate informations
which are relevant with the operational activities such as revenue obtained by firm during the
period as well as various expenses incurred during such year for executing the business
activities. However, in accordance with the income statements of both organisation as per
2
Paraphrase This Document
Need a fresh take? Get an instant paraphrase of this document with our AI Paraphraser
Appendix 1 and 2 which reflects the growth or these organisations in accordance with five year's
data set. Hence, this can be analysed per year and generate the adequate solutions to the
accounting executives of the firm in making the changes in operational activities.
In the year 2013, Revenue gathered by JD Sports Fashion PLC which is 1259 million and
have the COGS for 645 million which presents the Gross Profit for 613 million. However, the
Sports Direct International PLC has the revenue for the same year is for 2186 million and COGS
for 1291 and the GP of 895 million. Hence, it can be said that as per the sales revenue of Sports
Direct is more than the JD Sports than there will be large number of cost incurred while
producing such products (Jung, Park and Chung, 2016). Hence, such things reflects that the
demand for products is more for the Sports direct in year. However, the operating income of JD
Sports and Sports Direct are 54m and 205m respectively. Therefore, it can be said that Sports
direct is giving the tough competition to JD Sports as it has the favourable earning. Thus, in
terms with the net profit for the year JD sports has 87m while Sports Direct has 269m
respectively.
In the year 2014, JD Sports has obtained the revenue for 1331 m, COGS for 685 which
presents the Gross profit for 645. However, for Sports Direct have the revenue for 2706, COGS
for 1551 thus have presented the gross profit for 1155. Thus, in accordance with Appendix 1 and
2 both the businesses has obtained the net profit of the year as 94 million and 311 million.
Hence, it indicates that Sports Direct is have the profitable gains as compared with JD sports.
In the year 2015, Income earned thorough making sales in this year both the companies
as 1522 million and 2833. Hence, same as with the 2016 and 2017 these companies has variation
is their earning. However, it can be said that JD sports need to make developments in the
production as well as marketing techniques which in turn helps the organisation to make the
adequate sales therefore it will be able to generate the adequate revenue. Moreover, the net profit
for the year 2017 of JD sports is 303 and fro sports direct it is 439. Thus, it can be said that JD
sport is making the adequate growth in the current year as compared with the growth of Sport
Direct. Hence, it can be said that JD sports will be beneficial for the shareholders in coming time
as this company is continuously growing and acquiring the adequate profitability.
Financial position of JD Sports Fashion PLC and of Sports Direct international PLC
3
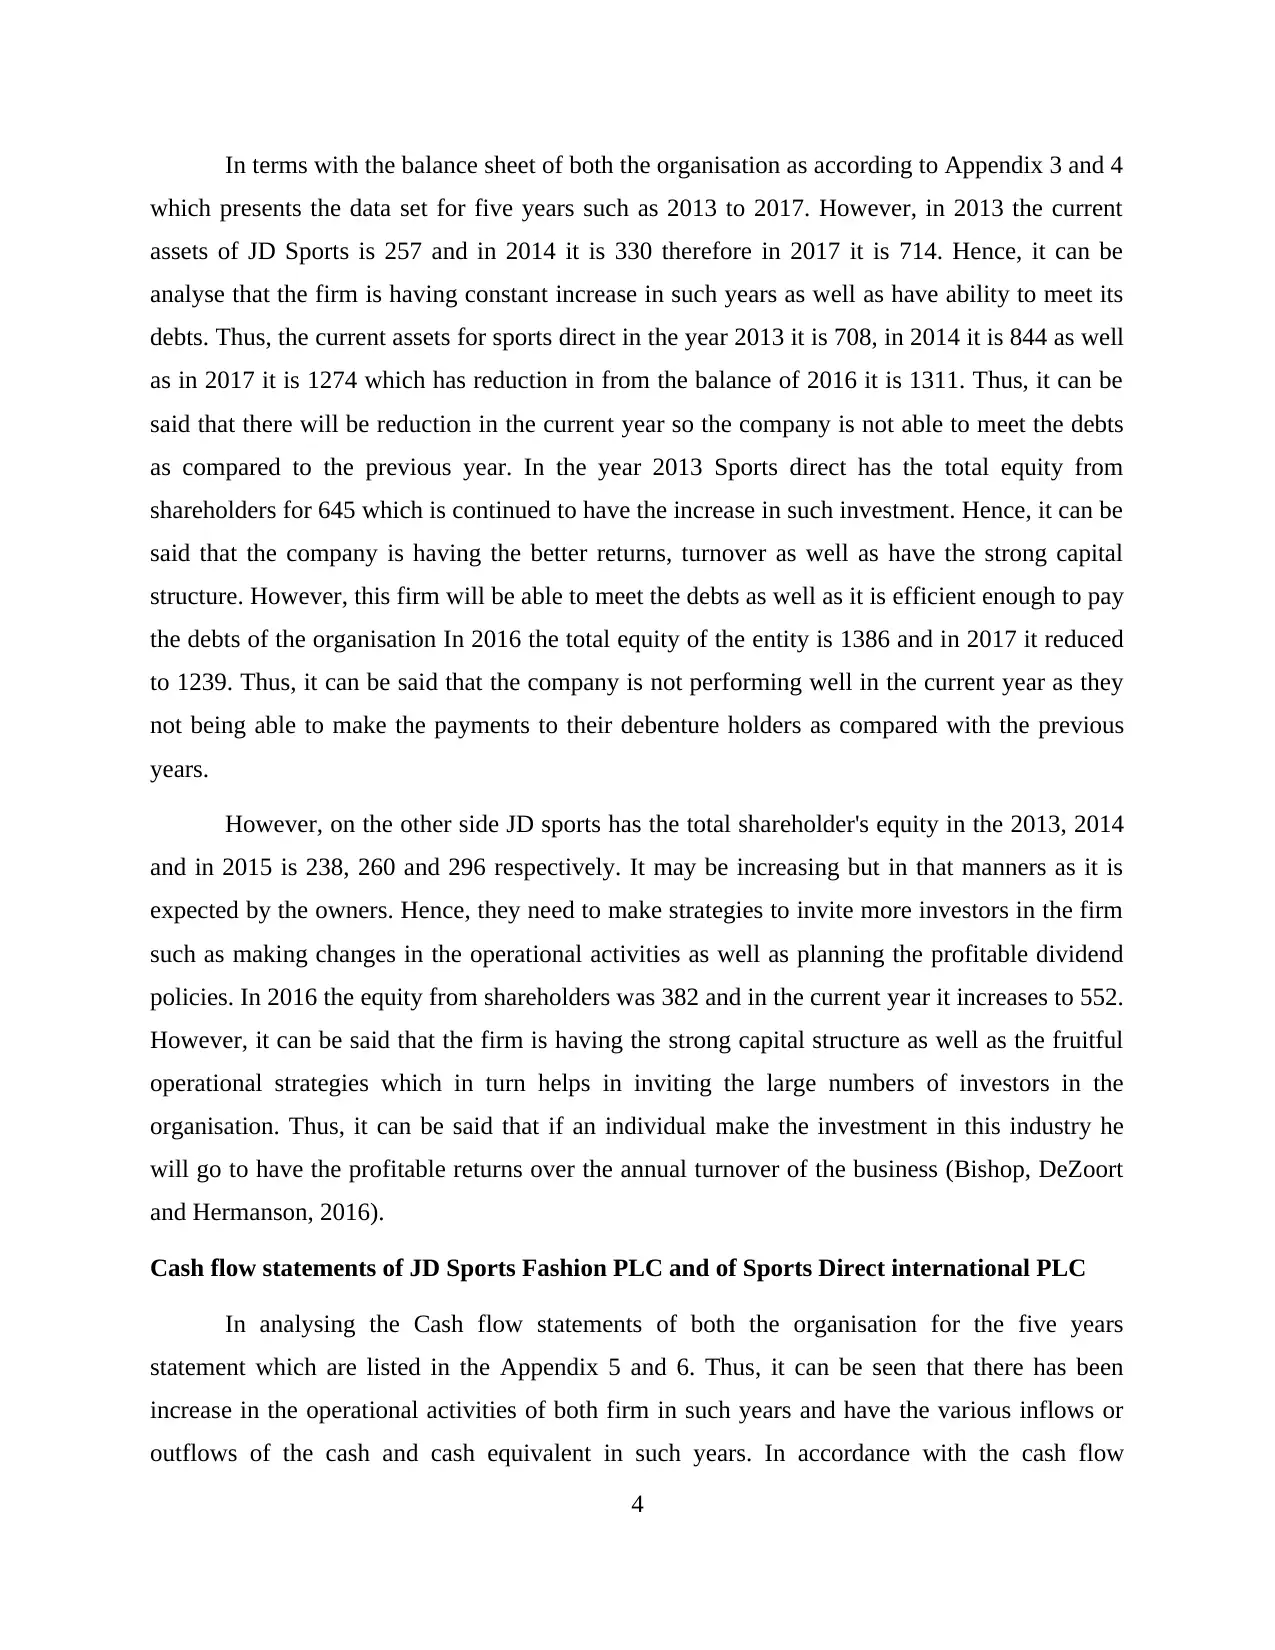
In terms with the balance sheet of both the organisation as according to Appendix 3 and 4
which presents the data set for five years such as 2013 to 2017. However, in 2013 the current
assets of JD Sports is 257 and in 2014 it is 330 therefore in 2017 it is 714. Hence, it can be
analyse that the firm is having constant increase in such years as well as have ability to meet its
debts. Thus, the current assets for sports direct in the year 2013 it is 708, in 2014 it is 844 as well
as in 2017 it is 1274 which has reduction in from the balance of 2016 it is 1311. Thus, it can be
said that there will be reduction in the current year so the company is not able to meet the debts
as compared to the previous year. In the year 2013 Sports direct has the total equity from
shareholders for 645 which is continued to have the increase in such investment. Hence, it can be
said that the company is having the better returns, turnover as well as have the strong capital
structure. However, this firm will be able to meet the debts as well as it is efficient enough to pay
the debts of the organisation In 2016 the total equity of the entity is 1386 and in 2017 it reduced
to 1239. Thus, it can be said that the company is not performing well in the current year as they
not being able to make the payments to their debenture holders as compared with the previous
years.
However, on the other side JD sports has the total shareholder's equity in the 2013, 2014
and in 2015 is 238, 260 and 296 respectively. It may be increasing but in that manners as it is
expected by the owners. Hence, they need to make strategies to invite more investors in the firm
such as making changes in the operational activities as well as planning the profitable dividend
policies. In 2016 the equity from shareholders was 382 and in the current year it increases to 552.
However, it can be said that the firm is having the strong capital structure as well as the fruitful
operational strategies which in turn helps in inviting the large numbers of investors in the
organisation. Thus, it can be said that if an individual make the investment in this industry he
will go to have the profitable returns over the annual turnover of the business (Bishop, DeZoort
and Hermanson, 2016).
Cash flow statements of JD Sports Fashion PLC and of Sports Direct international PLC
In analysing the Cash flow statements of both the organisation for the five years
statement which are listed in the Appendix 5 and 6. Thus, it can be seen that there has been
increase in the operational activities of both firm in such years and have the various inflows or
outflows of the cash and cash equivalent in such years. In accordance with the cash flow
4
⊘ This is a preview!⊘
Do you want full access?
Subscribe today to unlock all pages.
Trusted by 1+ million students worldwide
statements of JD Sports in 2013 to 2017 is it -14, 29, 46, 149 and 191 millions respectively.
Hence, it can be said that the firm is having improvement in making the reserve for the coming
time period as well as having the adequate reserves each which in turn helping it to meet all
expenses and costs of the operational activities very adequately.
In accordance with the cash flow of sports direct from the year 2013 to 2017 as per the
five year analysis it can be said that there has been increase in the revenue gathering of the firm
over such years but it is not adequate and accurately as compare with the JD sports. Hence, the
cash flow of the year 2013 to 2017 are 64, 98, 137, -141, -220. Thus, it can be said that the firm
is having losses or negative balance in the 2016 and 2017 therefore it represents that the firm is
not able to meet the operating expenses in such years as well as having the not adequate reserve
which in turn affect the profitability as well as impacts over reducing the investments from
shareholders. Hence, the main reason behind the low investment an inadequate capital structure
its is due to low cash reserves in the hand. Thus, the shareholders of investor are no feeling
profitable to make the investment in the firm.
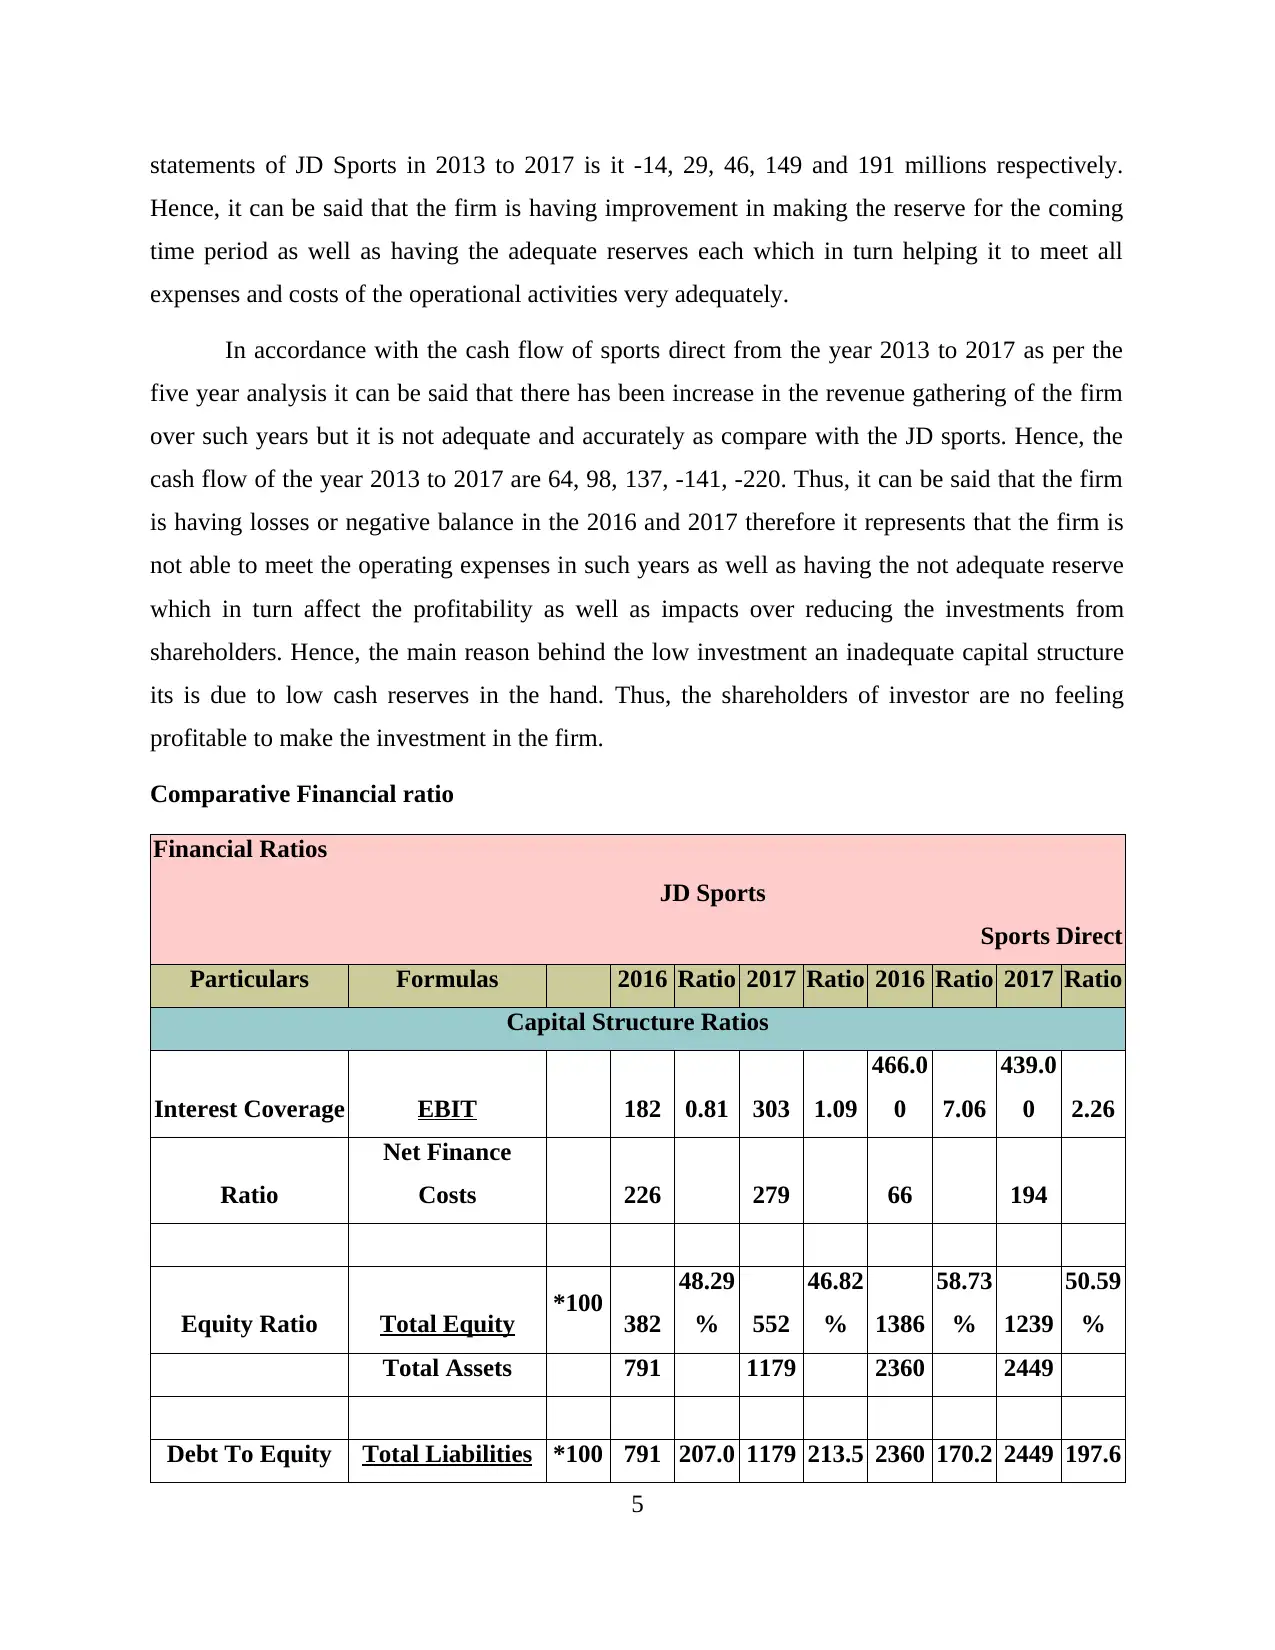
Comparative Financial ratio
Financial Ratios
JD Sports
Sports Direct
Particulars Formulas 2016 Ratio 2017 Ratio 2016 Ratio 2017 Ratio
Capital Structure Ratios
Interest Coverage EBIT 182 0.81 303 1.09
466.0
0 7.06
439.0
0 2.26
Ratio
Net Finance
Costs 226 279 66 194
Equity Ratio Total Equity *100 382
48.29
% 552
46.82
% 1386
58.73
% 1239
50.59
%
Total Assets 791 1179 2360 2449
Debt To Equity Total Liabilities *100 791 207.0 1179 213.5 2360 170.2 2449 197.6
5
Hence, it can be said that the firm is having improvement in making the reserve for the coming
time period as well as having the adequate reserves each which in turn helping it to meet all
expenses and costs of the operational activities very adequately.
In accordance with the cash flow of sports direct from the year 2013 to 2017 as per the
five year analysis it can be said that there has been increase in the revenue gathering of the firm
over such years but it is not adequate and accurately as compare with the JD sports. Hence, the
cash flow of the year 2013 to 2017 are 64, 98, 137, -141, -220. Thus, it can be said that the firm
is having losses or negative balance in the 2016 and 2017 therefore it represents that the firm is
not able to meet the operating expenses in such years as well as having the not adequate reserve
which in turn affect the profitability as well as impacts over reducing the investments from
shareholders. Hence, the main reason behind the low investment an inadequate capital structure
its is due to low cash reserves in the hand. Thus, the shareholders of investor are no feeling
profitable to make the investment in the firm.
Comparative Financial ratio
Financial Ratios
JD Sports
Sports Direct
Particulars Formulas 2016 Ratio 2017 Ratio 2016 Ratio 2017 Ratio
Capital Structure Ratios
Interest Coverage EBIT 182 0.81 303 1.09
466.0
0 7.06
439.0
0 2.26
Ratio
Net Finance
Costs 226 279 66 194
Equity Ratio Total Equity *100 382
48.29
% 552
46.82
% 1386
58.73
% 1239
50.59
%
Total Assets 791 1179 2360 2449
Debt To Equity Total Liabilities *100 791 207.0 1179 213.5 2360 170.2 2449 197.6
5
Paraphrase This Document
Need a fresh take? Get an instant paraphrase of this document with our AI Paraphraser
Ratio 7% 9% 7% 6%
Total Equity 382 552 1386 1239
Asset Efficiency Ratio
Asset Turnover Sales Revenue 1822 4.05
2379.
00 3.04
2904.
00 1.97
3245.
00 2.56
Ratio
Average Total
Assets 450 783.5 1473 1269
Liquidity Ratios
Quick Ratio
Current Assets-
Inventory 273 0.78
366.0
0 0.68
609.0
0 0.63
645.0
0 0.53
Current
Liabilities 348 535 973 1210
Current Ratio Current Assets 511 1.47
714.0
0 1.33
1311.
00 1.35
1274.
00 1.05
Current
Liabilities 348 535 973 1210
Profitability Ratios
Return On Assets Profit (LOSS) *100 182
40.44
% 303
38.67
% 466
31.64
% 439
34.59
%
Average Total
Assets 450 783.5 1473 1269
Return On
Equity
Profit Available
To Owners *100 182
77.78
% 303
83.93
% 466
31.64
% 439
34.59
%
Average Equity 234 361 1473 1269
Profit Margin Profit (LOSS) *100 182
9.99
% 303
12.74
% 466
16.05
% 439
13.53
%
Sales Revenue 1822 2379 2904 3245
6
Interpretation: The above listed table reflects the financial ratio analysis of both the
firms which are giving the tough competition to each other on the basis of Profitability, liquidity
and current ratios. Hence, such analysis is based on the 2 years such 2016 and 2017. Thus, such
analysis will help the stakeholders or investors of the firm in making the adequate investment
decisions which in turn helps in strengthening the capital structure of the firm. Hence, the Capital
structure ratio of JD and Sports direct in the year 2016 on the basis of Interest coverage ratio it is
0.81 and 7.06. Thus, it indicates that in 2016 the Sports direct is having the adequate coverage
over having the effective earning or profitably. Hence, in 2017 it is 1.09 and 2.26. Thus, it can be
said that JD Sports is having the growth in the earning but sport direct is not performing up to the
mark as they have reduction in this ratio.
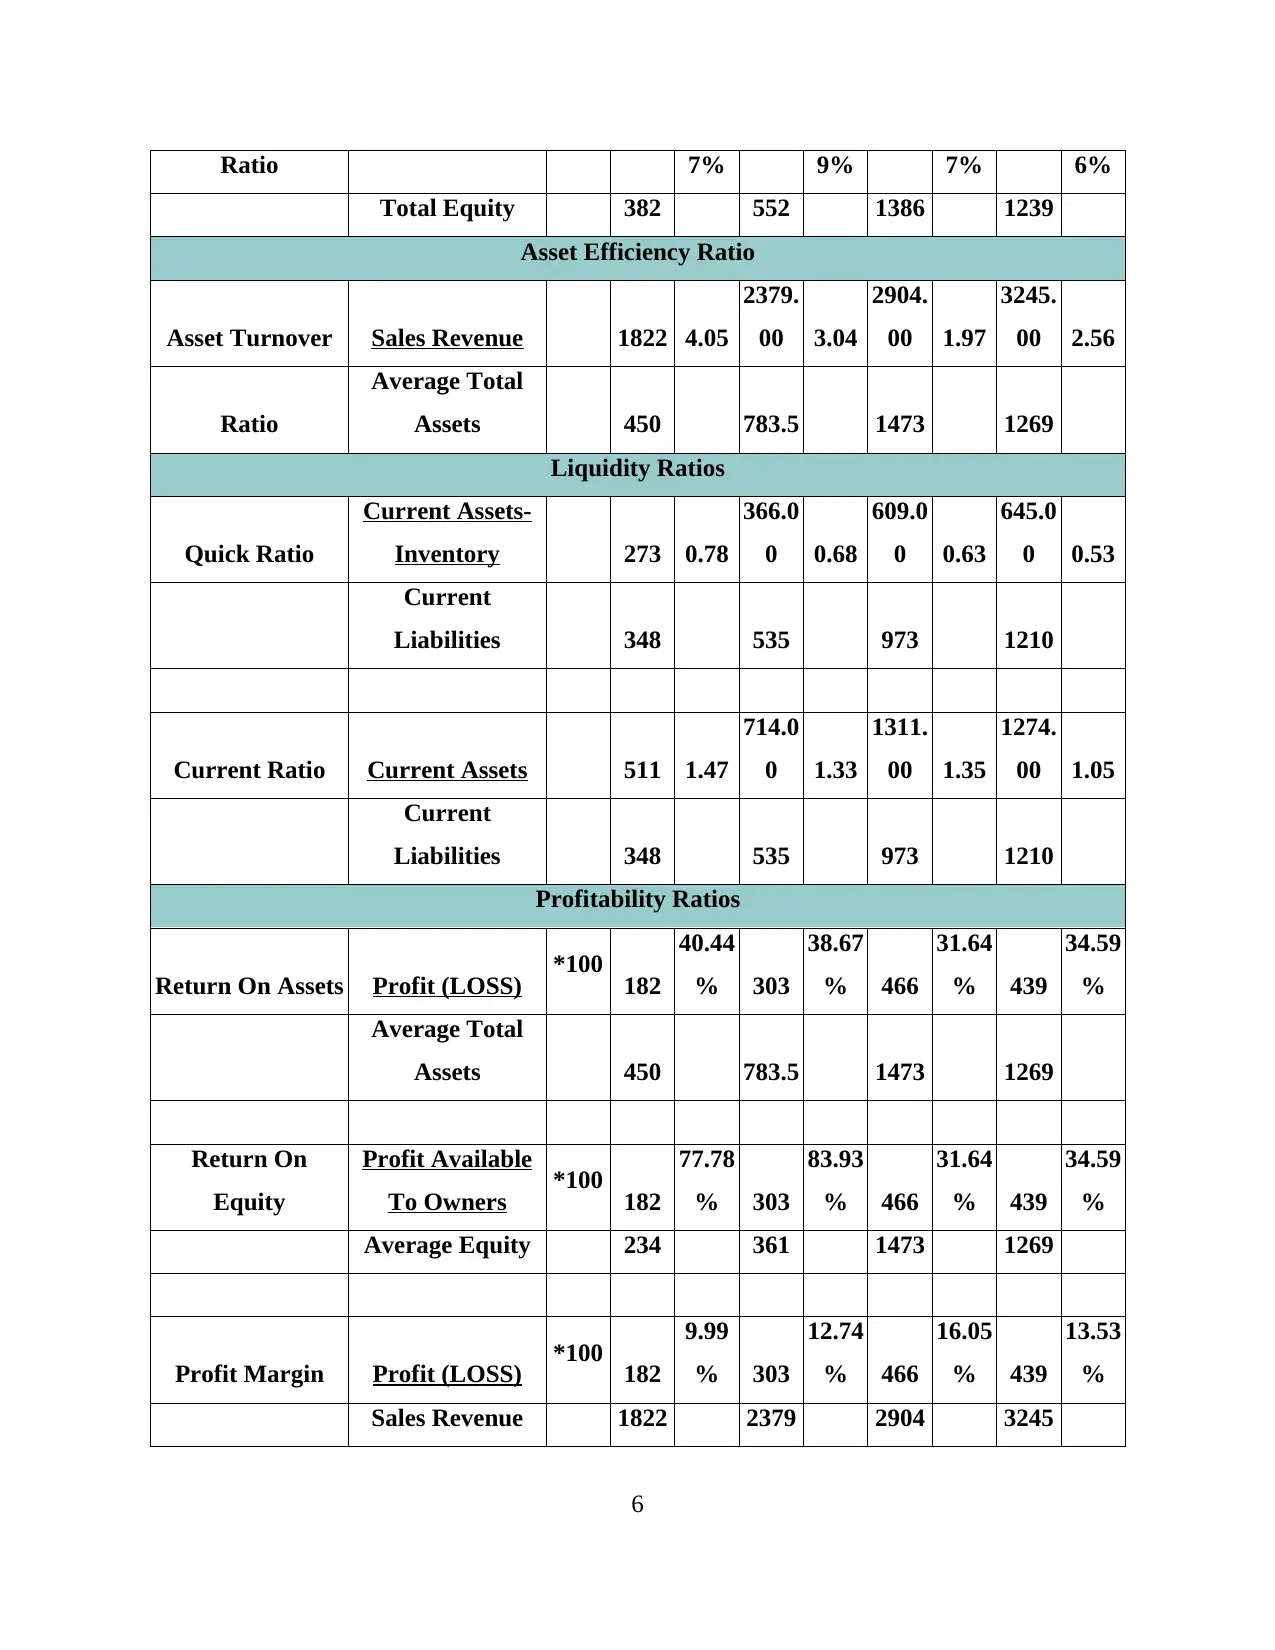
However, in accordance with the assets turnover ratio both the firms were analysed as per
2016 and 2017. Hence, in 2016 the JD Sports and sports direct have the turnover ratio for 4.05
and 1.97. Hence, it indicates that the JD sports is having the appropriate numbers of assets as
well as they have the better turnover than compared with the Sports direct. It can be seen in the
current year as JD has 3.04 and sport direct has 2.56 of turnover ratio. Thus, such changes
explains that there is the adequate changes in the profitability of the firm and JD sports is more
beneficial in investment purpose. However, In accordance with the liquidity ratio these firms are
about to have the adequate liquidity such as in 2016 the current ratio of the JD Sports and sport
direct is 1.47 and 1.35. JD sports is having better strength in the liquidity of the firm.
In terms of Profitability of the firms it can be said that both have the adequate growth in
such years. Hence, the profit margin for the years 2016 JD Sports is 9.99% and Sports direct
have the 16.05% therefore, it can be said that, Sports Direct is having the adequate revenue
gathering and profitability over the sales made firm in the year so it has the favourable margin. In
the 2017 the margin for both te companies are 12.74% and 13.53% there fire it can be seen that
there has a positive changes in the increase of the profit margin of JD Sports in the year 2017 and
have the negative of unfavourable gains of the margin ratio for sport direct. Thus, in the current
year JD has the good growth while Sports direct has decrease in such profitability.
Arguments
In terms of the financial analysis of both the forms it can be said that the JD sport have
the constant growth in 5 years. Thus, sport direct have decline in the operational activities in
7
firms which are giving the tough competition to each other on the basis of Profitability, liquidity
and current ratios. Hence, such analysis is based on the 2 years such 2016 and 2017. Thus, such
analysis will help the stakeholders or investors of the firm in making the adequate investment
decisions which in turn helps in strengthening the capital structure of the firm. Hence, the Capital
structure ratio of JD and Sports direct in the year 2016 on the basis of Interest coverage ratio it is
0.81 and 7.06. Thus, it indicates that in 2016 the Sports direct is having the adequate coverage
over having the effective earning or profitably. Hence, in 2017 it is 1.09 and 2.26. Thus, it can be
said that JD Sports is having the growth in the earning but sport direct is not performing up to the
mark as they have reduction in this ratio.
However, in accordance with the assets turnover ratio both the firms were analysed as per
2016 and 2017. Hence, in 2016 the JD Sports and sports direct have the turnover ratio for 4.05
and 1.97. Hence, it indicates that the JD sports is having the appropriate numbers of assets as
well as they have the better turnover than compared with the Sports direct. It can be seen in the
current year as JD has 3.04 and sport direct has 2.56 of turnover ratio. Thus, such changes
explains that there is the adequate changes in the profitability of the firm and JD sports is more
beneficial in investment purpose. However, In accordance with the liquidity ratio these firms are
about to have the adequate liquidity such as in 2016 the current ratio of the JD Sports and sport
direct is 1.47 and 1.35. JD sports is having better strength in the liquidity of the firm.
In terms of Profitability of the firms it can be said that both have the adequate growth in
such years. Hence, the profit margin for the years 2016 JD Sports is 9.99% and Sports direct
have the 16.05% therefore, it can be said that, Sports Direct is having the adequate revenue
gathering and profitability over the sales made firm in the year so it has the favourable margin. In
the 2017 the margin for both te companies are 12.74% and 13.53% there fire it can be seen that
there has a positive changes in the increase of the profit margin of JD Sports in the year 2017 and
have the negative of unfavourable gains of the margin ratio for sport direct. Thus, in the current
year JD has the good growth while Sports direct has decrease in such profitability.
Arguments
In terms of the financial analysis of both the forms it can be said that the JD sport have
the constant growth in 5 years. Thus, sport direct have decline in the operational activities in
7
⊘ This is a preview!⊘
Do you want full access?
Subscribe today to unlock all pages.
Trusted by 1+ million students worldwide
2016 and 2017. It terms of making the investment in such companies it can be said that the
shareholders must prefer to make investment in the JD sports has it has the favourable cash flows
and the adequate current assets in such years (Biddle and et.al., 2016). However, the firm will be
able to make payments to its debenture holders and bring the adequate returns to the investors
(Ge and et.al., 2017). However, JD has the fruitful business in the year as well as they are
facilitating the adequate benefits to shareholders as well as in context with the growth of this
firm in 2013 to 2017 years which in turn helpful in attracting the consumers.
Evidence
In terms of analysing such financial dataset of both the companies over the years which
represents the adequate growth in the current year for JD sports. Thus, the competitor of te
company is Sport direct which is not having the adequate return or profitable gains as compared
to its past few years (Leuz and Wysocki, 2016). Hence, such statements are based on the annual
reports of both the organisations and were analysed over calculating the rations of such
statements and database.
CONCLUSION
By considering the above study it can be said that both the firms are competitive to each
other in the sports' environment and have the profitable earning. Hence, there were discussion
based on the five year financial statement of JD sports Fashion PLC and Sports Direct
International PLC. Thus, with the help of such analysis it can be recommended to the
stakeholders of the firm is that they must make investments in JD Sports as the firm is having the
favourable earning as well as paying the shareholders in the profitable returns. Further, it will be
said that they must invest in such company and gain the fruitful earnings.
8
Paraphrase This Document
Need a fresh take? Get an instant paraphrase of this document with our AI Paraphraser
BIBLIOGRAPHY
http://financials.morningstar.com/income-statement/is.html?t=JD.®ion=gbr&culture=en-US
http://financials.morningstar.com/income-statement/is.html?t=SDISY®ion=usa&culture=en-
US
http://www.jdplc.com/investor-relations/reports.aspx
http://www.jdplc.com/~/media/Files/J/Jd-Sports-Fashion-Plc/reports-and-presentations/2017-
annual-report-and-accounts-v1.pdf
9
REFERENCES
Books and Journals
Biddle, G. C. and et.al., 2016. Do Adoptions of International Financial Reporting Standards
Enhance Capital Investment Efficiency?.
Bishop, C. C., DeZoort, F. T. and Hermanson, D. R., 2016. The Effect of CEO Social Influence
Pressure and CFO Accounting Experience on CFO Financial Reporting Decisions.
Auditing: A Journal of Practice & Theory. 36(1). pp.21-41.
Gaynor, L. M. And et.al., 2016. Understanding the relation between financial reporting quality
and audit quality. Auditing: A Journal of Practice & Theory. 35(4). pp.1-22.
Ge, W. and et.al., 2017. When does internal control over financial reporting curb resource
extraction? Evidence from China.
Jung, W. O., Park, S. O. and Chung, H., 2016. Debt financing and voluntary adoption of the
international financial reporting standards: Evidence from Korean unlisted firms. Emerging
Markets Finance and Trade. 52(1). pp.39-51.
Leuz, C. and Wysocki, P. D., 2016. The economics of disclosure and financial reporting
regulation: Evidence and suggestions for future research. Journal of Accounting Research.
54(2). pp.525-622.
Online
Financial statements business diagram management strategy chart illustration. 2017. [Online].
Available through :<https://www.123rf.com/photo_9373319_financial-statements-
business-diagram-management-strategy-chart-illustration.html>.
10
⊘ This is a preview!⊘
Do you want full access?
Subscribe today to unlock all pages.
Trusted by 1+ million students worldwide
1 out of 18
Related Documents


Your All-in-One AI-Powered Toolkit for Academic Success.
+13062052269
info@desklib.com
Available 24*7 on WhatsApp / Email
![[object Object]](/_next/static/media/star-bottom.7253800d.svg)
Unlock your academic potential
Copyright © 2020–2026 A2Z Services. All Rights Reserved. Developed and managed by ZUCOL.