Financial Report Appraisal: JD Sports and Sports Direct (289ACC)
VerifiedAdded on 2021/09/30
|16
|4208
|77
Report
AI Summary
This report provides a comprehensive financial analysis of JD Sports Fashion plc and Sports Direct International Plc, comparing their performance across various financial metrics. The report examines profitability ratios, including gross profit margin, operating profit margin, and net profit margin, as well as return on capital employed. Liquidity ratios such as current ratio and acid test ratio are analyzed to assess the companies' ability to meet short-term obligations. Efficiency ratios, including asset turnover, inventory days, and inventory turnover, are evaluated to determine how effectively the companies utilize their assets. Gearing ratios are used to assess the level of debt financing. The analysis also includes an investment appraisal, considering earnings per share and gross profit. The report concludes with recommendations for investment, limitations of the analysis, and a comparison of the two companies' solvency, investor ratios, and efficiency in use of assets.
JD Sports and Sports Direct Financial
Report Appraisal
289ACC. Group Assignment
Report Appraisal
289ACC. Group Assignment
Paraphrase This Document
Need a fresh take? Get an instant paraphrase of this document with our AI Paraphraser
289ACC- Accounting for Business
Table of Contents
1 Introduction 3
1.1 JD Sports Fashion plc 3
1.2 Sports Direct International Plc 3
2. JD Sports plc 3
2.1 Profitability Ratios 3
2.2 Liquidity 4
2.3 Efficiency 4
2.4 Gearing 5
2.5 Investment potential 5
2.2 Sports Direct plc 5
2.2.1 Profitability Ratios 5
2.2.2 Liquidity 6
2.2.3 Efficiency 6
2.2.4 Gearing 7
2.2.5 Investment Appraisal 7
3. Reappraisal of groups financial performance 8
3.1 Solvency / Gearing 8
3.2 Investor Ratios 8
3.3 Gross Profit 8
3.4 Selling, distribution and Administrative Expenses 9
3.5 Profitability 9
3.5.1 Operating profit margin 9
3.5.2 Return on Equity 9
3.5.3 Net Profit Margin 10
3.6 Liquidity 10
3.6.1 Current ratio 10
1
289ACC- Accounting for Business
3.6.2 Quick ratio / Acid Test Ratio 10
3.7 Efficiency in Use of the Assets 11
3.7.1 Inventory turnover 11
3.7.2 Inventory days 11
4. Recommendation for Investment 11
5. Limitations 13
Reference List 14
2
3.6.2 Quick ratio / Acid Test Ratio 10
3.7 Efficiency in Use of the Assets 11
3.7.1 Inventory turnover 11
3.7.2 Inventory days 11
4. Recommendation for Investment 11
5. Limitations 13
Reference List 14
2
⊘ This is a preview!⊘
Do you want full access?
Subscribe today to unlock all pages.
Trusted by 1+ million students worldwide
289ACC- Accounting for Business
1 Introduction
1.1 JD Sports Fashion plc
JD Sports is one of the leading retailers of sports, fashion and outdoor brands globally.
JD specialise in supplying high-quality products from well-known brands such as Nike,
Adidas, Puma and The North Face. Outside of the 402 stores, JD has in the UK and
Republic of Ireland they have a further 304 stores across Europe including countries
such as Spain, Germany, France, Italy etc. (JD Sports Fashion Stores By Brand 2020 |
Statista 2020) The revenue of the global sports apparel market is estimated to be
around £139.59 billion last year. (Total Revenue Of The Global Sports Apparel Market
2012-2025 | Statista 2020) Of this figure, JD had revenue totalling £4,717.8 million
which is around 3.3% of revenue in the whole market.
1.2 Sports Direct International Plc
Sports Direct is a major sports retailer founded in 1982, providing UK and European
consumers with the biggest brands at affordable prices online and in 540 stores. They
have diversified by acquiring House of Fraser in 2018 and having their premium lifestyle
group including concessions such as Flannels and Cruise in 2012, recently acquiring
Jacks wills and Game in 2019. Group revenue has increased by 10.2% from this, which
reported revenue totalled £3,957.4 FY20 which increased by 255.5 million pounds from
FY19. ( Sports Direct: sports retail revenue 2013-2020 | Statista 2020) which is around
2.8% of revenue in the whole market.
2. JD Sports plc
2.1 Profitability Ratios
Gross profit margin: JD Sports’ gross profit margin did not change between 2018 and
2019 it remained at 48%. This figure would be surprising to some as their gross profit
increased by £711.7M (an increase of 46.46%). It is likely that their gross profit margin
did not increase because their cost of sales increased at a larger rate. JD’s cost of sales
increased by 51.82% which is clearly a higher figure than the gross profit margin.
Operating profit margin: The operating profit margin decreased from 9% in 2018 to
7% in 2019. This suggests that JD has had increased operating costs which could be as
a result of the JD group acquiring Finish Line in the USA. (RETAIL Britain’S JD Sports Gets
Foot In US With $558 Million Finish Line Buy 2020)
3
Paraphrase This Document
Need a fresh take? Get an instant paraphrase of this document with our AI Paraphraser
289ACC- Accounting for Business
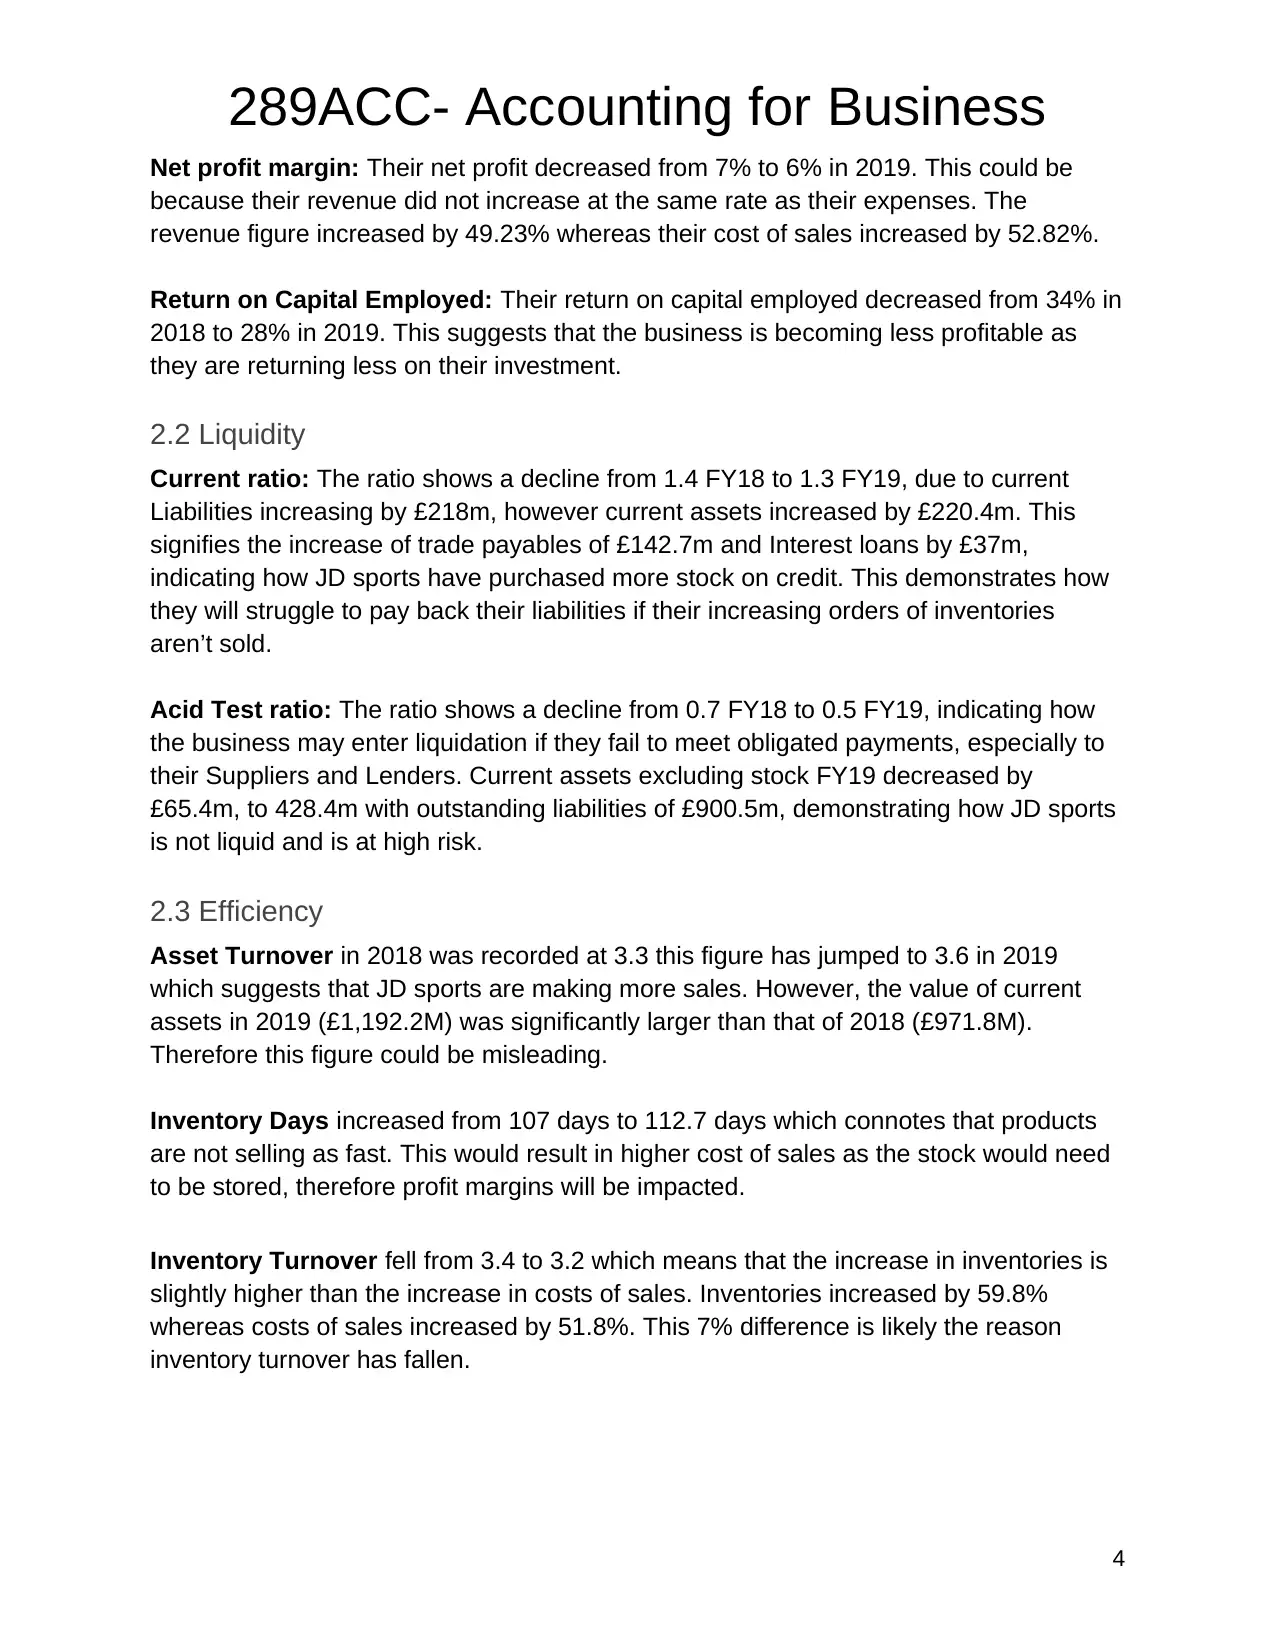
Net profit margin: Their net profit decreased from 7% to 6% in 2019. This could be
because their revenue did not increase at the same rate as their expenses. The
revenue figure increased by 49.23% whereas their cost of sales increased by 52.82%.
Return on Capital Employed: Their return on capital employed decreased from 34% in
2018 to 28% in 2019. This suggests that the business is becoming less profitable as
they are returning less on their investment.
2.2 Liquidity
Current ratio: The ratio shows a decline from 1.4 FY18 to 1.3 FY19, due to current
Liabilities increasing by £218m, however current assets increased by £220.4m. This
signifies the increase of trade payables of £142.7m and Interest loans by £37m,
indicating how JD sports have purchased more stock on credit. This demonstrates how
they will struggle to pay back their liabilities if their increasing orders of inventories
aren’t sold.
Acid Test ratio: The ratio shows a decline from 0.7 FY18 to 0.5 FY19, indicating how
the business may enter liquidation if they fail to meet obligated payments, especially to
their Suppliers and Lenders. Current assets excluding stock FY19 decreased by
£65.4m, to 428.4m with outstanding liabilities of £900.5m, demonstrating how JD sports
is not liquid and is at high risk.
2.3 Efficiency
Asset Turnover in 2018 was recorded at 3.3 this figure has jumped to 3.6 in 2019
which suggests that JD sports are making more sales. However, the value of current
assets in 2019 (£1,192.2M) was significantly larger than that of 2018 (£971.8M).
Therefore this figure could be misleading.
Inventory Days increased from 107 days to 112.7 days which connotes that products
are not selling as fast. This would result in higher cost of sales as the stock would need
to be stored, therefore profit margins will be impacted.
Inventory Turnover fell from 3.4 to 3.2 which means that the increase in inventories is
slightly higher than the increase in costs of sales. Inventories increased by 59.8%
whereas costs of sales increased by 51.8%. This 7% difference is likely the reason
inventory turnover has fallen.
4
289ACC- Accounting for Business
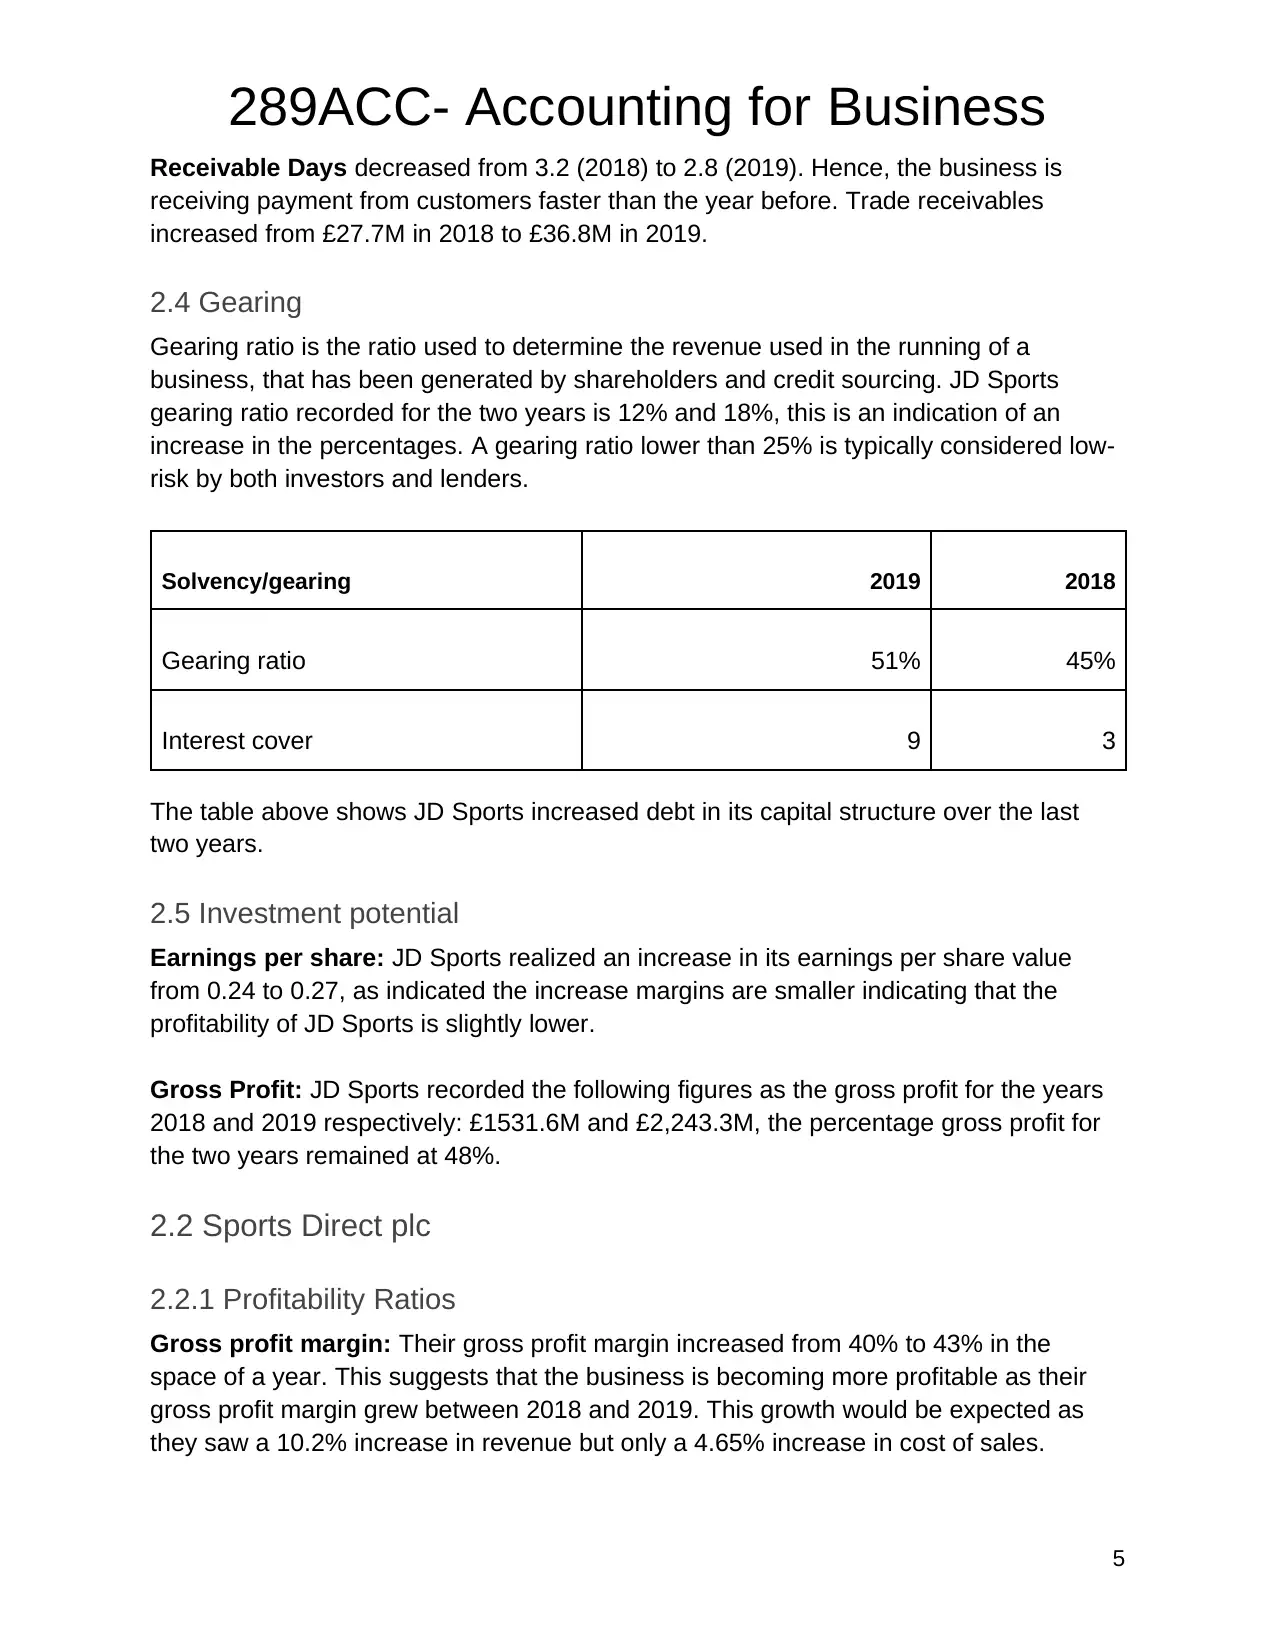
Receivable Days decreased from 3.2 (2018) to 2.8 (2019). Hence, the business is
receiving payment from customers faster than the year before. Trade receivables
increased from £27.7M in 2018 to £36.8M in 2019.
2.4 Gearing
Gearing ratio is the ratio used to determine the revenue used in the running of a
business, that has been generated by shareholders and credit sourcing. JD Sports
gearing ratio recorded for the two years is 12% and 18%, this is an indication of an
increase in the percentages. A gearing ratio lower than 25% is typically considered low-
risk by both investors and lenders.
Solvency/gearing 2019 2018
Gearing ratio 51% 45%
Interest cover 9 3
The table above shows JD Sports increased debt in its capital structure over the last
two years.
2.5 Investment potential
Earnings per share: JD Sports realized an increase in its earnings per share value
from 0.24 to 0.27, as indicated the increase margins are smaller indicating that the
profitability of JD Sports is slightly lower.
Gross Profit: JD Sports recorded the following figures as the gross profit for the years
2018 and 2019 respectively: £1531.6M and £2,243.3M, the percentage gross profit for
the two years remained at 48%.
2.2 Sports Direct plc
2.2.1 Profitability Ratios
Gross profit margin: Their gross profit margin increased from 40% to 43% in the
space of a year. This suggests that the business is becoming more profitable as their
gross profit margin grew between 2018 and 2019. This growth would be expected as
they saw a 10.2% increase in revenue but only a 4.65% increase in cost of sales.
5
⊘ This is a preview!⊘
Do you want full access?
Subscribe today to unlock all pages.
Trusted by 1+ million students worldwide
289ACC- Accounting for Business
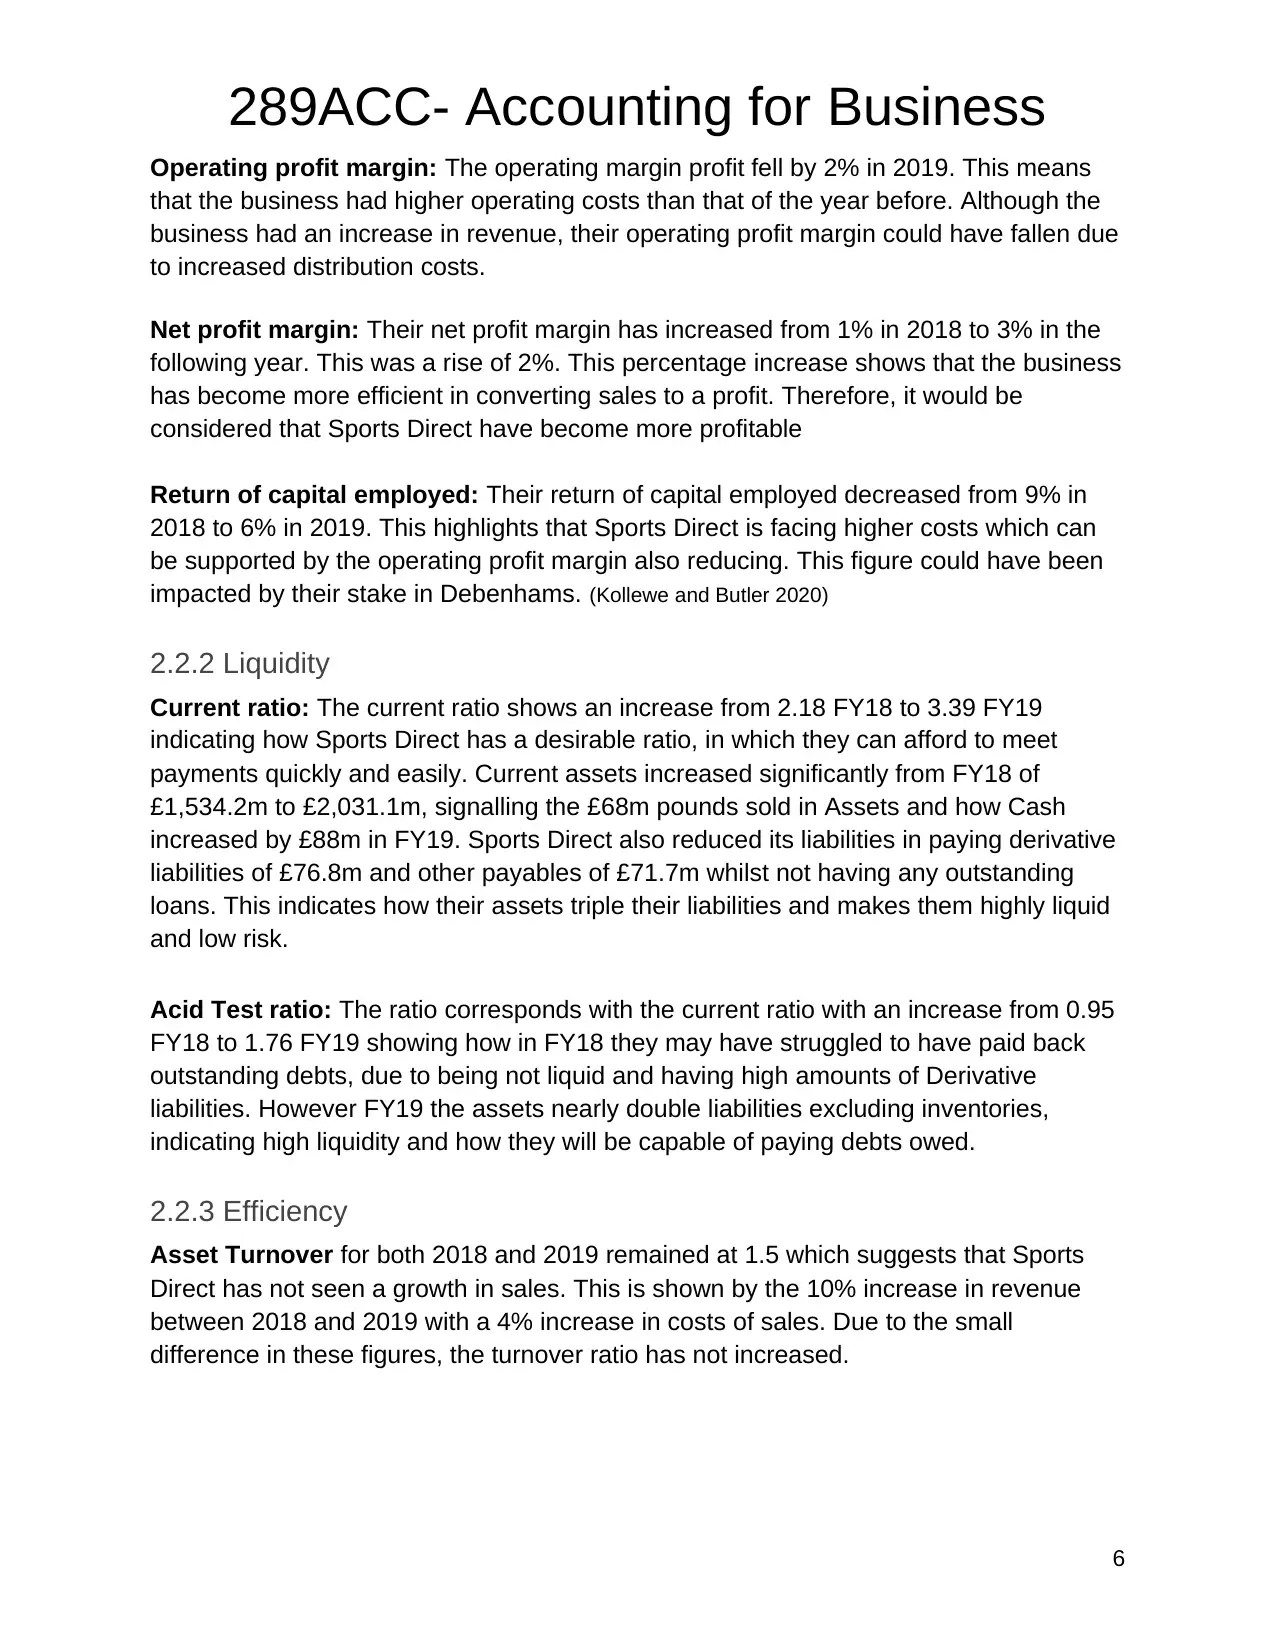
Operating profit margin: The operating margin profit fell by 2% in 2019. This means
that the business had higher operating costs than that of the year before. Although the
business had an increase in revenue, their operating profit margin could have fallen due
to increased distribution costs.
Net profit margin: Their net profit margin has increased from 1% in 2018 to 3% in the
following year. This was a rise of 2%. This percentage increase shows that the business
has become more efficient in converting sales to a profit. Therefore, it would be
considered that Sports Direct have become more profitable
Return of capital employed: Their return of capital employed decreased from 9% in
2018 to 6% in 2019. This highlights that Sports Direct is facing higher costs which can
be supported by the operating profit margin also reducing. This figure could have been
impacted by their stake in Debenhams. (Kollewe and Butler 2020)
2.2.2 Liquidity
Current ratio: The current ratio shows an increase from 2.18 FY18 to 3.39 FY19
indicating how Sports Direct has a desirable ratio, in which they can afford to meet
payments quickly and easily. Current assets increased significantly from FY18 of
£1,534.2m to £2,031.1m, signalling the £68m pounds sold in Assets and how Cash
increased by £88m in FY19. Sports Direct also reduced its liabilities in paying derivative
liabilities of £76.8m and other payables of £71.7m whilst not having any outstanding
loans. This indicates how their assets triple their liabilities and makes them highly liquid
and low risk.
Acid Test ratio: The ratio corresponds with the current ratio with an increase from 0.95
FY18 to 1.76 FY19 showing how in FY18 they may have struggled to have paid back
outstanding debts, due to being not liquid and having high amounts of Derivative
liabilities. However FY19 the assets nearly double liabilities excluding inventories,
indicating high liquidity and how they will be capable of paying debts owed.
2.2.3 Efficiency
Asset Turnover for both 2018 and 2019 remained at 1.5 which suggests that Sports
Direct has not seen a growth in sales. This is shown by the 10% increase in revenue
between 2018 and 2019 with a 4% increase in costs of sales. Due to the small
difference in these figures, the turnover ratio has not increased.
6
Paraphrase This Document
Need a fresh take? Get an instant paraphrase of this document with our AI Paraphraser
289ACC- Accounting for Business
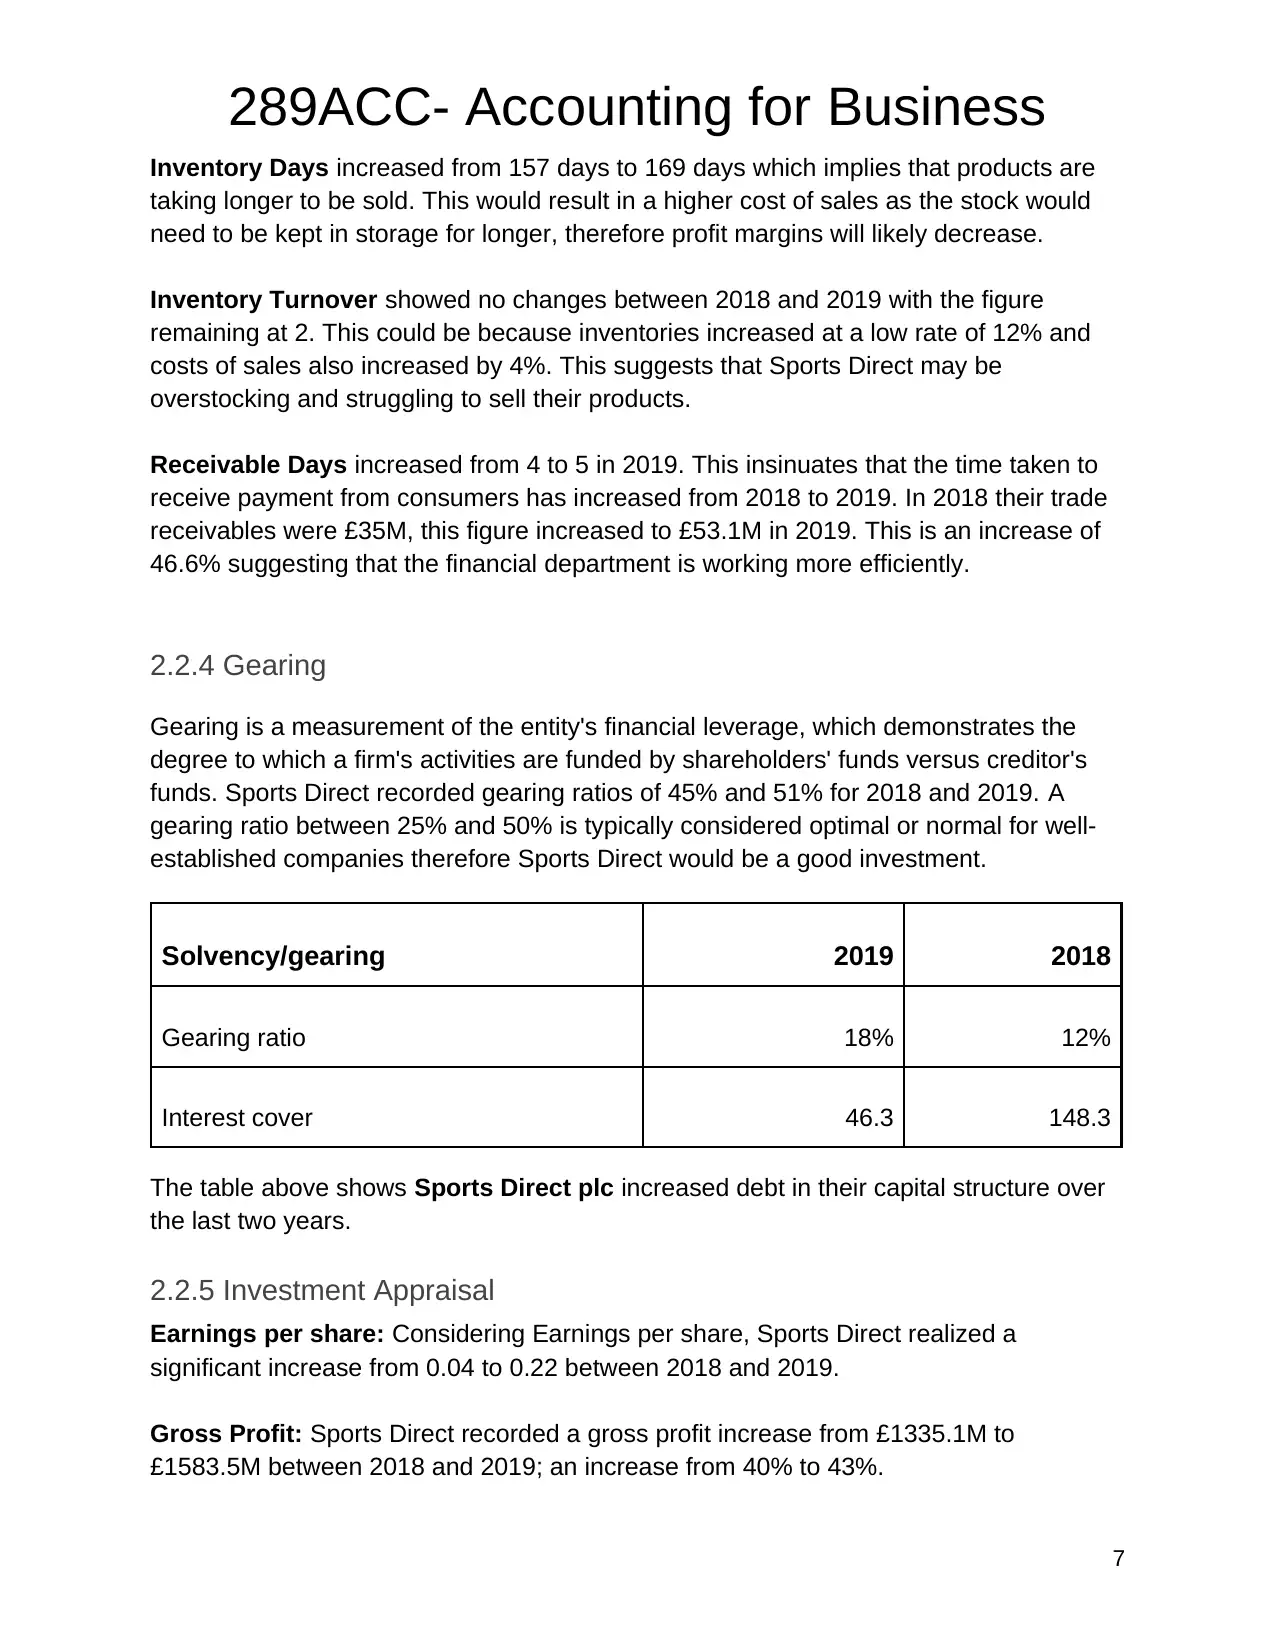
Inventory Days increased from 157 days to 169 days which implies that products are
taking longer to be sold. This would result in a higher cost of sales as the stock would
need to be kept in storage for longer, therefore profit margins will likely decrease.
Inventory Turnover showed no changes between 2018 and 2019 with the figure
remaining at 2. This could be because inventories increased at a low rate of 12% and
costs of sales also increased by 4%. This suggests that Sports Direct may be
overstocking and struggling to sell their products.
Receivable Days increased from 4 to 5 in 2019. This insinuates that the time taken to
receive payment from consumers has increased from 2018 to 2019. In 2018 their trade
receivables were £35M, this figure increased to £53.1M in 2019. This is an increase of
46.6% suggesting that the financial department is working more efficiently.
2.2.4 Gearing
Gearing is a measurement of the entity's financial leverage, which demonstrates the
degree to which a firm's activities are funded by shareholders' funds versus creditor's
funds. Sports Direct recorded gearing ratios of 45% and 51% for 2018 and 2019. A
gearing ratio between 25% and 50% is typically considered optimal or normal for well-
established companies therefore Sports Direct would be a good investment.
Solvency/gearing 2019 2018
Gearing ratio 18% 12%
Interest cover 46.3 148.3
The table above shows Sports Direct plc increased debt in their capital structure over
the last two years.
2.2.5 Investment Appraisal
Earnings per share: Considering Earnings per share, Sports Direct realized a
significant increase from 0.04 to 0.22 between 2018 and 2019.
Gross Profit: Sports Direct recorded a gross profit increase from £1335.1M to
£1583.5M between 2018 and 2019; an increase from 40% to 43%.
7
289ACC- Accounting for Business
3. Reappraisal of groups financial performance
3.1 Solvency / Gearing
Sports Direct plc recorded gearing ratios of 45% and 51% for the years 2018 and 2019.
On the other hand, JD Sports gearing ratio recorded for the two years is 12% and 18%,
this is an indication of an increase in the percentages.
3.2 Investor Ratios
Earnings per share is the net profit a business realizes from the individual shares of
their stock. Sports Direct’s earnings per share was 0.04 in the year 2018, the figure
increased to 0.22 in the year 2019 which is an indication that their stock had gained
value over the period. JD Sports recorded earnings of 0.24 and 0.27 in the two years,
the figures indicate an increase which means the business is doing well.
Price earnings ratios is the ratio between a business’s share price and its revenue per
share. The ratio is used in the understanding of how profitable a business is based on
the price and the revenue at which their shares retail. Sports Direct registered price
earnings ratios were 92.32 and 13.62 for the years 2018 and 2019 respectively. On the
other hand, JD Sports is reported to have registered 18.8 and 30.3 in the years 2018
and 2019. Both of the companies have indicated an increase in the price earnings ratio
over the two years, only Sports Direct increased with a significant margin.
3.3 Gross Profit
Gross Profit is the profit realized by a business after the revenue collected has been
deducted of all expenses involved in its operation. Sports Direct registered an increase
in the gross profit between the year 2018 and 2019 from £1335.1M to £1583.5M which
had a corresponding increase from 40% to 43%. JD Sports is known to have recorded a
constant percentage in gross profit of 48% in the years 2018 and 2019.
8
⊘ This is a preview!⊘
Do you want full access?
Subscribe today to unlock all pages.
Trusted by 1+ million students worldwide
289ACC- Accounting for Business
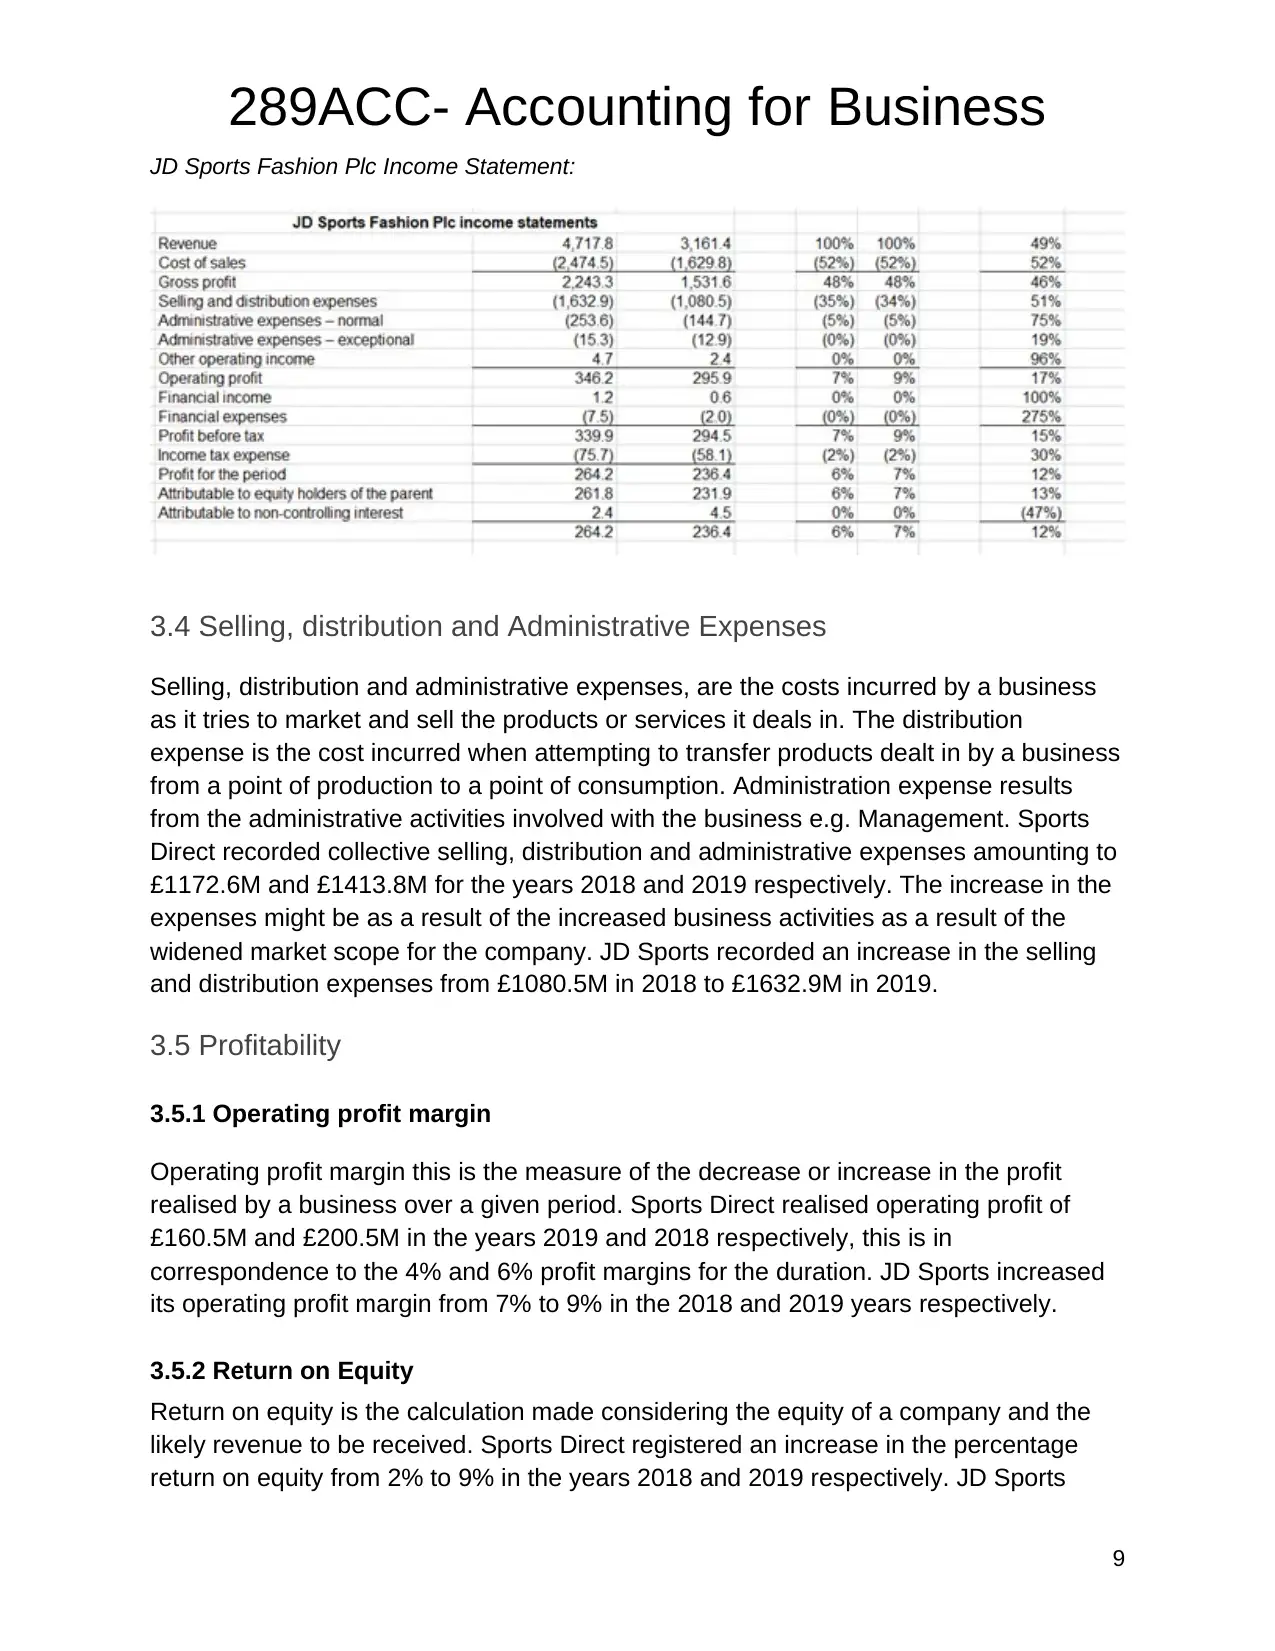
JD Sports Fashion Plc Income Statement:
3.4 Selling, distribution and Administrative Expenses
Selling, distribution and administrative expenses, are the costs incurred by a business
as it tries to market and sell the products or services it deals in. The distribution
expense is the cost incurred when attempting to transfer products dealt in by a business
from a point of production to a point of consumption. Administration expense results
from the administrative activities involved with the business e.g. Management. Sports
Direct recorded collective selling, distribution and administrative expenses amounting to
£1172.6M and £1413.8M for the years 2018 and 2019 respectively. The increase in the
expenses might be as a result of the increased business activities as a result of the
widened market scope for the company. JD Sports recorded an increase in the selling
and distribution expenses from £1080.5M in 2018 to £1632.9M in 2019.
3.5 Profitability
3.5.1 Operating profit margin
Operating profit margin this is the measure of the decrease or increase in the profit
realised by a business over a given period. Sports Direct realised operating profit of
£160.5M and £200.5M in the years 2019 and 2018 respectively, this is in
correspondence to the 4% and 6% profit margins for the duration. JD Sports increased
its operating profit margin from 7% to 9% in the 2018 and 2019 years respectively.
3.5.2 Return on Equity
Return on equity is the calculation made considering the equity of a company and the
likely revenue to be received. Sports Direct registered an increase in the percentage
return on equity from 2% to 9% in the years 2018 and 2019 respectively. JD Sports
9
Paraphrase This Document
Need a fresh take? Get an instant paraphrase of this document with our AI Paraphraser
289ACC- Accounting for Business
registered a decrease in the return on equity in the years 2018 and 2019 from 28% to
25%.
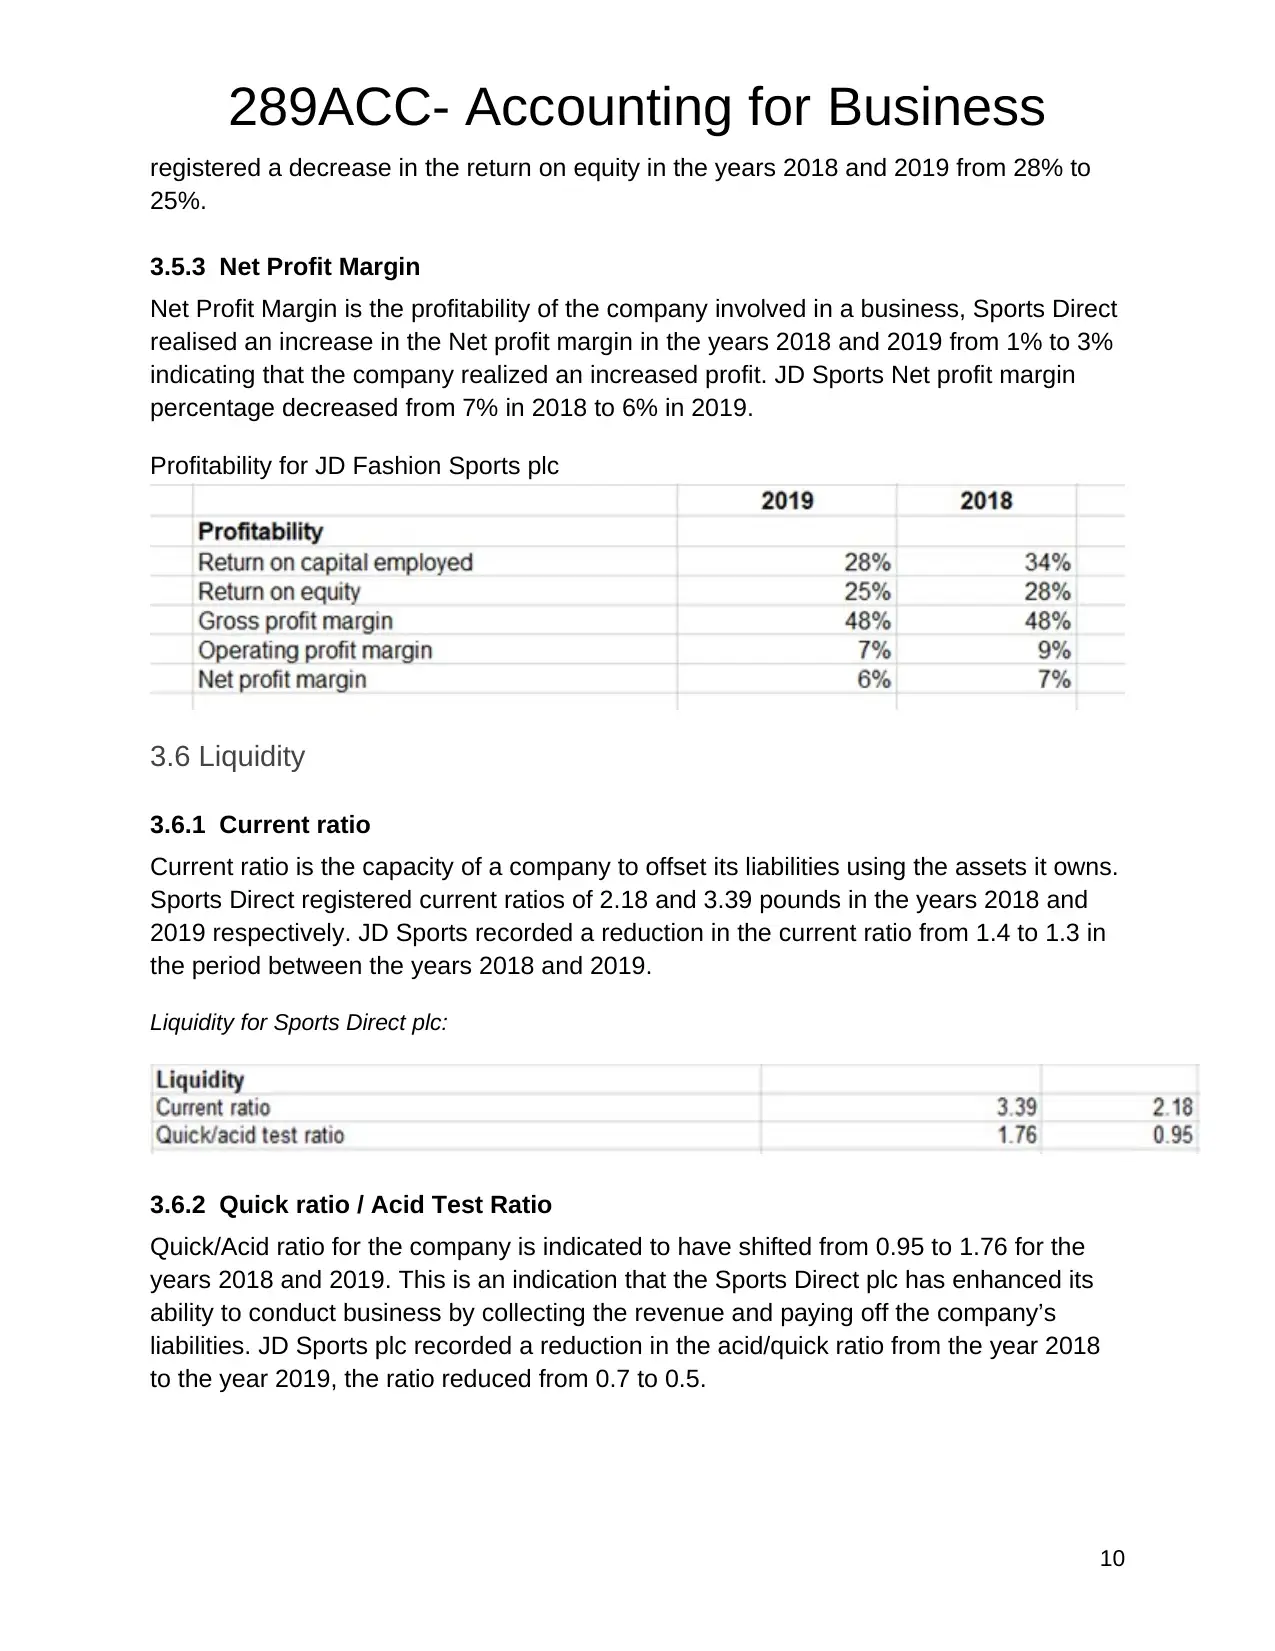
3.5.3 Net Profit Margin
Net Profit Margin is the profitability of the company involved in a business, Sports Direct
realised an increase in the Net profit margin in the years 2018 and 2019 from 1% to 3%
indicating that the company realized an increased profit. JD Sports Net profit margin
percentage decreased from 7% in 2018 to 6% in 2019.
Profitability for JD Fashion Sports plc
3.6 Liquidity
3.6.1 Current ratio
Current ratio is the capacity of a company to offset its liabilities using the assets it owns.
Sports Direct registered current ratios of 2.18 and 3.39 pounds in the years 2018 and
2019 respectively. JD Sports recorded a reduction in the current ratio from 1.4 to 1.3 in
the period between the years 2018 and 2019.
Liquidity for Sports Direct plc:
3.6.2 Quick ratio / Acid Test Ratio
Quick/Acid ratio for the company is indicated to have shifted from 0.95 to 1.76 for the
years 2018 and 2019. This is an indication that the Sports Direct plc has enhanced its
ability to conduct business by collecting the revenue and paying off the company’s
liabilities. JD Sports plc recorded a reduction in the acid/quick ratio from the year 2018
to the year 2019, the ratio reduced from 0.7 to 0.5.
10
registered a decrease in the return on equity in the years 2018 and 2019 from 28% to
25%.
3.5.3 Net Profit Margin
Net Profit Margin is the profitability of the company involved in a business, Sports Direct
realised an increase in the Net profit margin in the years 2018 and 2019 from 1% to 3%
indicating that the company realized an increased profit. JD Sports Net profit margin
percentage decreased from 7% in 2018 to 6% in 2019.
Profitability for JD Fashion Sports plc
3.6 Liquidity
3.6.1 Current ratio
Current ratio is the capacity of a company to offset its liabilities using the assets it owns.
Sports Direct registered current ratios of 2.18 and 3.39 pounds in the years 2018 and
2019 respectively. JD Sports recorded a reduction in the current ratio from 1.4 to 1.3 in
the period between the years 2018 and 2019.
Liquidity for Sports Direct plc:
3.6.2 Quick ratio / Acid Test Ratio
Quick/Acid ratio for the company is indicated to have shifted from 0.95 to 1.76 for the
years 2018 and 2019. This is an indication that the Sports Direct plc has enhanced its
ability to conduct business by collecting the revenue and paying off the company’s
liabilities. JD Sports plc recorded a reduction in the acid/quick ratio from the year 2018
to the year 2019, the ratio reduced from 0.7 to 0.5.
10
289ACC- Accounting for Business
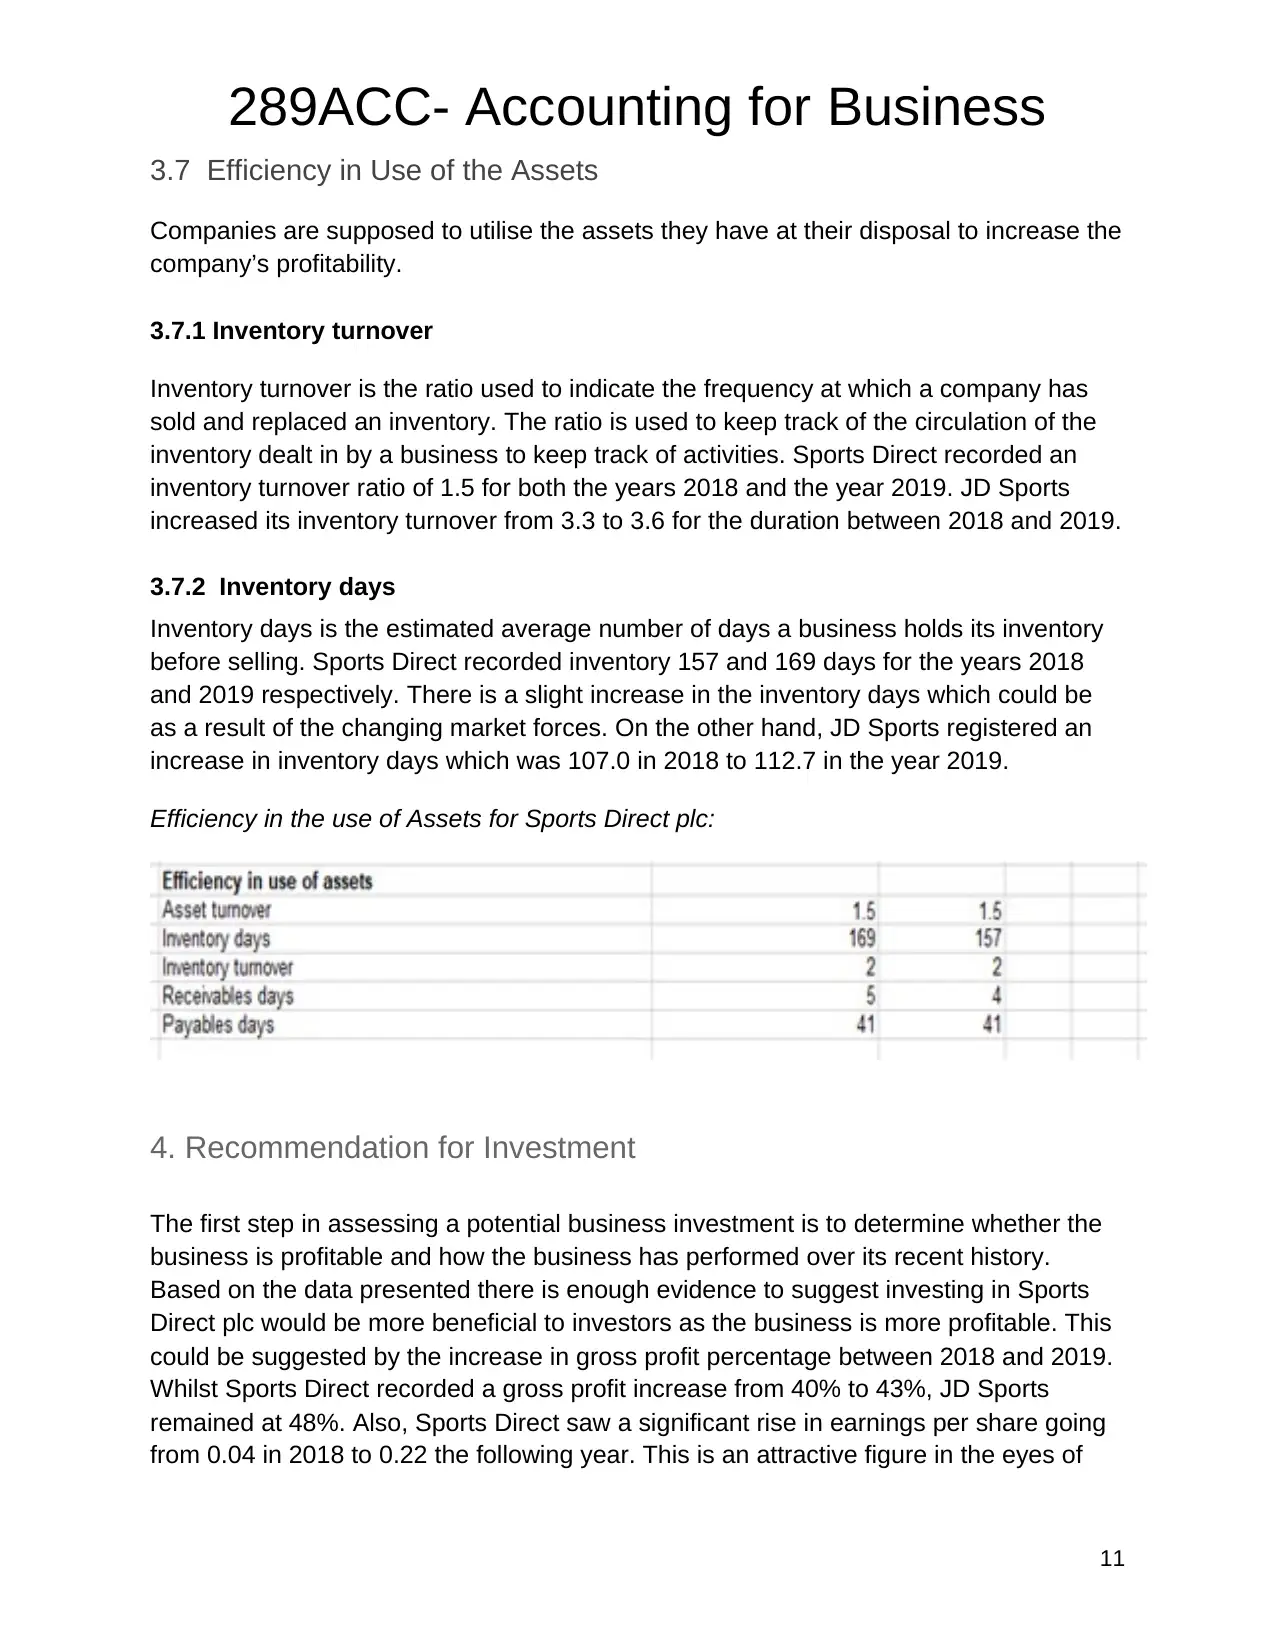
3.7 Efficiency in Use of the Assets
Companies are supposed to utilise the assets they have at their disposal to increase the
company’s profitability.
3.7.1 Inventory turnover
Inventory turnover is the ratio used to indicate the frequency at which a company has
sold and replaced an inventory. The ratio is used to keep track of the circulation of the
inventory dealt in by a business to keep track of activities. Sports Direct recorded an
inventory turnover ratio of 1.5 for both the years 2018 and the year 2019. JD Sports
increased its inventory turnover from 3.3 to 3.6 for the duration between 2018 and 2019.
3.7.2 Inventory days
Inventory days is the estimated average number of days a business holds its inventory
before selling. Sports Direct recorded inventory 157 and 169 days for the years 2018
and 2019 respectively. There is a slight increase in the inventory days which could be
as a result of the changing market forces. On the other hand, JD Sports registered an
increase in inventory days which was 107.0 in 2018 to 112.7 in the year 2019.
Efficiency in the use of Assets for Sports Direct plc:
4. Recommendation for Investment
The first step in assessing a potential business investment is to determine whether the
business is profitable and how the business has performed over its recent history.
Based on the data presented there is enough evidence to suggest investing in Sports
Direct plc would be more beneficial to investors as the business is more profitable. This
could be suggested by the increase in gross profit percentage between 2018 and 2019.
Whilst Sports Direct recorded a gross profit increase from 40% to 43%, JD Sports
remained at 48%. Also, Sports Direct saw a significant rise in earnings per share going
from 0.04 in 2018 to 0.22 the following year. This is an attractive figure in the eyes of
11
⊘ This is a preview!⊘
Do you want full access?
Subscribe today to unlock all pages.
Trusted by 1+ million students worldwide
1 out of 16
Related Documents


Your All-in-One AI-Powered Toolkit for Academic Success.
+13062052269
info@desklib.com
Available 24*7 on WhatsApp / Email
![[object Object]](/_next/static/media/star-bottom.7253800d.svg)
Unlock your academic potential
Copyright © 2020–2026 A2Z Services. All Rights Reserved. Developed and managed by ZUCOL.