Financial Analysis: Management Accounting Report for Jeffrey and Son's
VerifiedAdded on 2020/02/05
|23
|5849
|40
Report
AI Summary
This report provides a comprehensive analysis of management accounting principles applied to a case study of Jeffrey and Son's, a company that manufactures the Exquisite brand products. The report begins with an introduction to management accounting and its importance, followed by an analysis of cost classification, including direct and indirect costs, and cost behavior. It then delves into the calculation of unit costs and total job costs, along with an explanation of absorption costing techniques. The report also covers the preparation and analysis of cost reports, the use of performance indicators for identifying areas for improvement, and strategies for cost reduction and value enhancement. Furthermore, it examines the budgeting process, including different budgeting methods and the preparation of various budgets, such as production and cash budgets. The report concludes with a discussion of variance calculations, reconciliation statements, and findings presented to management, providing insights into the company's financial performance and areas for potential improvement.

Management Accounting
Paraphrase This Document
Need a fresh take? Get an instant paraphrase of this document with our AI Paraphraser

TABLE OF CONTENTS
INTRODUCTION...........................................................................................................................3
TASK 1............................................................................................................................................3
1.1 Different types of cost classification......................................................................................3
1.2 Calculating unit cost and total job cost..................................................................................4
1.3 Calculating cost of Exquisite using absorption costing technique ........................................4
1.4 Analyzing cost of Exquisite...................................................................................................8
TASK 2 ...........................................................................................................................................8
2.1 Preparing and analyzing cost report for the month of September ........................................8
2.2 Using performance indicators to identify areas for potential improvement........................10
2.3 Ways to reduce cost and enhance value, quality..................................................................10
TASK 3 .........................................................................................................................................11
3.1 Purpose and nature of budgeting process.............................................................................11
3.2 Selecting appropriate budgeting methods for organization.................................................11
3.3 Preparation of different types of budget..............................................................................12
3.4 Preparation of cash budget ..................................................................................................13
TASK 4 .........................................................................................................................................17
4.1 Calculation of variance .......................................................................................................17
4.2 Preparation of reconciliation operating statement .............................................................18
4.3 Findings to management in accordance with identified responsibility centers...................19
CONCLUSION..............................................................................................................................20
REFERENCES..............................................................................................................................21
2
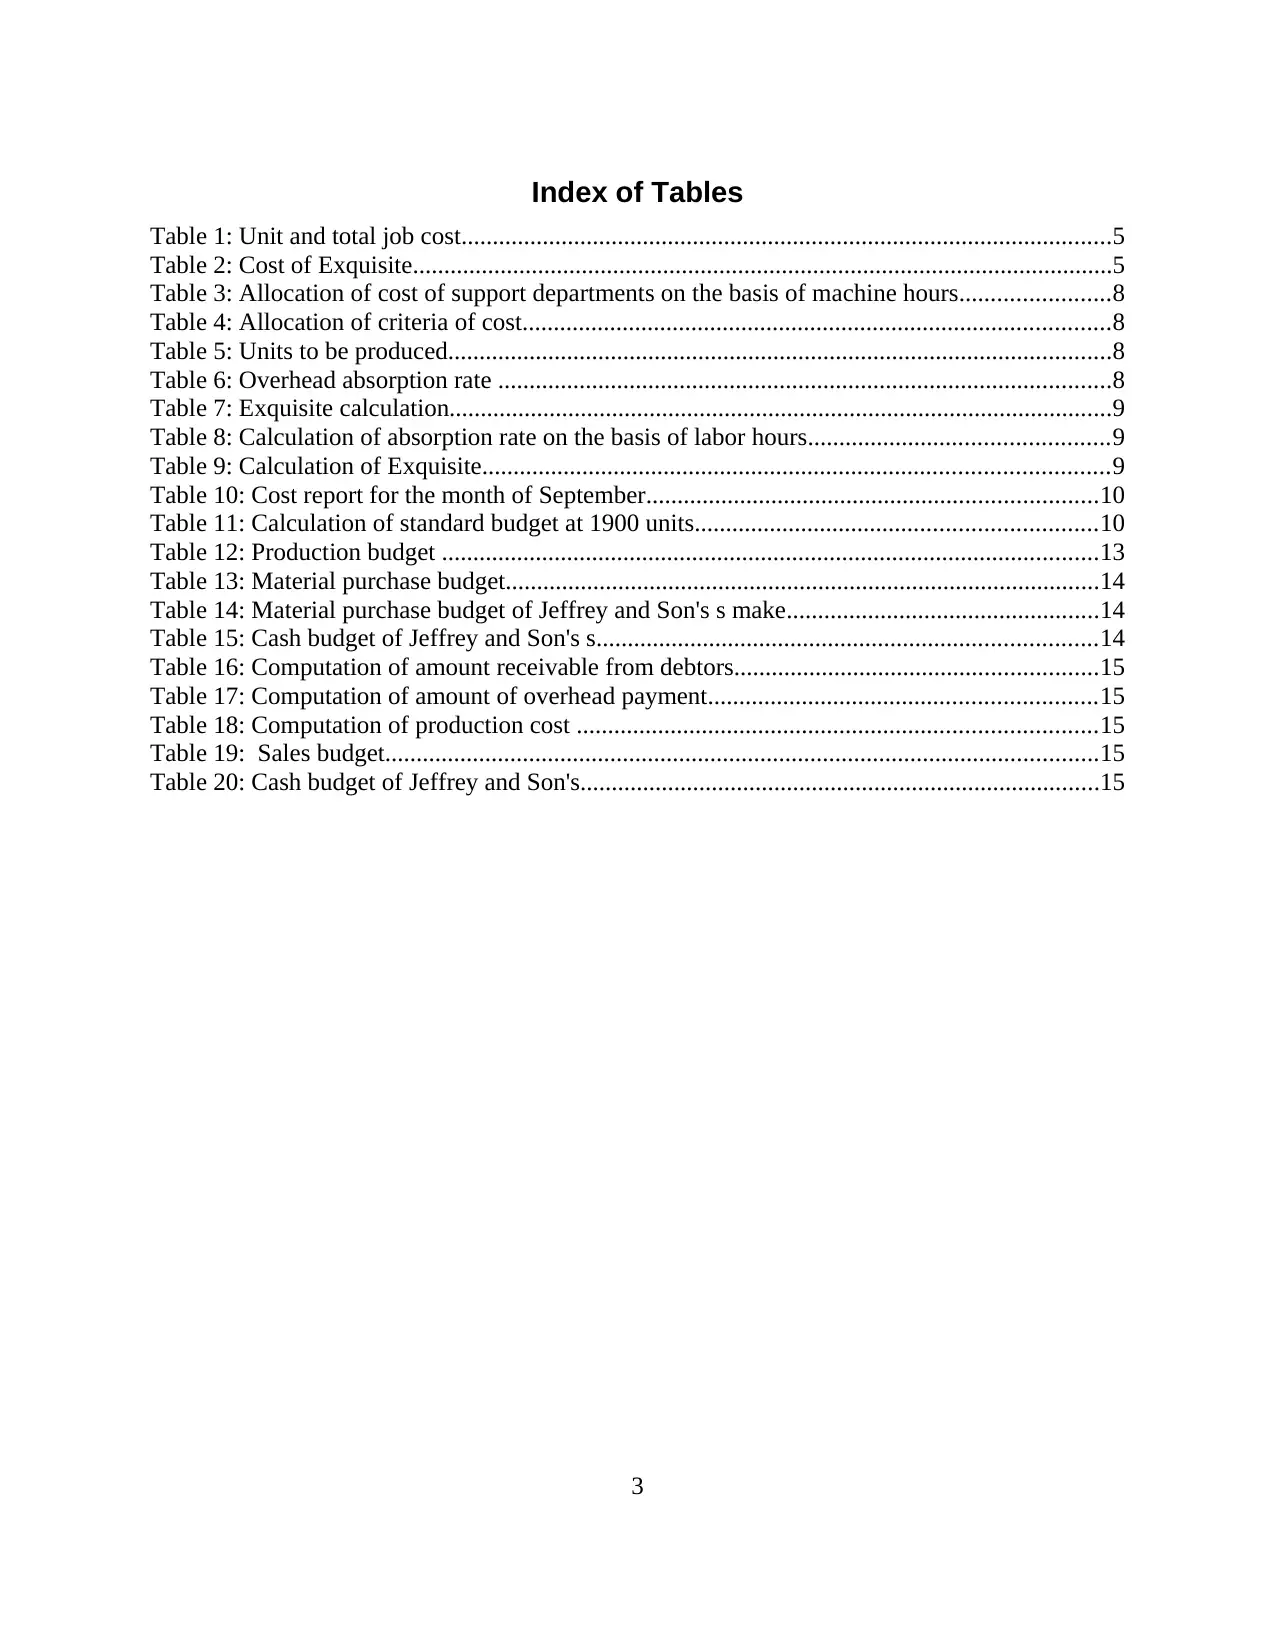
Index of Tables
Table 1: Unit and total job cost........................................................................................................5
Table 2: Cost of Exquisite................................................................................................................5
Table 3: Allocation of cost of support departments on the basis of machine hours........................8
Table 4: Allocation of criteria of cost..............................................................................................8
Table 5: Units to be produced..........................................................................................................8
Table 6: Overhead absorption rate ..................................................................................................8
Table 7: Exquisite calculation..........................................................................................................9
Table 8: Calculation of absorption rate on the basis of labor hours................................................9
Table 9: Calculation of Exquisite....................................................................................................9
Table 10: Cost report for the month of September........................................................................10
Table 11: Calculation of standard budget at 1900 units................................................................10
Table 12: Production budget .........................................................................................................13
Table 13: Material purchase budget...............................................................................................14
Table 14: Material purchase budget of Jeffrey and Son's s make..................................................14
Table 15: Cash budget of Jeffrey and Son's s................................................................................14
Table 16: Computation of amount receivable from debtors..........................................................15
Table 17: Computation of amount of overhead payment..............................................................15
Table 18: Computation of production cost ...................................................................................15
Table 19: Sales budget..................................................................................................................15
Table 20: Cash budget of Jeffrey and Son's...................................................................................15
3
⊘ This is a preview!⊘
Do you want full access?
Subscribe today to unlock all pages.
Trusted by 1+ million students worldwide
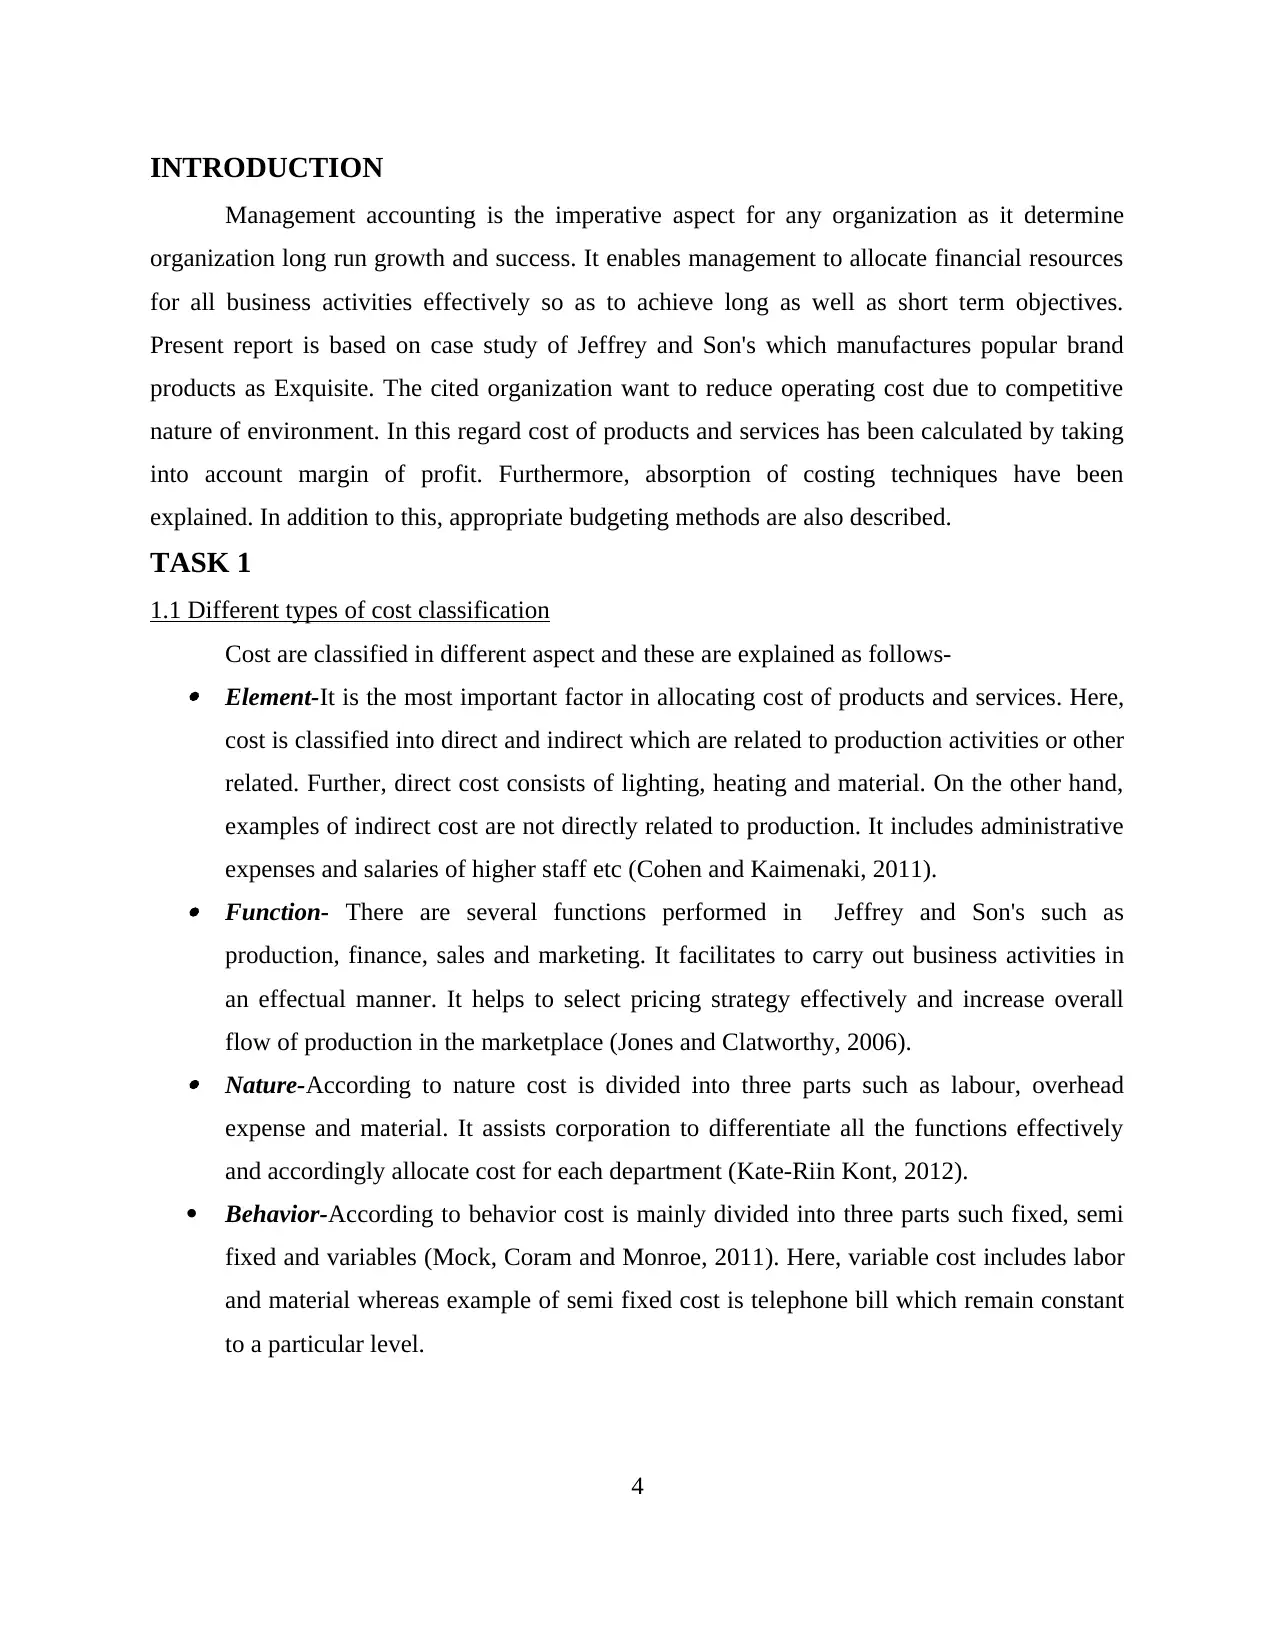
INTRODUCTION
Management accounting is the imperative aspect for any organization as it determine
organization long run growth and success. It enables management to allocate financial resources
for all business activities effectively so as to achieve long as well as short term objectives.
Present report is based on case study of Jeffrey and Son's which manufactures popular brand
products as Exquisite. The cited organization want to reduce operating cost due to competitive
nature of environment. In this regard cost of products and services has been calculated by taking
into account margin of profit. Furthermore, absorption of costing techniques have been
explained. In addition to this, appropriate budgeting methods are also described.
TASK 1
1.1 Different types of cost classification
Cost are classified in different aspect and these are explained as follows- Element-It is the most important factor in allocating cost of products and services. Here,
cost is classified into direct and indirect which are related to production activities or other
related. Further, direct cost consists of lighting, heating and material. On the other hand,
examples of indirect cost are not directly related to production. It includes administrative
expenses and salaries of higher staff etc (Cohen and Kaimenaki, 2011). Function- There are several functions performed in Jeffrey and Son's such as
production, finance, sales and marketing. It facilitates to carry out business activities in
an effectual manner. It helps to select pricing strategy effectively and increase overall
flow of production in the marketplace (Jones and Clatworthy, 2006). Nature-According to nature cost is divided into three parts such as labour, overhead
expense and material. It assists corporation to differentiate all the functions effectively
and accordingly allocate cost for each department (Kate-Riin Kont, 2012).
Behavior-According to behavior cost is mainly divided into three parts such fixed, semi
fixed and variables (Mock, Coram and Monroe, 2011). Here, variable cost includes labor
and material whereas example of semi fixed cost is telephone bill which remain constant
to a particular level.
4
Paraphrase This Document
Need a fresh take? Get an instant paraphrase of this document with our AI Paraphraser
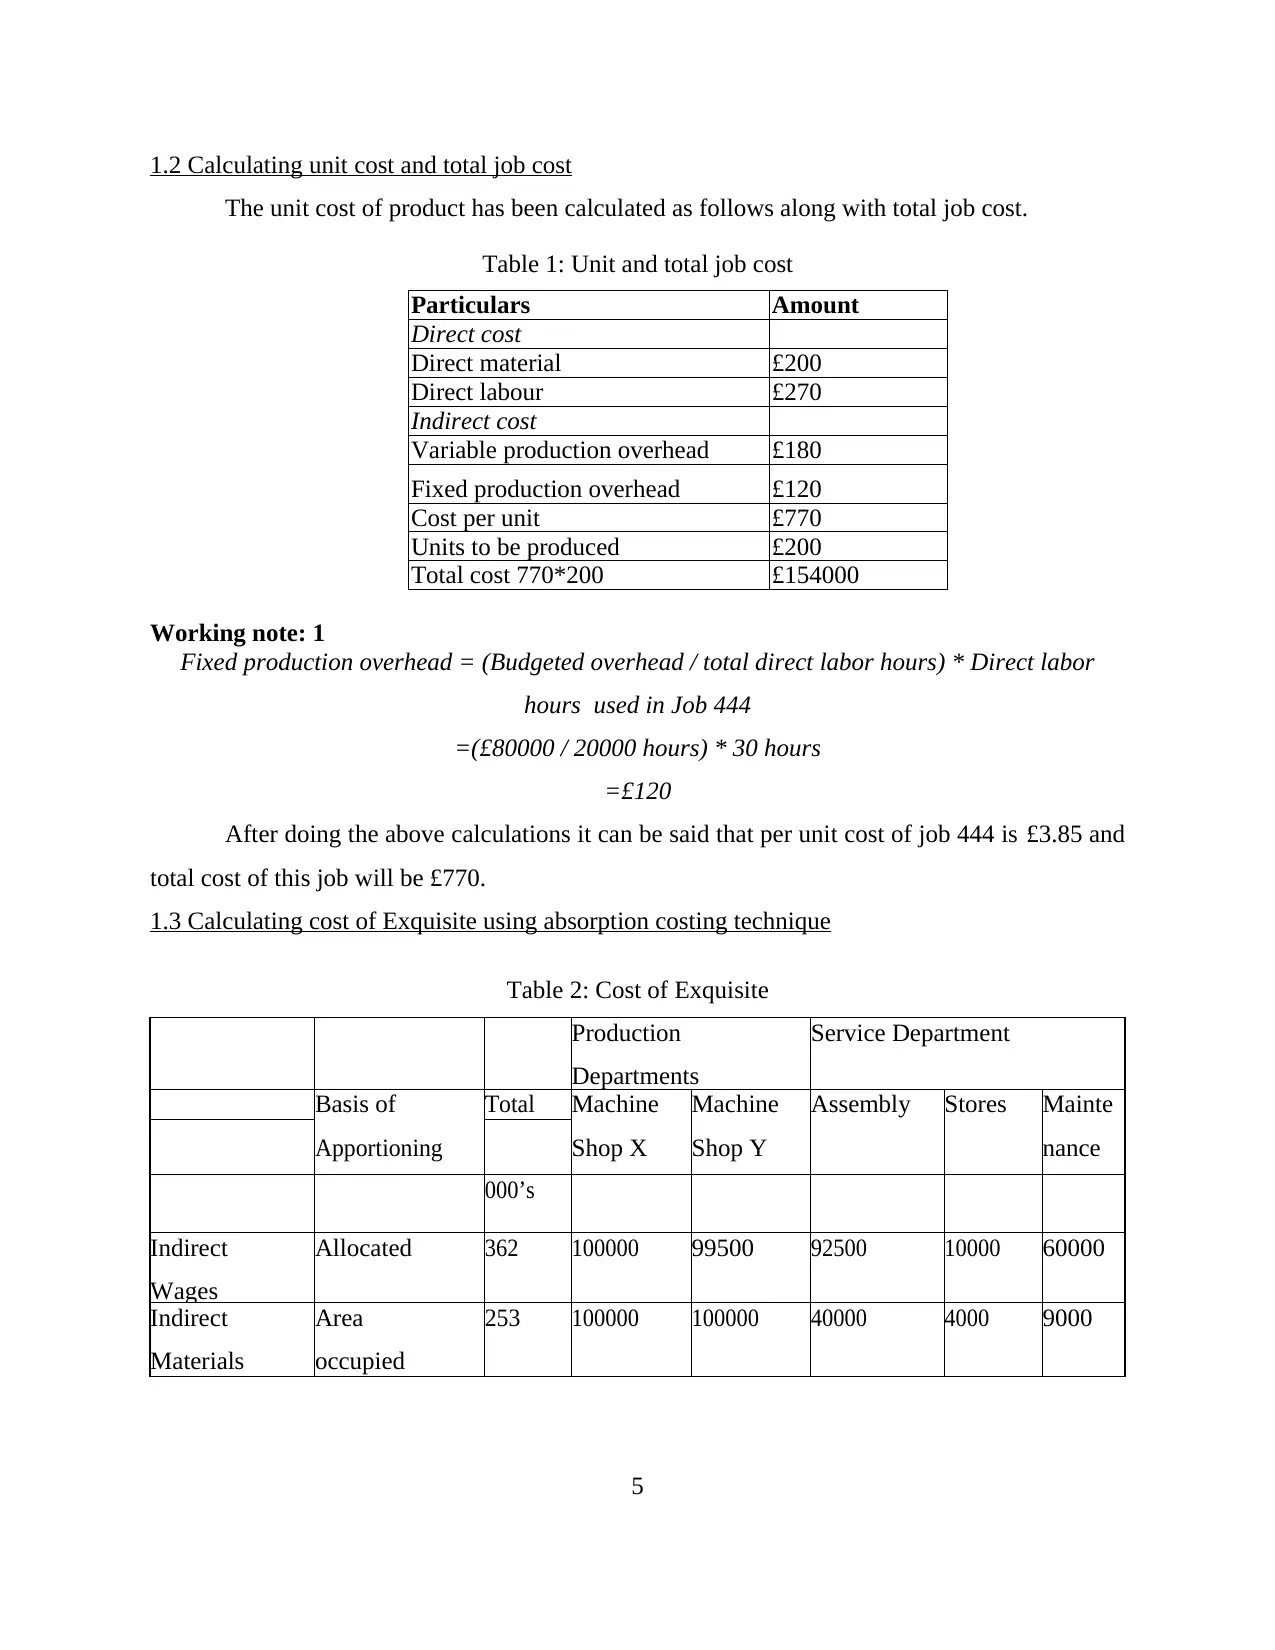
1.2 Calculating unit cost and total job cost
The unit cost of product has been calculated as follows along with total job cost.
Table 1: Unit and total job cost
Particulars Amount
Direct cost
Direct material £200
Direct labour £270
Indirect cost
Variable production overhead £180
Fixed production overhead £120
Cost per unit £770
Units to be produced £200
Total cost 770*200 £154000
Working note: 1
Fixed production overhead = (Budgeted overhead / total direct labor hours) * Direct labor
hours used in Job 444
=(£80000 / 20000 hours) * 30 hours
=£120
After doing the above calculations it can be said that per unit cost of job 444 is £3.85 and
total cost of this job will be £770.
1.3 Calculating cost of Exquisite using absorption costing technique
Table 2: Cost of Exquisite
Production
Departments
Service Department
Basis of
Apportioning
Total Machine
Shop X
Machine
Shop Y
Assembly Stores Mainte
nance
000’s
Indirect
Wages
Allocated 362 100000 99500 92500 10000 60000
Indirect
Materials
Area
occupied
253 100000 100000 40000 4000 9000
5

Lighting
Heating
& Area
Occupied
50 10000 5000 15000 15000 5000
Rent Area
Occupied
100 20000 10000 30000 30000 10000
Insurance &
Machinery
Book value
of Machinery
15 7947 4967 993 497 596
Depreciation
of Machinery
Book value
of Machinery
150 79470 49669 9934 4967 5960
Insurance of
Building
Area
Occupied
25 5000 2500 7500
7500
2500
Salaries
Works
of No.
employees
of 80 24000 16000 24000 8000 8000
Sub Totals 1035 346417 287636 219927 79964 101056
Re-
of service
dept. cost
Stores Dept. 39982 29987 9995 (79964)
Maintenance 48507 32338 20211 (101056
Totals 434906 349961 250133 0 0
Working Note
Lighting & Heating: Machinery X 10/50 x £50000 — f10000
Machinery Y 5/50 x £50000 — £5000
Assembly 15/50 x £50000 — f 15000
Stores 15/50 x £50000 = £15000
Maintenance 5/50 x £50000 = £15000
Rent Machinery X 10/50 x £100000 = f20000
Machinery Y 5/50 x £100000 = £10000
Assembly 15/50 x £100000 = £30000 Stores
6
⊘ This is a preview!⊘
Do you want full access?
Subscribe today to unlock all pages.
Trusted by 1+ million students worldwide

15/50 x £100000= £30000 Maintenance 5/50
x £100000 = £10000
Insurance & Machinery Machinery X 800/1510 x £15000 = £7964
Machinery Y 500/1510 x £15000 — £4966
Assembly 100/1510 x 15000 — £994 Stores
50/1510 x £15000= f 497
Maintenance 5/1510 x £15000= £596
Depreciation of Machinery Machinery X 800/1510 x £150000 = £79470
Machinery Y 500/1510 x £150000 = £49669
Assembly 100/1510 x £150000 = £9934
Stores 50/1510 x £150000 = £497
Maintenance 60/1510 x £150000 = £596
Insurance of Buildings Machinery X 15/50 x £25000 — £5000
Machinery Y 5/50 x £25000 = £2500
Assembly 15/50 x £25000 = f7500 Stores
15/50 x £25000 — £7500
Maintenance 5/50 x £25000 = £2500
Salaries of works mgmt. Machinery X 3/10 x £80000 = £24000
Machinery Y 2/10 x :E80000 = £16000
Assembly 3/10 x £80000 = £24000
Stores 1/10 x £80000 — £8000
Maintenance 1/10 x £80000 = £8000
Reappointing workings: based on material issues
Machinery X 400/800* £79964 = £39982
Machinery Y 300/800 * £79964 = £29987
Assembly 100/800 * £79964 = £99995
Based on time spent
Machinery x 12/25 * £101056 = £48507
7
Paraphrase This Document
Need a fresh take? Get an instant paraphrase of this document with our AI Paraphraser
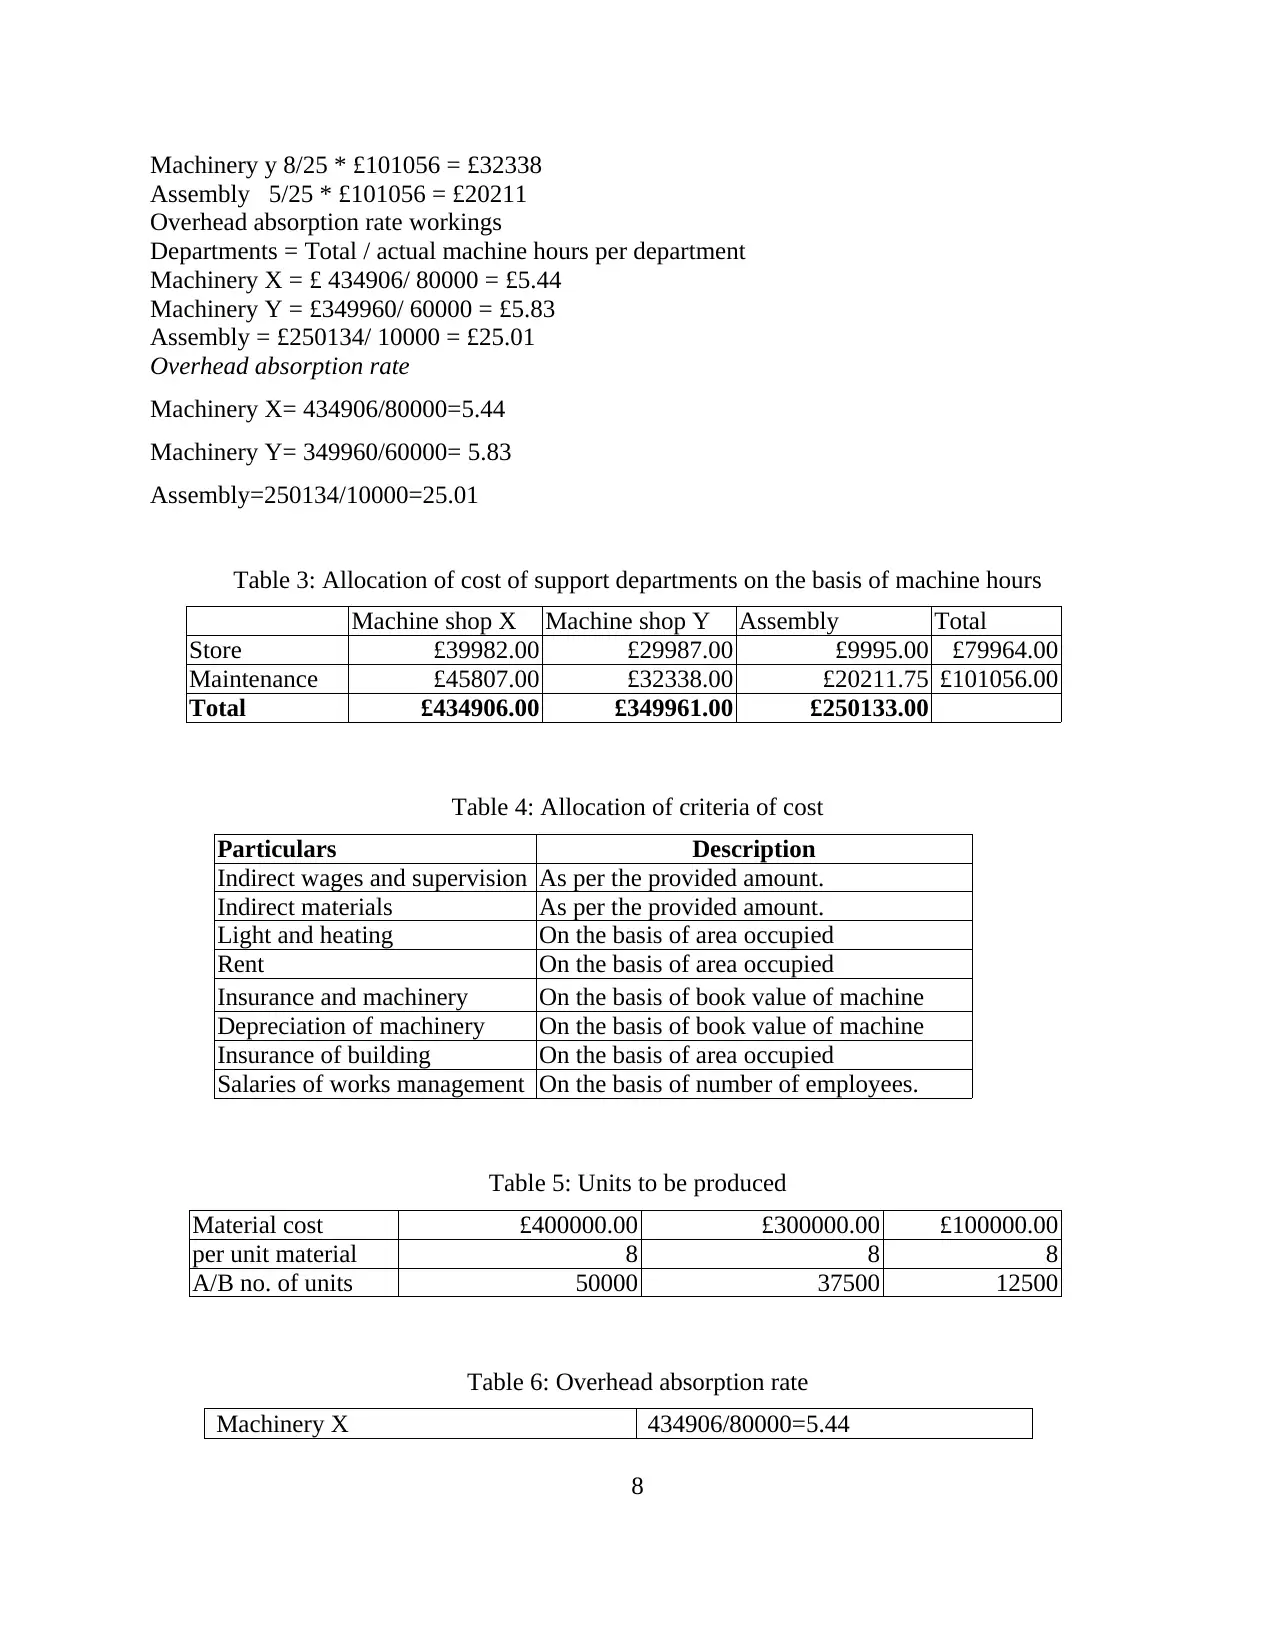
Machinery y 8/25 * £101056 = £32338
Assembly 5/25 * £101056 = £20211
Overhead absorption rate workings
Departments = Total / actual machine hours per department
Machinery X = £ 434906/ 80000 = £5.44
Machinery Y = £349960/ 60000 = £5.83
Assembly = £250134/ 10000 = £25.01
Overhead absorption rate
Machinery X= 434906/80000=5.44
Machinery Y= 349960/60000= 5.83
Assembly=250134/10000=25.01
Table 3: Allocation of cost of support departments on the basis of machine hours
Machine shop X Machine shop Y Assembly Total
Store £39982.00 £29987.00 £9995.00 £79964.00
Maintenance £45807.00 £32338.00 £20211.75 £101056.00
Total £434906.00 £349961.00 £250133.00
Table 4: Allocation of criteria of cost
Particulars Description
Indirect wages and supervision As per the provided amount.
Indirect materials As per the provided amount.
Light and heating On the basis of area occupied
Rent On the basis of area occupied
Insurance and machinery On the basis of book value of machine
Depreciation of machinery On the basis of book value of machine
Insurance of building On the basis of area occupied
Salaries of works management On the basis of number of employees.
Table 5: Units to be produced
Material cost £400000.00 £300000.00 £100000.00
per unit material 8 8 8
A/B no. of units 50000 37500 12500
Table 6: Overhead absorption rate
Machinery X 434906/80000=5.44
8
Machinery Y 349960/60000= 5.83
Assembly 250134/10000=25.01
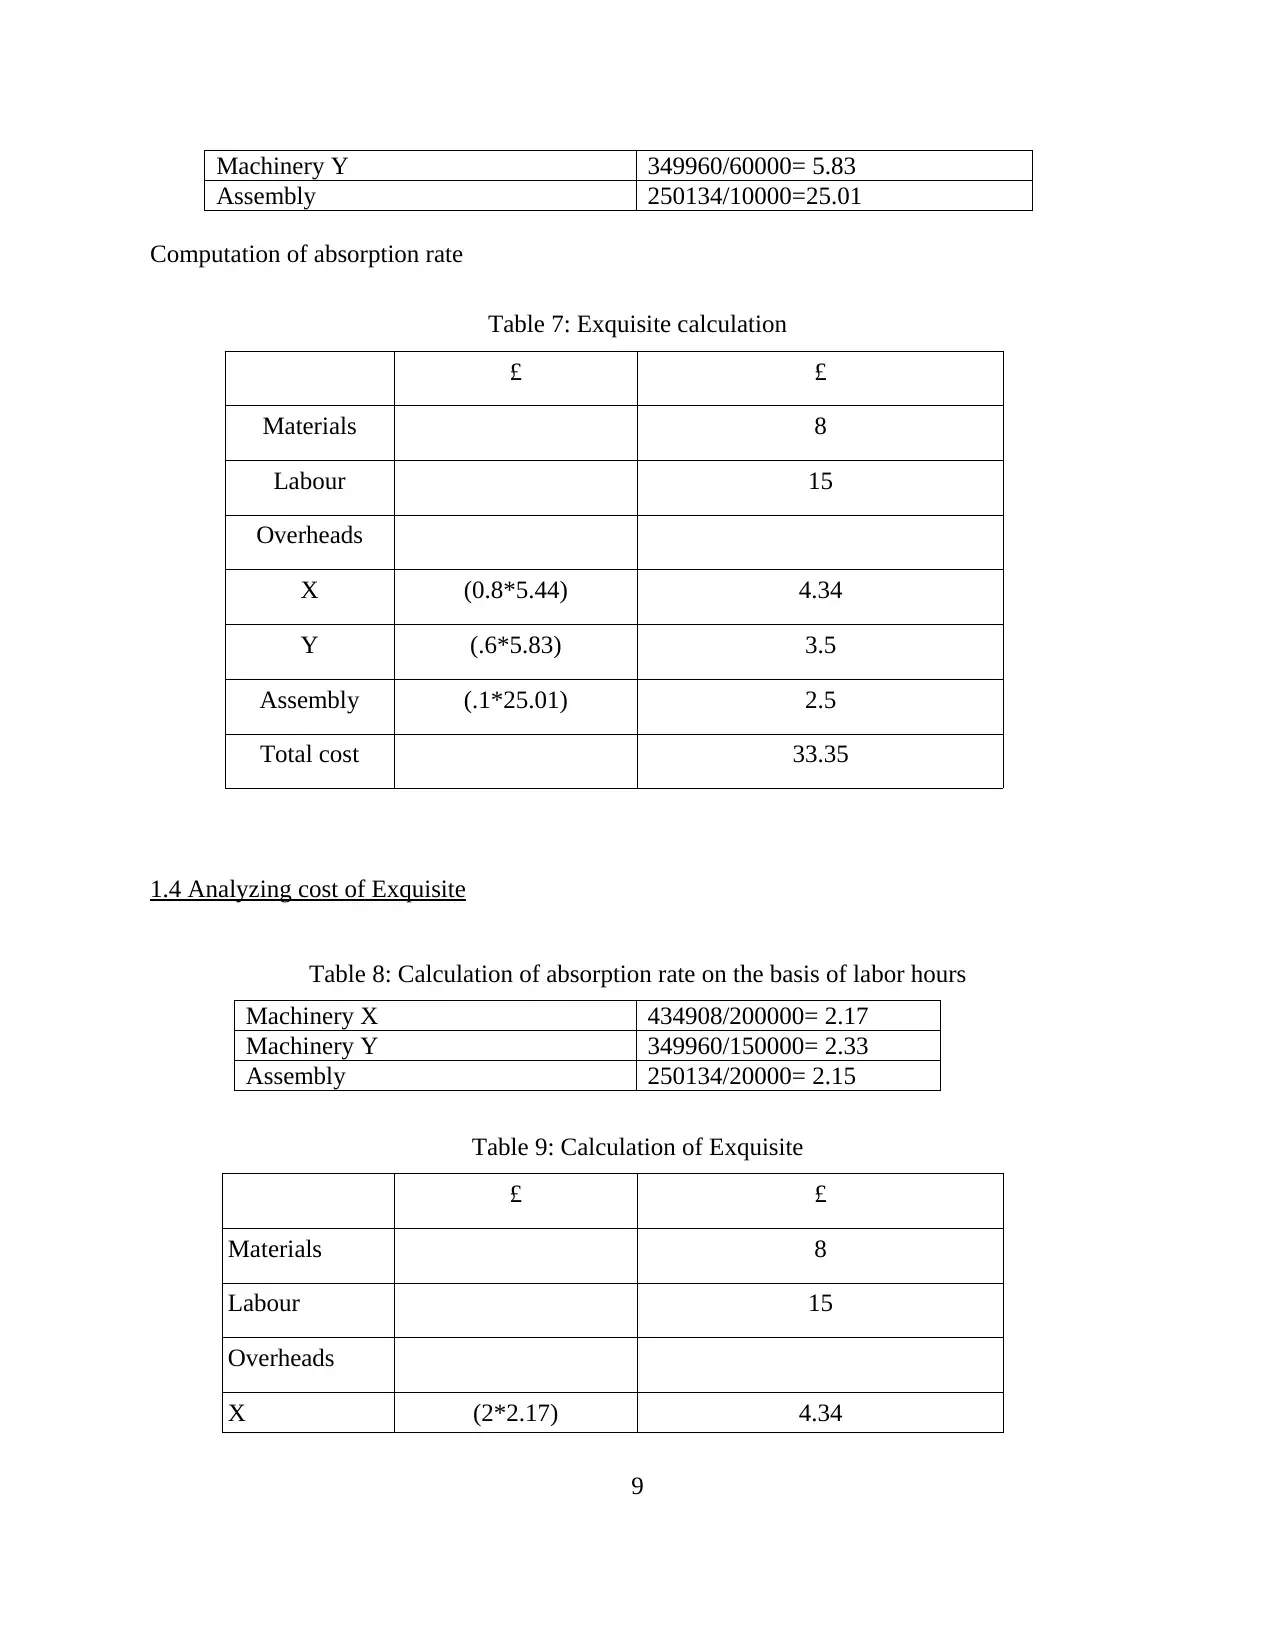
Computation of absorption rate
Table 7: Exquisite calculation
£ £
Materials 8
Labour 15
Overheads
X (0.8*5.44) 4.34
Y (.6*5.83) 3.5
Assembly (.1*25.01) 2.5
Total cost 33.35
1.4 Analyzing cost of Exquisite
Table 8: Calculation of absorption rate on the basis of labor hours
Machinery X 434908/200000= 2.17
Machinery Y 349960/150000= 2.33
Assembly 250134/20000= 2.15
Table 9: Calculation of Exquisite
£ £
Materials 8
Labour 15
Overheads
X (2*2.17) 4.34
9
Assembly 250134/10000=25.01
Computation of absorption rate
Table 7: Exquisite calculation
£ £
Materials 8
Labour 15
Overheads
X (0.8*5.44) 4.34
Y (.6*5.83) 3.5
Assembly (.1*25.01) 2.5
Total cost 33.35
1.4 Analyzing cost of Exquisite
Table 8: Calculation of absorption rate on the basis of labor hours
Machinery X 434908/200000= 2.17
Machinery Y 349960/150000= 2.33
Assembly 250134/20000= 2.15
Table 9: Calculation of Exquisite
£ £
Materials 8
Labour 15
Overheads
X (2*2.17) 4.34
9
⊘ This is a preview!⊘
Do you want full access?
Subscribe today to unlock all pages.
Trusted by 1+ million students worldwide
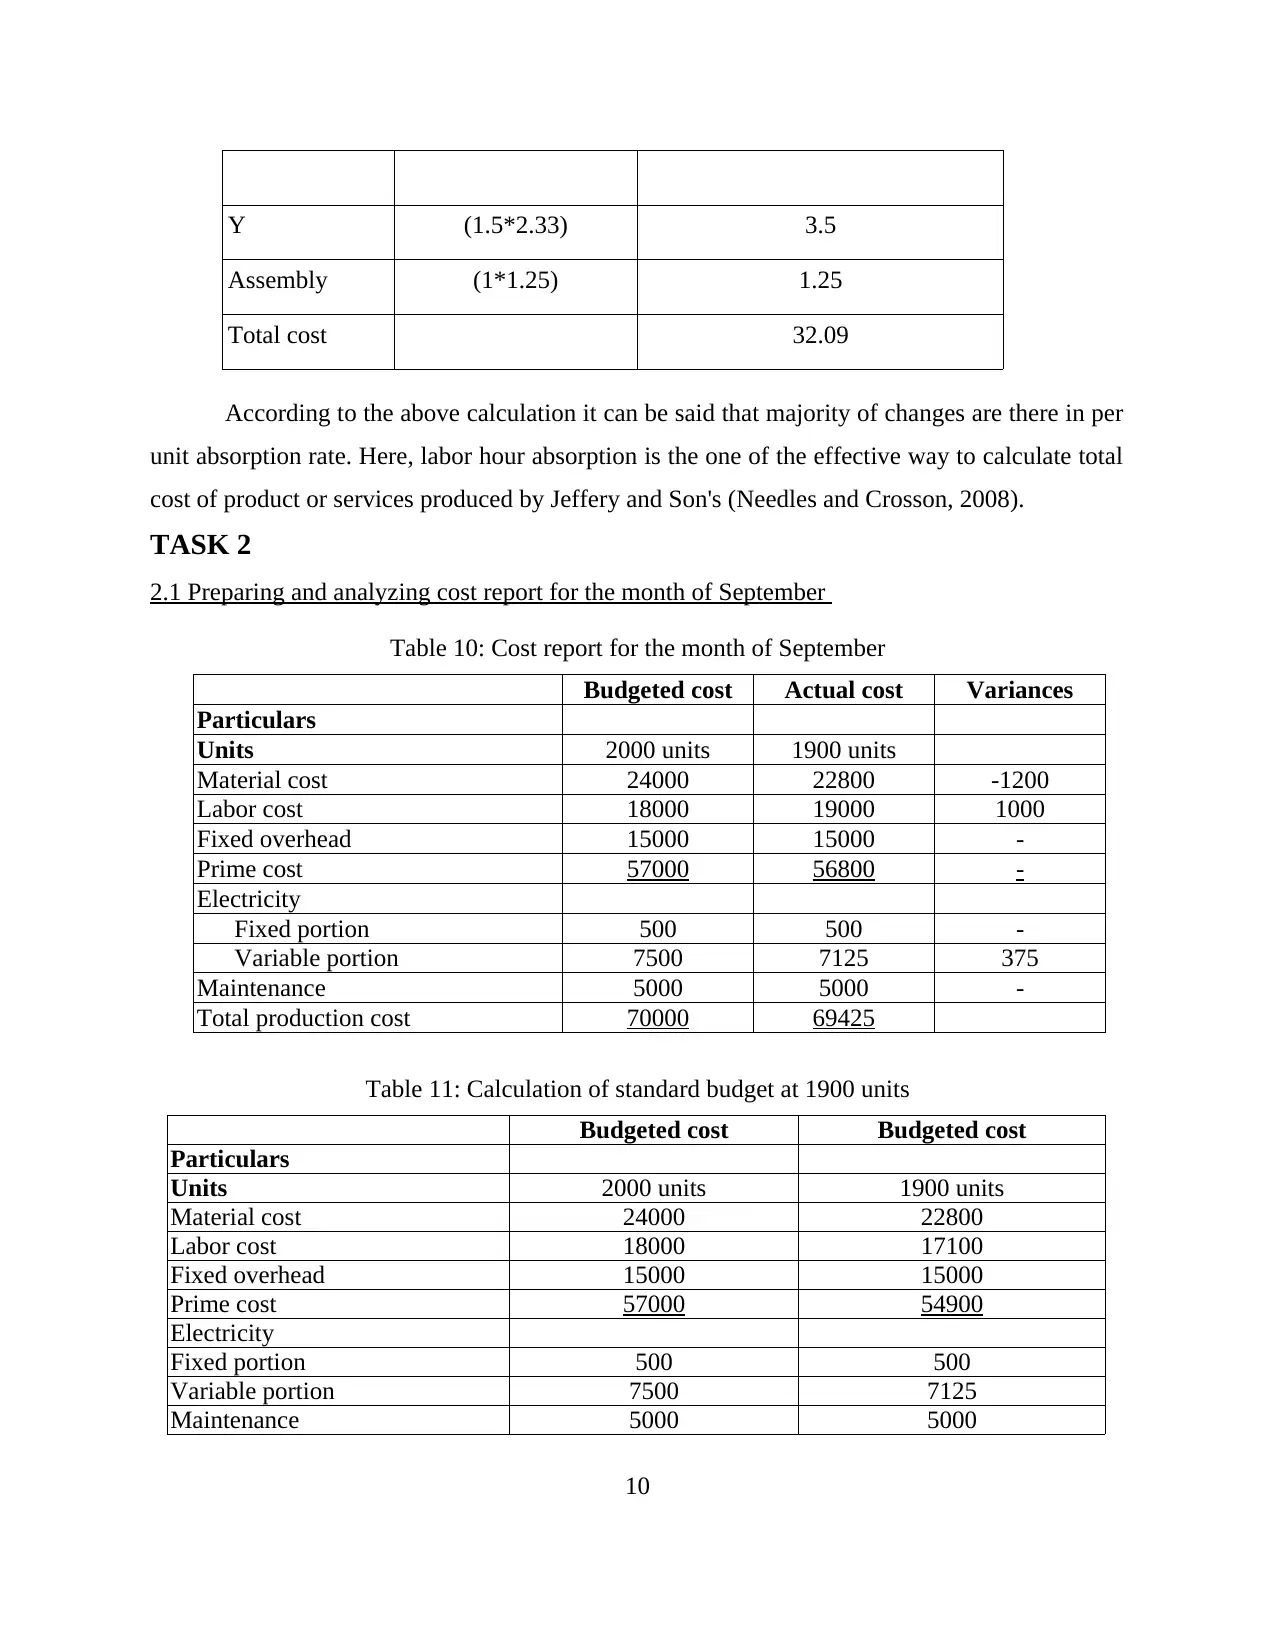
Y (1.5*2.33) 3.5
Assembly (1*1.25) 1.25
Total cost 32.09
According to the above calculation it can be said that majority of changes are there in per
unit absorption rate. Here, labor hour absorption is the one of the effective way to calculate total
cost of product or services produced by Jeffery and Son's (Needles and Crosson, 2008).
TASK 2
2.1 Preparing and analyzing cost report for the month of September
Table 10: Cost report for the month of September
Budgeted cost Actual cost Variances
Particulars
Units 2000 units 1900 units
Material cost 24000 22800 -1200
Labor cost 18000 19000 1000
Fixed overhead 15000 15000 -
Prime cost 57000 56800 -
Electricity
Fixed portion 500 500 -
Variable portion 7500 7125 375
Maintenance 5000 5000 -
Total production cost 70000 69425
Table 11: Calculation of standard budget at 1900 units
Budgeted cost Budgeted cost
Particulars
Units 2000 units 1900 units
Material cost 24000 22800
Labor cost 18000 17100
Fixed overhead 15000 15000
Prime cost 57000 54900
Electricity
Fixed portion 500 500
Variable portion 7500 7125
Maintenance 5000 5000
10
Paraphrase This Document
Need a fresh take? Get an instant paraphrase of this document with our AI Paraphraser
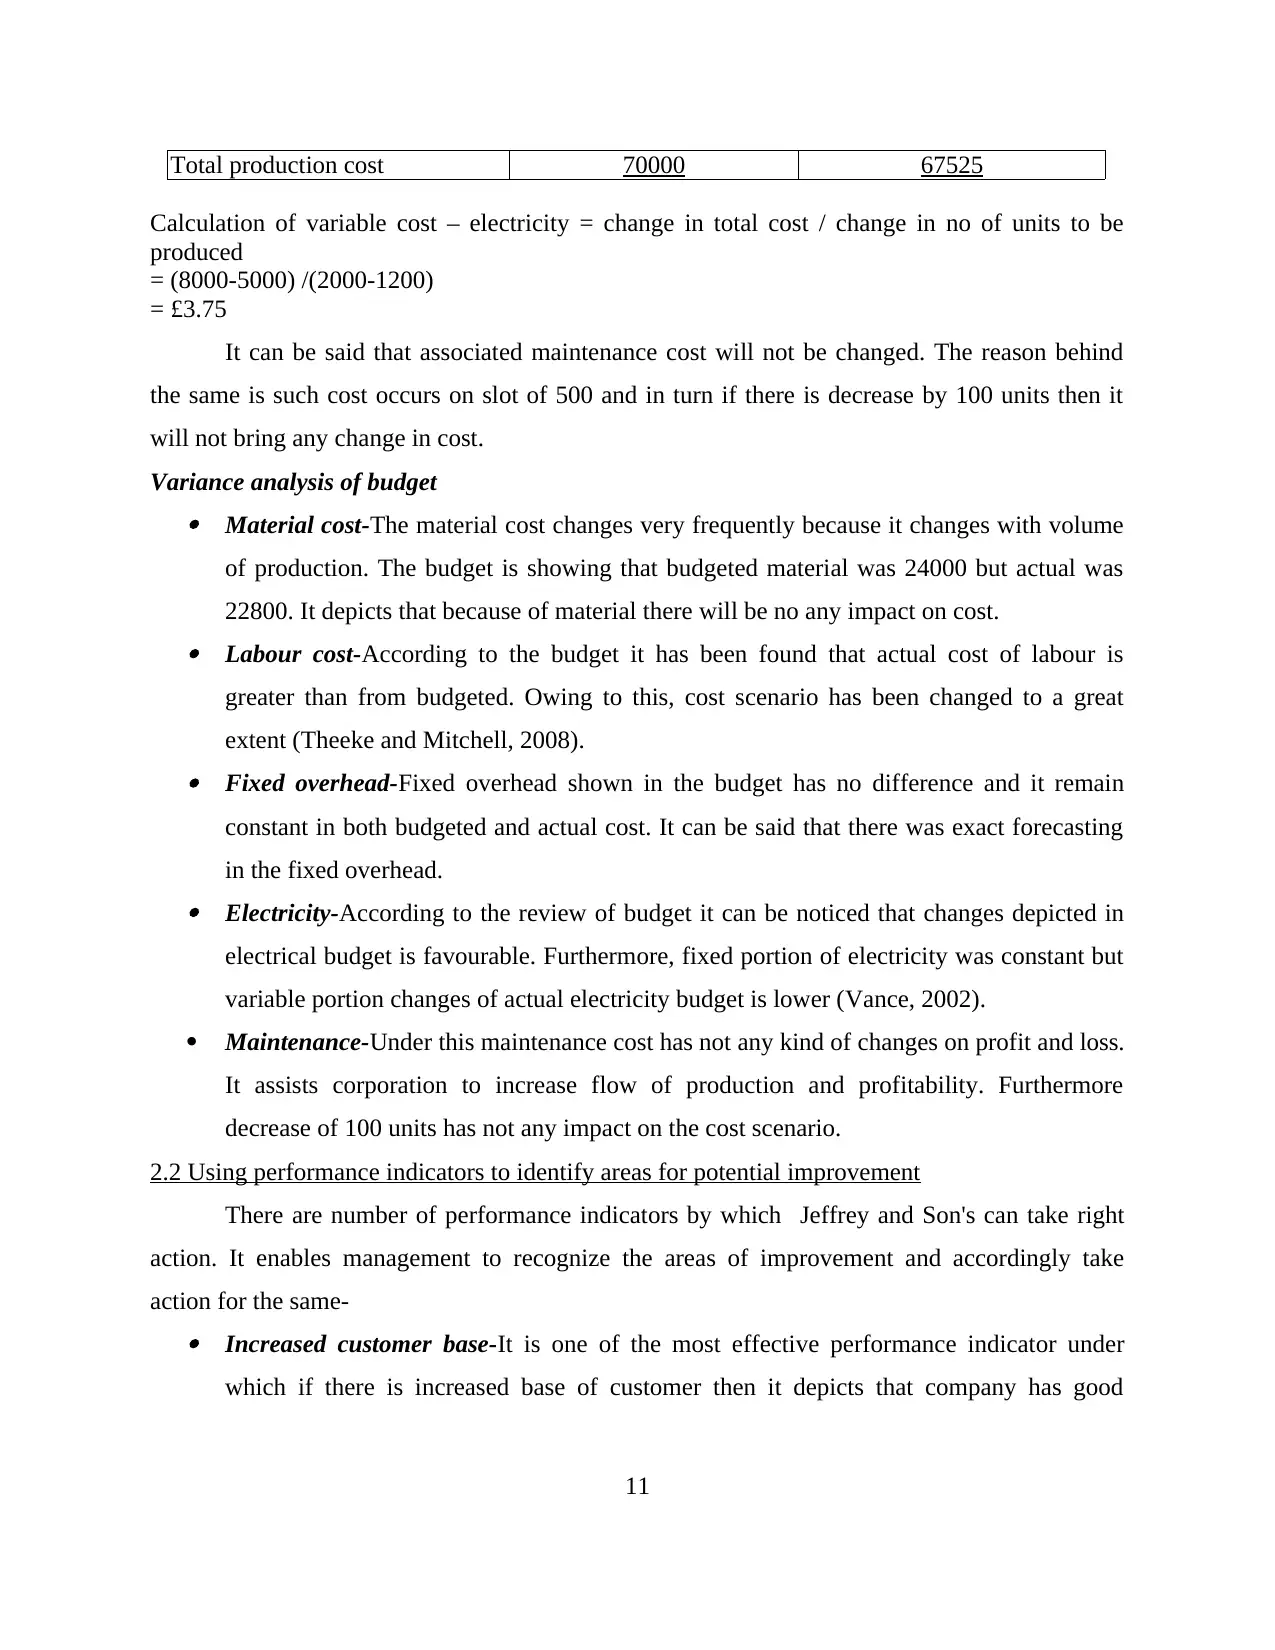
Total production cost 70000 67525
Calculation of variable cost – electricity = change in total cost / change in no of units to be
produced
= (8000-5000) /(2000-1200)
= £3.75
It can be said that associated maintenance cost will not be changed. The reason behind
the same is such cost occurs on slot of 500 and in turn if there is decrease by 100 units then it
will not bring any change in cost.
Variance analysis of budget Material cost-The material cost changes very frequently because it changes with volume
of production. The budget is showing that budgeted material was 24000 but actual was
22800. It depicts that because of material there will be no any impact on cost. Labour cost-According to the budget it has been found that actual cost of labour is
greater than from budgeted. Owing to this, cost scenario has been changed to a great
extent (Theeke and Mitchell, 2008). Fixed overhead-Fixed overhead shown in the budget has no difference and it remain
constant in both budgeted and actual cost. It can be said that there was exact forecasting
in the fixed overhead. Electricity-According to the review of budget it can be noticed that changes depicted in
electrical budget is favourable. Furthermore, fixed portion of electricity was constant but
variable portion changes of actual electricity budget is lower (Vance, 2002).
Maintenance-Under this maintenance cost has not any kind of changes on profit and loss.
It assists corporation to increase flow of production and profitability. Furthermore
decrease of 100 units has not any impact on the cost scenario.
2.2 Using performance indicators to identify areas for potential improvement
There are number of performance indicators by which Jeffrey and Son's can take right
action. It enables management to recognize the areas of improvement and accordingly take
action for the same- Increased customer base-It is one of the most effective performance indicator under
which if there is increased base of customer then it depicts that company has good
11
performance. On the other hand, in case of decreasing base of buyers show downward
trend of corporation (Vanderbeck, 2012). High profitability-This is another effective method and decrease or increase in the same
depicts organization growth and success in the marketplace.
High market share-This shows that how well an organization is performing. For example
in case Jeffrey and Son's has low market share which depicts that company is not
performing good and its needs some improvement. Accordingly corrective actions are
taken (Weygandt and et. al., 2009).
2.3 Ways to reduce cost and enhance value, quality
There are several ways to reduce cost and enables value as well as quality of products and
services offered by company. It enables management to increase flow of production and cover
cost of the same by increasing profit margin (Young, 2008). On the other hand total quality
management is the most effective method under which quality of product is assessed in proper
manner. This aid to increase buyers and accordingly rate of return will also be increased.
Furthermore, training should be provided to personnel so as to reduce waste material and use
them in the production process. This will determine long run success of company in the
marketplace with increased rate of return (Elmassri and Harris, 2011).
TASK 3
3.1 Purpose and nature of budgeting process
The budget is most important process which facilitates to give certainty for future
business activities. It enables corporation to deliver good quality of services to large number of
buyers and maintaining flow of production in an effectual manner (Nyamori, 2009). Further,
budget process helps to control expenses and achieve the set objectives of company.
Nature of budgeting process
The budgeting process is most imperative aspect under which management need to
consider requirement of business as well as mission and vision of the same. In this regard all
experienced workforce are included in the team and they make collective decision in order to
achieve organizational objectives (Schoute and Wiersma, 2011). Furthermore, overall budgeting
process is based on uncertainty wherein company find that what the potential barriers which can
12
⊘ This is a preview!⊘
Do you want full access?
Subscribe today to unlock all pages.
Trusted by 1+ million students worldwide
1 out of 23
Related Documents


Your All-in-One AI-Powered Toolkit for Academic Success.
+13062052269
info@desklib.com
Available 24*7 on WhatsApp / Email
![[object Object]](/_next/static/media/star-bottom.7253800d.svg)
Unlock your academic potential
Copyright © 2020–2026 A2Z Services. All Rights Reserved. Developed and managed by ZUCOL.