Financial Analysis of Jet2 and Ryanair: Performance Comparison Report
VerifiedAdded on 2020/04/21
|43
|7621
|169
Report
AI Summary
This report provides a financial comparison between Jet2, a British low-cost airline, and Ryanair, an Irish low-cost airline. The analysis focuses on profitability, liquidity, and debt ratios using data from 2013 to 2015. The report examines operating margin, net margin, return on equity, return on total assets, current ratio, quick ratio, and debt ratio to assess the financial health of both airlines. It includes time series and cross-sectional analyses, comparing their performance and identifying similarities and dissimilarities. The study concludes with recommendations for improving financial performance, considering the impact of the Eurozone and Brexit. The report highlights Ryanair's profitability and stable liquidity, while Jet2 faces challenges with debt and declining profit margins. The analysis offers valuable insights into the financial strategies and performance of these two major European airlines.
Running head: FINANCIAL ANALYSIS FOR MANAGERS
Financial Analysis for Managers
Name of the Student:
Name of the University
Author’ Note:
Course ID:
Financial Analysis for Managers
Name of the Student:
Name of the University
Author’ Note:
Course ID:
Paraphrase This Document
Need a fresh take? Get an instant paraphrase of this document with our AI Paraphraser
1FINANCIAL ANALYSIS FOR MANAGERS
Table of Contents
Terms of reference:..........................................................................................................................2
Executive Summary:........................................................................................................................4
Ratio analysis:..................................................................................................................................5
Analysis of Jet2:..............................................................................................................................8
Analysis of Ryanair:......................................................................................................................14
Comparison between Jet2 and Ryanair:........................................................................................21
Conclusion and recommendations:................................................................................................26
References and Bibliographies:.....................................................................................................27
Appendices:...................................................................................................................................31
2FINANCIAL ANALYSIS FOR MANAGERS
Terms of reference:
In this report, a financial comparison has been carried out between two airlines, one is the
British low-cost airline, Jet2 and another is an Irish low-cost airline, Ryanair. Both had been
European carriers before the Brexit effect and these two airlines have benefitted and suffered
being members of the Euro zone, particularly during the declining stock market.
Ryanair is a low-cost airline in Ireland established in 1984 and it’s headquarter is located
in Swords, Dublin, Ireland. The primary operational bases of the airline are at London Stansted
and Dublin airports. It is the largest European airline in terms of scheduled passengers flown and
it has carried most global passengers in contrast to any other airline in 2016 (Ryanair.com
2017). The rapid expansion helps in characterising the airline, which is due to the deregulation of
the aviation industry in Europe in 1997 along with the success of its low-cost business model.
The route network of Ryanair serves 34 nations in Europe, the Middle East (Israel) and Africa
(Morocco).
Jet2 is a British low-cost airline based at Leeds Bradford Airport, England. It is the fourth
biggest scheduled airline in UK. In addition, the airline holds a “UK Civil Aviation Authority
Type A Operating Licence” for carrying passengers, cargo and mail aircrafts having 20 or
additional seats (Jet2.com 2017). The route network of Jet2 serves 47 sun destinations and its
employee base is around 4,000 in April 2015.
The financial analysis would be made for assessing the non-financial measures including
breakdown by various divisions and measures of corporate social responsibility, efficiency,
liquidity, profitability and gearing constituting of both time series and cross-sectional analyses
for both the airlines. Along with this, the similarities and dissimilarities of both the airlines
⊘ This is a preview!⊘
Do you want full access?
Subscribe today to unlock all pages.
Trusted by 1+ million students worldwide

3FINANCIAL ANALYSIS FOR MANAGERS
would be computed, after which a summary of the results would be drawn and suggestions
would be made for improving the financial performance of both the airlines.
would be computed, after which a summary of the results would be drawn and suggestions
would be made for improving the financial performance of both the airlines.
Paraphrase This Document
Need a fresh take? Get an instant paraphrase of this document with our AI Paraphraser
4FINANCIAL ANALYSIS FOR MANAGERS
Executive Summary:
In this report, a financial comparison has been carried out between two airlines, one is the
British low-cost airline, Jet2 and another is an Irish low-cost airline, Ryanair. Both had been
European carriers before the Brexit effect and these two airlines have benefitted and suffered
being members of the Euro zone, particularly during the declining stock market. The primary
aim of ratio analysis is to compute and interpret the financial ratios for monitoring and
evaluating the financial position and performance of the organisations. The shareholders,
management and creditors of the concerned organisations would be interested in this analysis.
By comparing the profitability position, it could be inferred that Ryanair is leading in
terms of profit, while in terms of generating and providing returns, Jet2 is in a better position
compared to the former. Ryanair is enjoying a stable liquidity position in the UK aviation
industry compared to Jet2. Since the debt burden of Jet2 is greater in contrast to Ryanair, it could
be inferred that the former is more risky to become bankrupt in future. Although both the airlines
are struggling to maintain a competitive position in the market, Jet2 is in a better position
compared to Ryanair. Thus, it could be inferred that both the airlines are struggling to maintain
their solvency positions; however, if compared, Ryanair is in a favourable position in contrast to
Jet2.
To conclude, it could be observed that both the airlines being parts of the Euro zone, have
suffered as well as benefitted. Both the airlines depend on tax benefits for gains and in order to
restrict them from going into debt, they need to declare bankruptcy.

5FINANCIAL ANALYSIS FOR MANAGERS
⊘ This is a preview!⊘
Do you want full access?
Subscribe today to unlock all pages.
Trusted by 1+ million students worldwide
6FINANCIAL ANALYSIS FOR MANAGERS
Ratio analysis:
The primary aim of ratio analysis is to compute and interpret the financial ratios for
monitoring and evaluating the financial position and performance of the organisations. The
shareholders, management and creditors of the concerned organisations would be interested in
this analysis (Arrozio, Gonzales and Da Silva 2016). The following are the types of ratios that
would be computed:
Profitability ratios
Liquidity ratios
Debt ratios
Activity ratios
Gearing ratios
Profitability ratios:
In the words of Barnard et al. (2014), profitability ratios gauge the profit-generating
capability of an organisation in relation to assets, sales and equity. These ratios provide an
effective platform to judge the individual performance of an organisation and they are beneficial
to contrast a firm with its rivals in relation to the industrial benchmark. The profitability ratios
that would be considered in this report include the following:
Operating margin = Operating profit/ Sales revenue
Net margin = Net profit/ Sales revenue
Return on equity = Net profit/ Average shareholders’ equity
Paraphrase This Document
Need a fresh take? Get an instant paraphrase of this document with our AI Paraphraser
7FINANCIAL ANALYSIS FOR MANAGERS
Return on total assets = Net profit/ Total assets
Liquidity ratios:
Liquidity explains the extent to which a security or an asset could be purchased quickly
or it could be sold in the market without having any impact on the price of the security or asset.
In this context, Attig and Cleary (2014) remarked that accounting liquidity gauges the ease
through which an individual or organisation could clear the financial obligations with liquid
assets available to them. The two liquidity ratios that would be applied in this report constitute of
the following:
Current ratio = Current assets/ Current liabilities
Quick ratio = (Current assets – Inventories – Prepaid expenses)/ Current liabilities
Debt ratios:
Debt ratios gauge the degree of leverage of an individual or a firm, which depicts the
portion of the assets owned on the part of the organisation and the amount financed through debt
(Bekaert and Hodrick 2017). The following debt ratio is taken into account in the form of
gearing, which is described later on in the report:
Debt ratio = Total liabilities/ Total assets
Activity ratios:
As pointed out by Bodie (2013), activity ratios gauge the ability of an organisation to
convert various accounts within the balance sheet statements into sales or cash. These ratios
gauge the relative efficacy of an organisation depending on asset utilisation, leverage and other
8FINANCIAL ANALYSIS FOR MANAGERS
items of balance sheet and they are significant in ascertaining whether the management of an
organisation is capable of generating cash and revenues from the available ratios. In this report,
the activity ratio that has been considered is the total asset turnover ratio, which would depict the
efficacy of an organisation in terms of asset utilisation for generating sales.
Total asset turnover ratio = Sales revenue/ Total assets
Gearing ratios:
Gearing ratio is a common term explaining a financial ratio, which contrasts some kind of
owner’s equity to borrowed funds. In this context, Brigham and Daves (2014) cited that gearing
is a measure related to financial leverage describing the extent to which the activities of an
organisation are financed on the part of the owner’s funds in contrast to the funds of the
creditors. The greater the degree of leverage of an organisation, the greater is the risk for the
organisation. For majority of the ratios, an acceptable level is ascertained by the comparison to
ratios of firms in the identical industry. The following gearing ratios have been taken into
consideration for this report:
Debt-to-equity ratio = Total debt/ Total equity
Times interest earned ratio = Operating profit/ Interest expense
Equity ratio = Total equity/ Total assets
⊘ This is a preview!⊘
Do you want full access?
Subscribe today to unlock all pages.
Trusted by 1+ million students worldwide
9FINANCIAL ANALYSIS FOR MANAGERS
Analysis of Jet2:
The following section would depict the financial performance and position of Jet2 based
on its annual reports of 2013, 2014 and 2015.
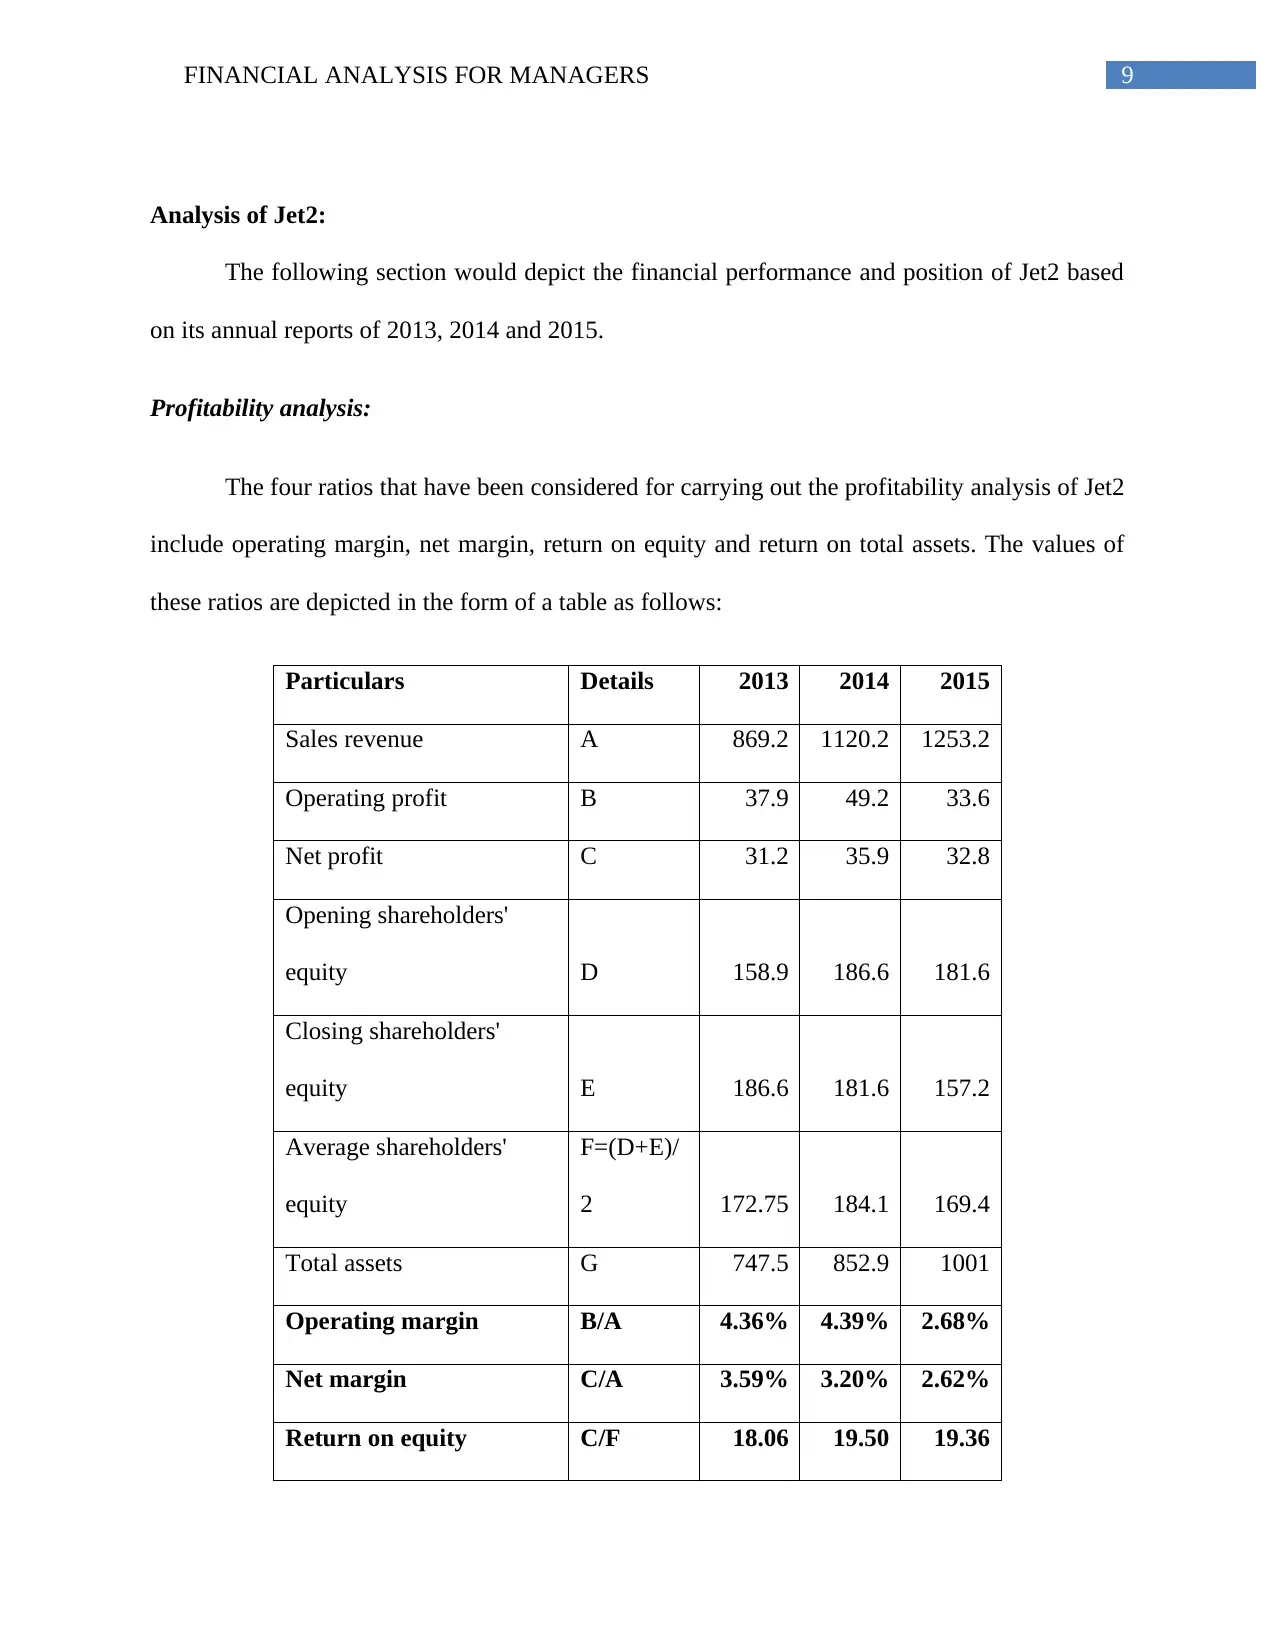
Profitability analysis:
The four ratios that have been considered for carrying out the profitability analysis of Jet2
include operating margin, net margin, return on equity and return on total assets. The values of
these ratios are depicted in the form of a table as follows:
Particulars Details 2013 2014 2015
Sales revenue A 869.2 1120.2 1253.2
Operating profit B 37.9 49.2 33.6
Net profit C 31.2 35.9 32.8
Opening shareholders'
equity D 158.9 186.6 181.6
Closing shareholders'
equity E 186.6 181.6 157.2
Average shareholders'
equity
F=(D+E)/
2 172.75 184.1 169.4
Total assets G 747.5 852.9 1001
Operating margin B/A 4.36% 4.39% 2.68%
Net margin C/A 3.59% 3.20% 2.62%
Return on equity C/F 18.06 19.50 19.36
Analysis of Jet2:
The following section would depict the financial performance and position of Jet2 based
on its annual reports of 2013, 2014 and 2015.
Profitability analysis:
The four ratios that have been considered for carrying out the profitability analysis of Jet2
include operating margin, net margin, return on equity and return on total assets. The values of
these ratios are depicted in the form of a table as follows:
Particulars Details 2013 2014 2015
Sales revenue A 869.2 1120.2 1253.2
Operating profit B 37.9 49.2 33.6
Net profit C 31.2 35.9 32.8
Opening shareholders'
equity D 158.9 186.6 181.6
Closing shareholders'
equity E 186.6 181.6 157.2
Average shareholders'
equity
F=(D+E)/
2 172.75 184.1 169.4
Total assets G 747.5 852.9 1001
Operating margin B/A 4.36% 4.39% 2.68%
Net margin C/A 3.59% 3.20% 2.62%
Return on equity C/F 18.06 19.50 19.36
Paraphrase This Document
Need a fresh take? Get an instant paraphrase of this document with our AI Paraphraser
10FINANCIAL ANALYSIS FOR MANAGERS
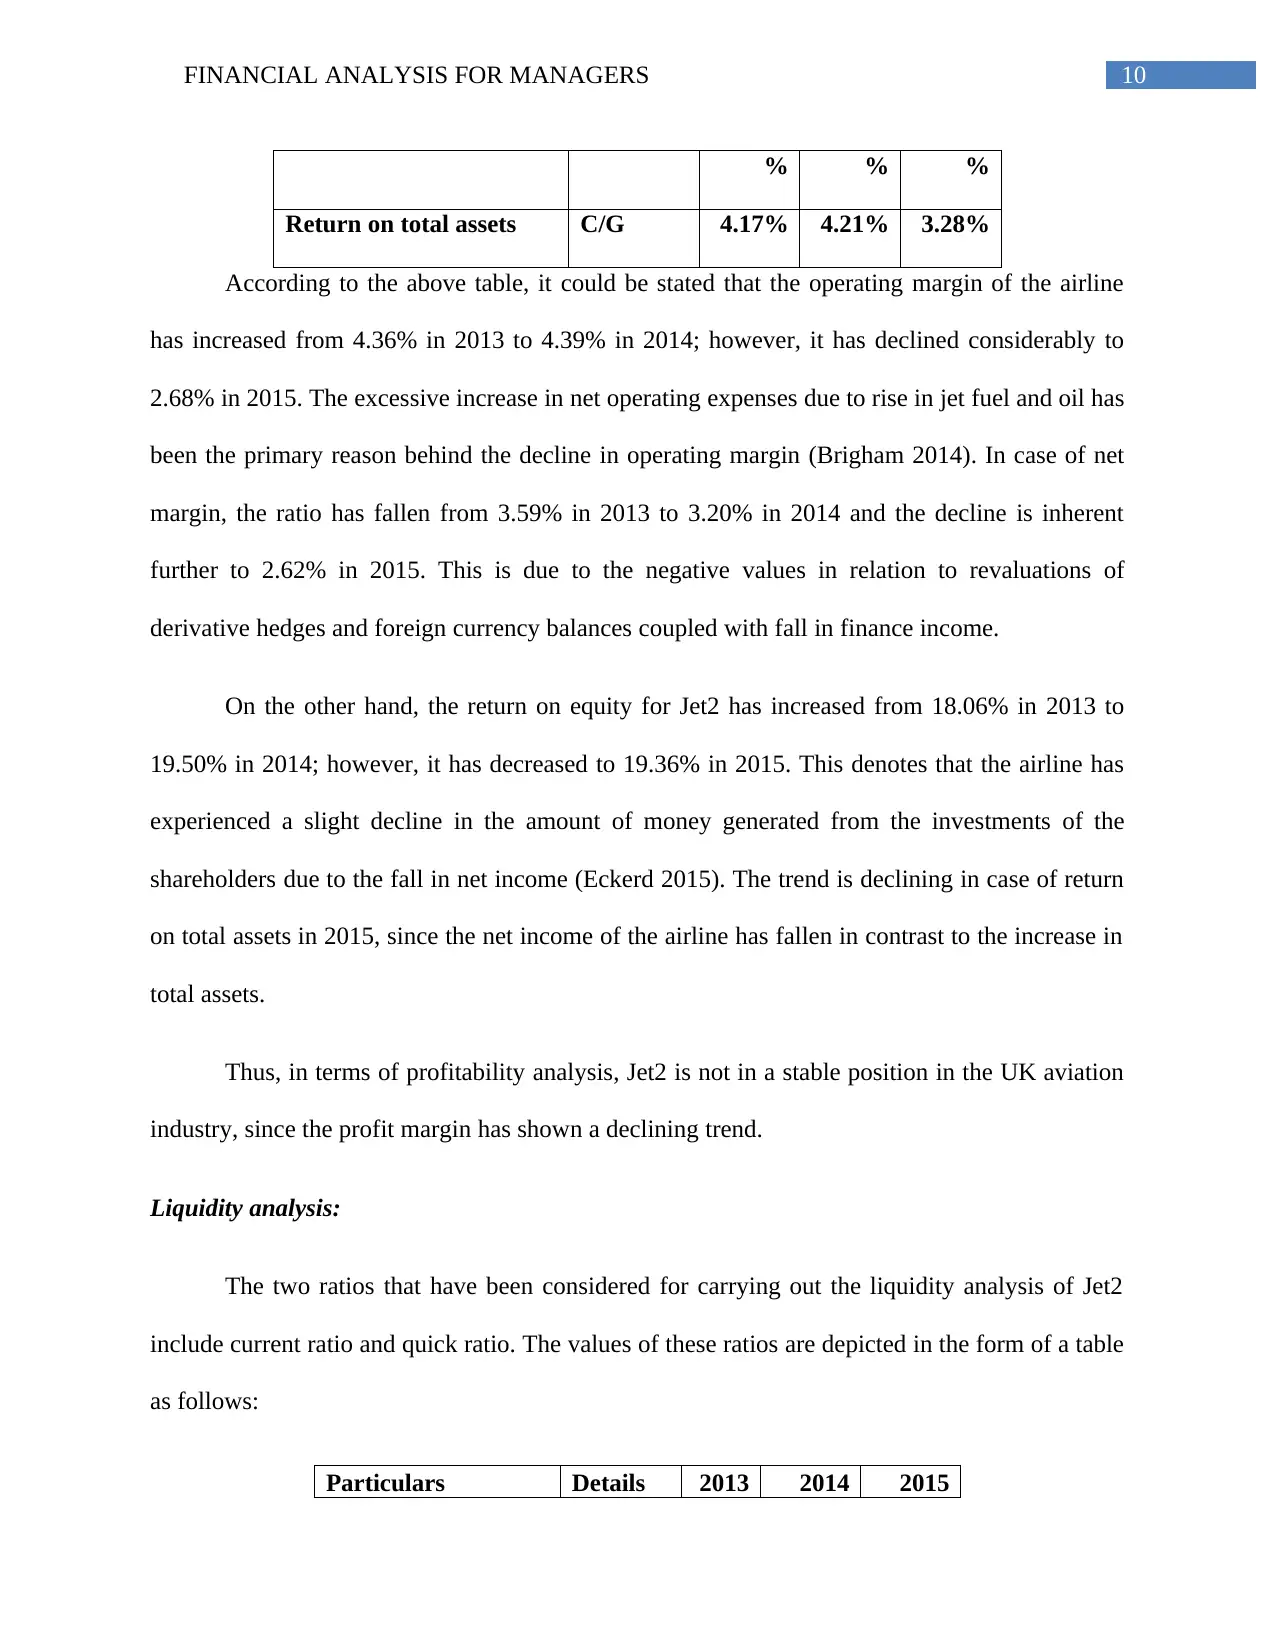
% % %
Return on total assets C/G 4.17% 4.21% 3.28%
According to the above table, it could be stated that the operating margin of the airline
has increased from 4.36% in 2013 to 4.39% in 2014; however, it has declined considerably to
2.68% in 2015. The excessive increase in net operating expenses due to rise in jet fuel and oil has
been the primary reason behind the decline in operating margin (Brigham 2014). In case of net
margin, the ratio has fallen from 3.59% in 2013 to 3.20% in 2014 and the decline is inherent
further to 2.62% in 2015. This is due to the negative values in relation to revaluations of
derivative hedges and foreign currency balances coupled with fall in finance income.
On the other hand, the return on equity for Jet2 has increased from 18.06% in 2013 to
19.50% in 2014; however, it has decreased to 19.36% in 2015. This denotes that the airline has
experienced a slight decline in the amount of money generated from the investments of the
shareholders due to the fall in net income (Eckerd 2015). The trend is declining in case of return
on total assets in 2015, since the net income of the airline has fallen in contrast to the increase in
total assets.
Thus, in terms of profitability analysis, Jet2 is not in a stable position in the UK aviation
industry, since the profit margin has shown a declining trend.
Liquidity analysis:
The two ratios that have been considered for carrying out the liquidity analysis of Jet2
include current ratio and quick ratio. The values of these ratios are depicted in the form of a table
as follows:
Particulars Details 2013 2014 2015
% % %
Return on total assets C/G 4.17% 4.21% 3.28%
According to the above table, it could be stated that the operating margin of the airline
has increased from 4.36% in 2013 to 4.39% in 2014; however, it has declined considerably to
2.68% in 2015. The excessive increase in net operating expenses due to rise in jet fuel and oil has
been the primary reason behind the decline in operating margin (Brigham 2014). In case of net
margin, the ratio has fallen from 3.59% in 2013 to 3.20% in 2014 and the decline is inherent
further to 2.62% in 2015. This is due to the negative values in relation to revaluations of
derivative hedges and foreign currency balances coupled with fall in finance income.
On the other hand, the return on equity for Jet2 has increased from 18.06% in 2013 to
19.50% in 2014; however, it has decreased to 19.36% in 2015. This denotes that the airline has
experienced a slight decline in the amount of money generated from the investments of the
shareholders due to the fall in net income (Eckerd 2015). The trend is declining in case of return
on total assets in 2015, since the net income of the airline has fallen in contrast to the increase in
total assets.
Thus, in terms of profitability analysis, Jet2 is not in a stable position in the UK aviation
industry, since the profit margin has shown a declining trend.
Liquidity analysis:
The two ratios that have been considered for carrying out the liquidity analysis of Jet2
include current ratio and quick ratio. The values of these ratios are depicted in the form of a table
as follows:
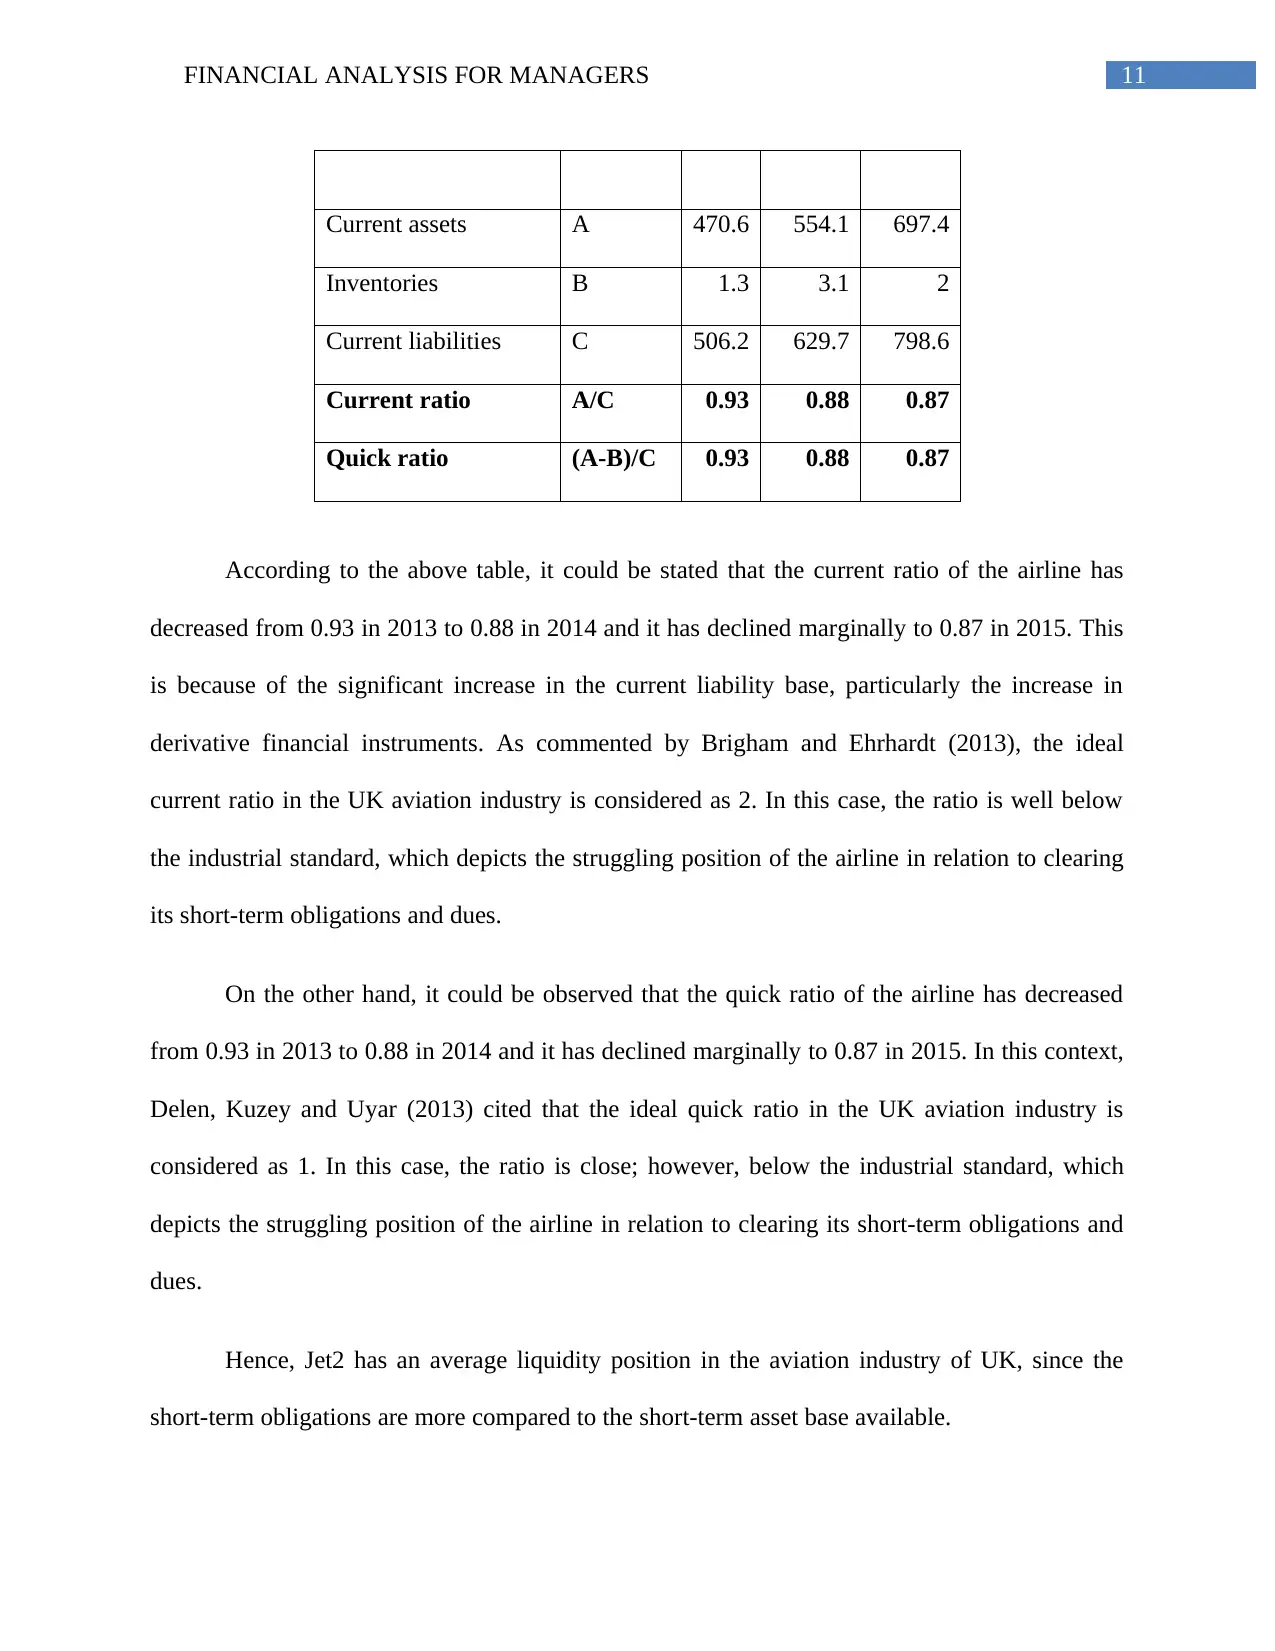
Particulars Details 2013 2014 2015
11FINANCIAL ANALYSIS FOR MANAGERS
Current assets A 470.6 554.1 697.4
Inventories B 1.3 3.1 2
Current liabilities C 506.2 629.7 798.6
Current ratio A/C 0.93 0.88 0.87
Quick ratio (A-B)/C 0.93 0.88 0.87
According to the above table, it could be stated that the current ratio of the airline has
decreased from 0.93 in 2013 to 0.88 in 2014 and it has declined marginally to 0.87 in 2015. This
is because of the significant increase in the current liability base, particularly the increase in
derivative financial instruments. As commented by Brigham and Ehrhardt (2013), the ideal
current ratio in the UK aviation industry is considered as 2. In this case, the ratio is well below
the industrial standard, which depicts the struggling position of the airline in relation to clearing
its short-term obligations and dues.
On the other hand, it could be observed that the quick ratio of the airline has decreased
from 0.93 in 2013 to 0.88 in 2014 and it has declined marginally to 0.87 in 2015. In this context,
Delen, Kuzey and Uyar (2013) cited that the ideal quick ratio in the UK aviation industry is
considered as 1. In this case, the ratio is close; however, below the industrial standard, which
depicts the struggling position of the airline in relation to clearing its short-term obligations and
dues.
Hence, Jet2 has an average liquidity position in the aviation industry of UK, since the
short-term obligations are more compared to the short-term asset base available.
⊘ This is a preview!⊘
Do you want full access?
Subscribe today to unlock all pages.
Trusted by 1+ million students worldwide
1 out of 43
Related Documents


Your All-in-One AI-Powered Toolkit for Academic Success.
+13062052269
info@desklib.com
Available 24*7 on WhatsApp / Email
![[object Object]](/_next/static/media/star-bottom.7253800d.svg)
Unlock your academic potential
Copyright © 2020–2026 A2Z Services. All Rights Reserved. Developed and managed by ZUCOL.