Detailed Analysis of JIT/Lean Production, Procurement & Contracts

Verified

Added on  2023/06/04

|21
|3065
|334
Case Study
AI Summary
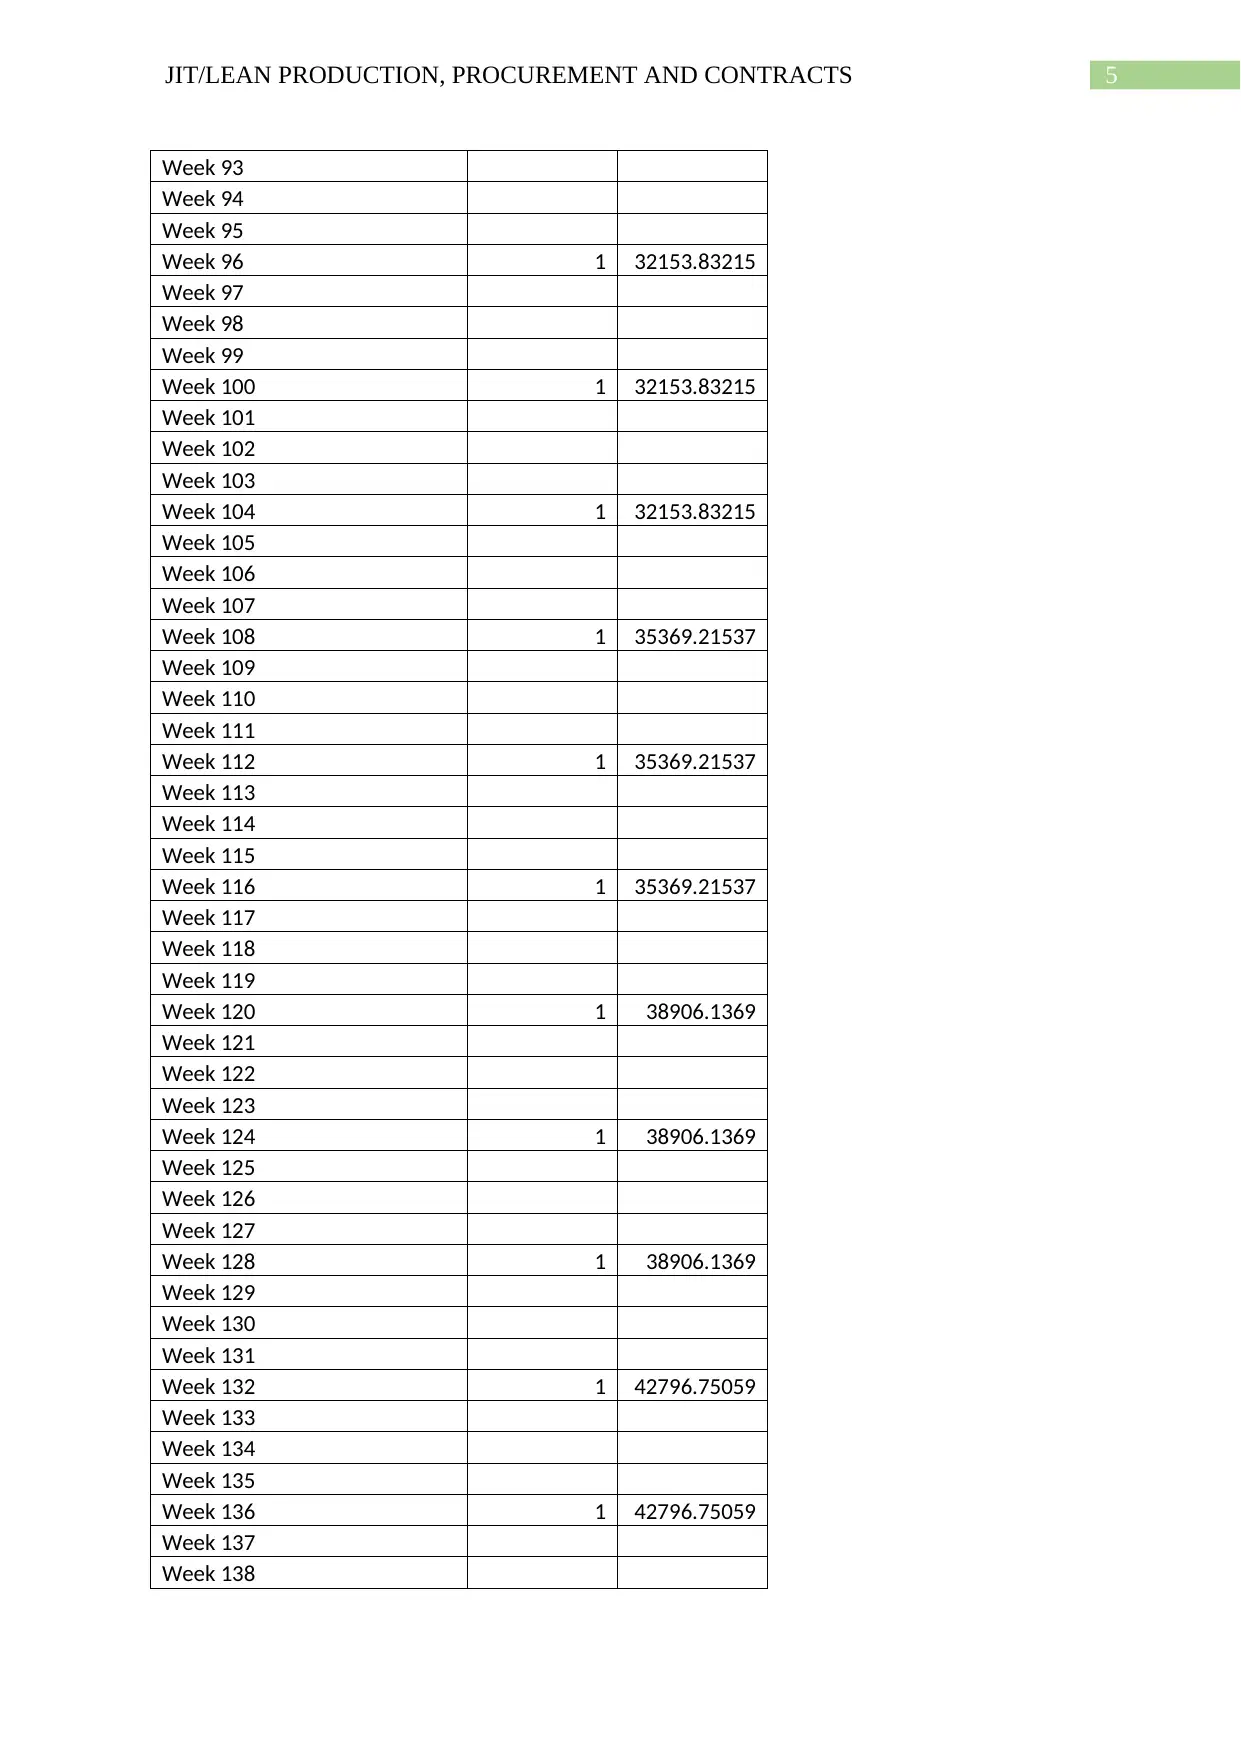
This case study analyzes a scenario involving a framing contractor and a construction project to build 45 houses over two years, focusing on JIT/Lean production principles, procurement strategies, and contract management. The analysis compares the cost of hiring the framer at a fixed rate of $13,500 per unit versus using the average market rate, which is $15,000 per unit and increases by 10% every three months. The study evaluates whether to proceed with the framer contract, considering the need for a $5,000 equipment purchase and payment terms. It also assesses the impact of increasing production to 45 units per year and the implications of the market rate stabilizing at $13,500 per unit. Additionally, the case study discusses supplier selection based on spend analysis data, cost tolerance between regions, and the impact of PST changes, with reference to legal frameworks and relevant Canadian regulations. The study provides detailed tables and computations to support the analysis and recommendations.
Document Page
Running head: JIT/LEAN PRODUCTION, PROCUREMENT AND CONTRACTS
JIT/Lean Production, Procurement and Contracts
Name of the Student
Name of the University
Authors Note
Course ID
tabler-icon-diamond-filled.svg

Secure Best Marks with AI Grader

Need help grading? Try our AI Grader for instant feedback on your assignments.
Document Page
1JIT/LEAN PRODUCTION, PROCUREMENT AND CONTRACTS
Table of Contents
Answer to Question 1.................................................................................................................2
Answer to Part A........................................................................................................................2
Answer to Part B..................................................................................................................11
Answer to Part C..................................................................................................................14
Answer to Question 2...............................................................................................................14
Answer to Part A..................................................................................................................14
Answer to Part B..................................................................................................................15
Answer to Part C..................................................................................................................15
Answer to Part D..................................................................................................................15
Answer to Part E..................................................................................................................16
Answer to Question 3...............................................................................................................16
Answer to Part A..................................................................................................................17
Answer to Part B..................................................................................................................17
Answer to Part C..................................................................................................................17
Answer to Part D..................................................................................................................17
References................................................................................................................................19
Document Page
2JIT/LEAN PRODUCTION, PROCUREMENT AND CONTRACTS
Answer to Question 1
Answer to Part A
As per the present contract the total cost as per the market rate is more expensive. The
total framer price at market rate is depicted to be $ 1482420 over a time period of two years.
On the other hand, the price at framer rate is $ 612500 which is $ 869920 more than the price
at market rate. Therefore, it is advisable to proceed with the contract by making a payment
term of net 30. In addition to this, these are directly relevant to legal framework of
procurement in Canada as per “Tercon Contractors Ltd. v. British Columbia
(Transportation and Highways)”. (Mohammadi, Soleymani and Mozafari 2014).
Average Market Framing Rate 15000 per unit
Framer Rate 13500 per unit
Average market increase rate 10% 90 Days
No. of Units to be built 45 2 Years
Cost of Equipment $5,000
Payment terms 30
Time Required (45 Units) 945 Days
Computation of Price to frame Houses at Market Rate
Particulars Units Amount ($)
Document Page
3JIT/LEAN PRODUCTION, PROCUREMENT AND CONTRACTS
Week 1
Week 2
Week 3
Week 4 1 15000
Week 5
Week 6
Week 7
Week 8 1 15000
Week 9
Week 10
Week 11
Week 12 1 16500
Week 13
Week 14
Week 15
Week 16 1 16500
Week 17
Week 18
Week 19
Week 20 1 16500
Week 21
Week 22
Week 23
Week 24 1 18150
Week 25
Week 26
Week 27
Week 28 1 18150
Week 29
Week 30
Week 31
Week 32 1 18150
Week 33
Week 34
Week 35
Week 36 1 19965
Week 37
Week 38
Week 39
Week 40 1 19965
Week 41
Week 42
Week 43
Week 44 1 19965
Week 45
Week 46
tabler-icon-diamond-filled.svg

Secure Best Marks with AI Grader

Need help grading? Try our AI Grader for instant feedback on your assignments.
Document Page
4JIT/LEAN PRODUCTION, PROCUREMENT AND CONTRACTS
Week 47
Week 48 1 21961.5
Week 49
Week 50
Week 51
Week 52 1 21961.5
Week 53
Week 54
Week 55
Week 56 1 21961.5
Week 57
Week 58
Week 59
Week 60 1 24157.65
Week 61
Week 62
Week 63
Week 64 1 24157.65
Week 65
Week 66
Week 67
Week 68 1 24157.65
Week 69
Week 70
Week 71
Week 72 1 26573.415
Week 73
Week 74
Week 75
Week 76 1 26573.415
Week 77
Week 78
Week 79
Week 80 1 26573.415
Week 81
Week 82
Week 83
Week 84 1 29230.7565
Week 85
Week 86
Week 87
Week 88 1 29230.7565
Week 89
Week 90
Week 91
Week 92 1 29230.7565
Document Page
5JIT/LEAN PRODUCTION, PROCUREMENT AND CONTRACTS
Week 93
Week 94
Week 95
Week 96 1 32153.83215
Week 97
Week 98
Week 99
Week 100 1 32153.83215
Week 101
Week 102
Week 103
Week 104 1 32153.83215
Week 105
Week 106
Week 107
Week 108 1 35369.21537
Week 109
Week 110
Week 111
Week 112 1 35369.21537
Week 113
Week 114
Week 115
Week 116 1 35369.21537
Week 117
Week 118
Week 119
Week 120 1 38906.1369
Week 121
Week 122
Week 123
Week 124 1 38906.1369
Week 125
Week 126
Week 127
Week 128 1 38906.1369
Week 129
Week 130
Week 131
Week 132 1 42796.75059
Week 133
Week 134
Week 135
Week 136 1 42796.75059
Week 137
Week 138
Document Page
6JIT/LEAN PRODUCTION, PROCUREMENT AND CONTRACTS
Week 139
Week 140 1 42796.75059
Week 141
Week 142
Week 143
Week 144 1 47076.42565
Week 145
Week 146
Week 147
Week 148 1 47076.42565
Week 149
Week 150
Week 151
Week 152 1 47076.42565
Week 153
Week 154
Week 155
Week 156 1 51784.06822
Week 157
Week 158
Week 159
Week 160 1 51784.06822
Week 161
Week 162
Week 163
Week 164 1 51784.06822
Week 165
Week 166
Week 167
Week 168 1 56962.47504
Week 169
Week 170
Week 171
Week 172 1 56962.47504
Week 173
Week 174
Week 175
Week 176 1 56962.47504
Week 177
Week 178
Week 179
Week 180 1 62658.72254
Required Equipment Cost 5000
Total 45 1482420
tabler-icon-diamond-filled.svg

Paraphrase This Document

Need a fresh take? Get an instant paraphrase of this document with our AI Paraphraser
Document Page
7JIT/LEAN PRODUCTION, PROCUREMENT AND CONTRACTS
Framer Rate 13500 per unit
Average framer increase rate 0% 90 Days
No. of Units to be built 45 2 Years
Cost of Equipment $5,000
Payment terms 30
Time Required (45 Units) 945 Days
Computation of Price to frame Houses at Framer Rate
Particulars Units Amount ($)
Week 1
Week 2
Week 3
Week 4 1 13500
Week 5
Week 6
Week 7
Week 8 1 13500
Week 9
Week 10
Week 11
Week 12 1 13500
Week 13
Week 14
Week 15
Week 16 1 13500
Week 17
Week 18
Week 19
Week 20 1 13500
Week 21
Week 22
Week 23
Week 24 1 13500
Week 25
Week 26
Week 27
Week 28 1 13500
Week 29
Week 30
Week 31
Document Page
8JIT/LEAN PRODUCTION, PROCUREMENT AND CONTRACTS
Week 32 1 13500
Week 33
Week 34
Week 35
Week 36 1 13500
Week 37
Week 38
Week 39
Week 40 1 13500
Week 41
Week 42
Week 43
Week 44 1 13500
Week 45
Week 46
Week 47
Week 48 1 13500
Week 49
Week 50
Week 51
Week 52 1 13500
Week 53
Week 54
Week 55
Week 56 1 13500
Week 57
Week 58
Week 59
Week 60 1 13500
Week 61
Week 62
Week 63
Week 64 1 13500
Week 65
Week 66
Week 67
Week 68 1 13500
Week 69
Week 70
Week 71
Week 72 1 13500
Week 73
Week 74
Week 75
Week 76 1 13500
Week 77
Document Page
9JIT/LEAN PRODUCTION, PROCUREMENT AND CONTRACTS
Week 78
Week 79
Week 80 1 13500
Week 81
Week 82
Week 83
Week 84 1 13500
Week 85
Week 86
Week 87
Week 88 1 13500
Week 89
Week 90
Week 91
Week 92 1 13500
Week 93
Week 94
Week 95
Week 96 1 13500
Week 97
Week 98
Week 99
Week 100 1 13500
Week 101
Week 102
Week 103
Week 104 1 13500
Week 105
Week 106
Week 107
Week 108 1 13500
Week 109
Week 110
Week 111
Week 112 1 13500
Week 113
Week 114
Week 115
Week 116 1 13500
Week 117
Week 118
Week 119
Week 120 1 13500
Week 121
Week 122
Week 123
tabler-icon-diamond-filled.svg

Secure Best Marks with AI Grader

Need help grading? Try our AI Grader for instant feedback on your assignments.
Document Page
10JIT/LEAN PRODUCTION, PROCUREMENT AND CONTRACTS
Week 124 1 13500
Week 125
Week 126
Week 127
Week 128 1 13500
Week 129
Week 130
Week 131
Week 132 1 13500
Week 133
Week 134
Week 135
Week 136 1 13500
Week 137
Week 138
Week 139
Week 140 1 13500
Week 141
Week 142
Week 143
Week 144 1 13500
Week 145
Week 146
Week 147
Week 148 1 13500
Week 149
Week 150
Week 151
Week 152 1 13500
Week 153
Week 154
Week 155
Week 156 1 13500
Week 157
Week 158
Week 159
Week 160 1 13500
Week 161
Week 162
Week 163
Week 164 1 13500
Week 165
Week 166
Week 167
Week 168 1 13500
Week 169
Document Page
11JIT/LEAN PRODUCTION, PROCUREMENT AND CONTRACTS
Week 170
Week 171
Week 172 1 13500
Week 173
Week 174
Week 175
Week 176 1 13500
Week 177
Week 178
Week 179
Week 180 1 13500
Required Equipment Cost 5000
Total 45 612500
Answer to Part B
In case the project start is increased to 45 units per year then the production rate from
three weeks per unit should be increased to 2 weeks per unit. In this proposition, the overall
cost reduction will be seen with 50% in compared to producing 45 units in two years.
Framer Rate 13500 per unit
Average framer increase rate 0% 90 Days
No. of Units to be built 45 1 Year
Cost of Equipment $5,000
Payment terms 30
Time Required (45 Units) 945 Days
Computation of Price to frame Houses at Framer Rate
Particulars Units Amount ($)
Week 1
Week 2 1
Week 3
Week 4 1 13500
Week 5
Week 6 1
Week 7
Week 8 1 13500
Document Page
12JIT/LEAN PRODUCTION, PROCUREMENT AND CONTRACTS
Week 9
Week 10 1
Week 11
Week 12 1 13500
Week 13
Week 14 1
Week 15
Week 16 1 13500
Week 17
Week 18 1
Week 19
Week 20 1 13500
Week 21
Week 22 1
Week 23
Week 24 1 13500
Week 25
Week 26 1
Week 27
Week 28 1 13500
Week 29
Week 30 1
Week 31
Week 32 1 13500
Week 33
Week 34 1
Week 35
Week 36 1 13500
Week 37
Week 38 1
Week 39
Week 40 1 13500
Week 41
Week 42 1
Week 43
Week 44 1 13500
Week 45
Week 46 1
Week 47
Week 48 1 13500
Week 49
Week 50 1
Week 51
Week 52 1 13500
Week 53
Week 54 1
tabler-icon-diamond-filled.svg

Paraphrase This Document

Need a fresh take? Get an instant paraphrase of this document with our AI Paraphraser
Document Page
13JIT/LEAN PRODUCTION, PROCUREMENT AND CONTRACTS
Week 55
Week 56 1 13500
Week 57
Week 58 1
Week 59
Week 60 1 13500
Week 61
Week 62 1
Week 63
Week 64 1 13500
Week 65
Week 66 1
Week 67
Week 68 1 13500
Week 69
Week 70 1
Week 71
Week 72 1 13500
Week 73
Week 74 1
Week 75
Week 76 1 13500
Week 77
Week 78 1
Week 79
Week 80 1 13500
Week 81
Week 82 1
Week 83
Week 84 1 13500
Week 85
Week 86 1
Week 87
Week 88 1 13500
Week 89
Week 90 1
Required Equipment Cost 5000
Total 45 302000
Answer to Part C
Even in case the average market for framing is dropped and stabilised to $13,500 per
unit, it is highly advisable to stick with framer rate. This is due to the fact that the average
Document Page
14JIT/LEAN PRODUCTION, PROCUREMENT AND CONTRACTS
market rate is set to increase by 10% in every 90 days, which is absent in case of entering into
a contract with the framer (Bahmani-Firouzi and Azizipanah-Abarghooee 2014).
Answer to Question 2
Cost of
Materials $6,000
No. of
Units 150
US Tariff
Rate 10%
Individual
Pieces 75000
Total Cost
in Each
Region $81,000
Answer to Part A
The selection of suppliers in each region needs to be based on number of factors.
Firstly, it is important to ensure monitored the sources of spend analysis data. This needs to
be done with the use of general ledger information, internal systems, data shared by the
suppliers and use of “enterprise resource planning (ERP)” tools (Ichinose et al. 2015).
Secondly, the spend analysis KPI should be able to identify the spend of commodity or
category, the number of suppliers by commodity in each region and number of transactions in
a particular region. For example, in case the spend of commodity is too high then that region
should have allocated the maximum number of suppliers that is 4 main suppliers along with
numerous uncontracted operators. The regional selection of supplier should be also based on
average purchase order value. In addition to this, some of the other factors such as spend
analysis and spend visibility needs to be also considered in the selection procedure (CBC
2018).
Document Page
15JIT/LEAN PRODUCTION, PROCUREMENT AND CONTRACTS
Answer to Part B
The cost differences which can be tolerated between each region is seen to range
between 0 to 500 pieces for each material. Therefore, there can be a difference of $ 6000 to $
3000000 depending on the number of units ordered. This consideration is seen to be directly
relevant to Ministry of Transportation in Canada.
Answer to Part C
The recent change brought in PST will vary according to the various types of legal,
political and social and environmental factors. Therefore, the contract of suppliers should be
aware of the aforementioned factors before proceeding with trade.
Answer to Part D
The inclusion of 10% US tariff on exporting these materials will increase the total
cost of export by $ 8,100.
Cost of
Materials $6,000
No. of
Units 150
US Tariff
Rate 10%
Individual
Pieces 75000
Total Cost
in Each
Region $81,000
Cost
Including
Tariff $89,100
Answer to Part E
The terms imply for the contract should be based on national marketing agency which
is responsible for determining the production amount for the individual commodities and
tabler-icon-diamond-filled.svg

Secure Best Marks with AI Grader

Need help grading? Try our AI Grader for instant feedback on your assignments.
Document Page
16JIT/LEAN PRODUCTION, PROCUREMENT AND CONTRACTS
setting of production quotas for each province. Secondly, it is important to consider minimum
prices (Szewczak 2016). The supply managed producers should be safeguarded with
guaranteed minimum price for their products with the help of provincial marketing boards.
Thirdly, the main pillar of supply chain management of the contract should be taken into
account with imposition of high tariffs on the foreign imports which will make goods
expensive for the Canadians. Therefore, the main source of financial problem such as
overproduction can be easily solved (Sievo 2018).
Answer to Question 3
Old Operation
Hourly Customer 15
Customer Served Per Hour 20
Busy Time 75%
Customers in Queue 0
Customers Waiting Time 0
Minutes for his coffee
from the time he/she
comes in 1 Hour
Document Page
17JIT/LEAN PRODUCTION, PROCUREMENT AND CONTRACTS
Answer to Part A
As per the given situation, it needs to be understood that Barista is having sufficient
time for serving new customers. This is depicted with scope of serving 20 customers per hour
while experience shows that 15 customers arrive on an average. Therefore, 75% percent of
the time the restaurant is busy (Joseph et al. 2015).
Answer to Part B
As Barista is having sufficient time for serving new customers, there will be 0
customers waiting in queue. This is seen to be directly relevant to the more occupancy which
is available with the coffee shop. Moreover, in every hour there can be an additional scope of
5 customers created for the coffee shop.
Answer to Part C
The customers will be having waiting time of zero minutes while minutes for his
coffee from the time he/she comes in is depicted as 1 hour. As the restaurant is having
sufficient provision for additional customers. The minimum time for serving is depicted to be
1 hour from serving of the coffee from the time he/she comes in at the coffee shop.
Answer to Part D
New Operation
Hourly Customer 20
Customer Served Per
Hour 15
Busy Time 133%
Customers in Queue 5
Customers Waiting
Time 12
Document Page
18JIT/LEAN PRODUCTION, PROCUREMENT AND CONTRACTS
Minutes for his coffee
from the time he/she
comes in
1 Hour 12
Mins
In case of hiring a new junior barista, the customer served per hour has reduced than
the expected average hourly customer. This will lead to increased pressure in terms of the
time the coffee shop is busy. Therefore, it will be busy percentage is depicted as 133%. In
addition to this, there will be five customers waiting in queue in every hour and the waiting
time for each customer is seen as 12 minutes (Keahey, Riteau and Timkovich 2017).
tabler-icon-diamond-filled.svg

Paraphrase This Document

Need a fresh take? Get an instant paraphrase of this document with our AI Paraphraser
Document Page
19JIT/LEAN PRODUCTION, PROCUREMENT AND CONTRACTS
References
Bahmani-Firouzi, B. and Azizipanah-Abarghooee, R., 2014. Optimal sizing of battery energy
storage for micro-grid operation management using a new improved bat
algorithm. International Journal of Electrical Power & Energy Systems, 56, pp.42-54.
CBC. 2018. Supply management in Canada — a primer | CBC News. [online] Available at:
https://www.cbc.ca/news/politics/canada-supply-management-explainer-1.4708341
[Accessed 21 Oct. 2018].
Ichinose, R., Sato, T., Masuda, A., Yamamoto, K., Yukihiko, O.N.O. and Oshima, A.,
Hitachi Ltd, 2015. Use-Assisting Tool for Autonomous Mobile Device, Operation
Management Center, Operation System, and Autonomous Mobile Device. U.S. Patent
Application 14/419,681.
Joseph, S.H.I., WILLIAMS, S.E., Xu, Y. and Yudenfriend, H.M., International Business
Machines Corp, 2015. Input/output operation management in a device mirror relationship.
U.S. Patent Application 13/960,503.
Keahey, K., Riteau, P. and Timkovich, N.P., 2017, December. LambdaLink: an Operation
Management Platform for Multi-Cloud Environments. In Proceedings of the10th
International Conference on Utility and Cloud Computing (pp. 39-46). ACM.
Mohammadi, S., Soleymani, S. and Mozafari, B., 2014. Scenario-based stochastic operation
management of microgrid including wind, photovoltaic, micro-turbine, fuel cell and energy
storage devices. International Journal of Electrical Power & Energy Systems, 54, pp.525-
535.
Sievo, S. 2018. Spend Analysis 101 | Comprehensive Guide for Beginners | Sievo. [online]
Sievo. Available at: https://sievo.com/resources/spend-analysis-101 [Accessed 21 Oct. 2018].
Document Page
20JIT/LEAN PRODUCTION, PROCUREMENT AND CONTRACTS
Szewczak, K., 2016. FIXED ASSETS OPERATION MANAGEMENT IN ENTERPRISE IN
CONDITIONS OF THE XXI CENTURY ECONOMY. Journal of Management, (1), p.30.
chevron_up_icon
1 out of 21
circle_padding
hide_on_mobile
zoom_out_icon
[object Object]