Data 2301: JJ Esquire Website Analytics Report (Jan-Mar 2019)
VerifiedAdded on 2023/01/10
|12
|1912
|80
Report
AI Summary
This report presents an analysis of the JJ Esquire website's performance using Adobe Analytics for the period of January, February, and March 2019. It examines key metrics such as page views, visits, unique visitors, and revenue trends, highlighting patterns and anomalies. The report includes custom reports generated from the Adobe Analytics tool, providing graphical representations of data. The analysis identifies correlations between website activity and external factors, such as weekend effects and promotional periods. Based on the findings, the report offers several business recommendations, including improving website usability, implementing targeted calls to action, and enhancing product page attractiveness. Additional recommendations include engaging visitors during weekends, creating social and interactive content, and employing effective search engine optimization (SEO) strategies to increase website traffic and conversion rates. The report concludes by emphasizing the importance of continuous website improvement and adaptation to enhance e-commerce success.
Running head: FUNDAMENTAL OF DIGITAL MARKETING 0
FUNDAMENTAL OF DIGITAL MARKETING
Name of Student
Institution affiliation
0
FUNDAMENTAL OF DIGITAL MARKETING
Name of Student
Institution affiliation
0
Paraphrase This Document
Need a fresh take? Get an instant paraphrase of this document with our AI Paraphraser
FUNDAMENTAL OF DIGITAL MARKETING 1
INTRODUCTION
In todays’ era of computerization, businesses have found it very important to depend on
emerging trends in computing as a way of enhancing their profits and saving time and resources
that in the past went towards paying highly skilled analysts. Business and analytics are two much
related fields. The best and most effective tool computing tool serving the businesses is cloud
computing. Adobe Analytics Marketing Cloud tool is one of the most effective tool in business
analytics. In the current task, the tool offers assistance in remitting valuable data that leads to the
interpretation of the e-commerce website, JJ Esquire. Numerous reports of key metrics are
derived from the Adobe Analytics tools and the results analyzed and recommendations offered.
The report is based on the results from January, February and March 2019.
CUSTOM REPORTS
The Adobe Analytics tool has covered all the possible metrics of the JJ Esquire website.
The metrics include the page views, client retention, revenue, search devices, visitor numbers
sales and many more. The graphs below are examples of the kind of data captured from the cloud
computing tool.
FUNDAMENTAL OF DIGITAL MARKETING 2
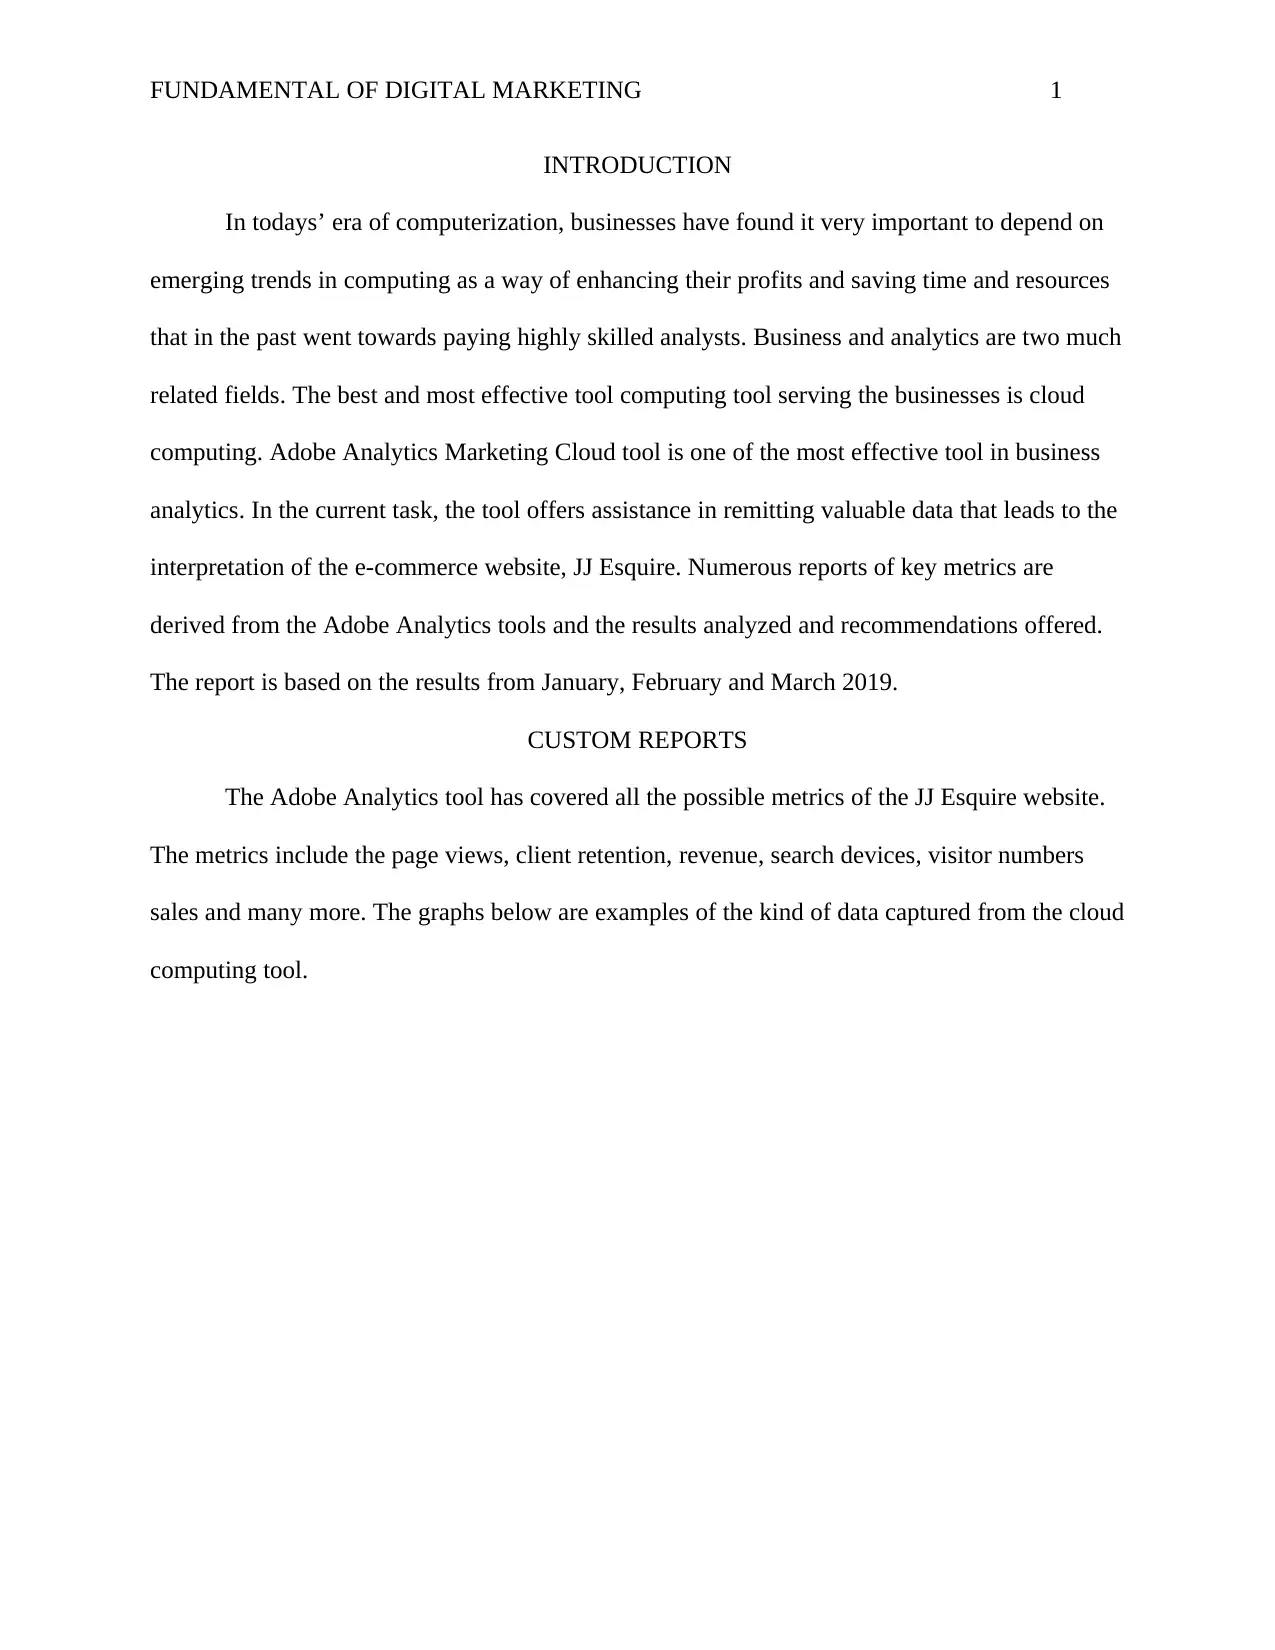
PAGE VIEWS, VISITS AND UNIQUE VISITORS
Graph 1.1: JJ Esquire’s Page Views, Visits and Unique Visitors for the month of January
2019 derived from Adobe Marketing Cloud (2019).
PAGE VIEWS, VISITS AND UNIQUE VISITORS
Graph 1.1: JJ Esquire’s Page Views, Visits and Unique Visitors for the month of January
2019 derived from Adobe Marketing Cloud (2019).
⊘ This is a preview!⊘
Do you want full access?
Subscribe today to unlock all pages.
Trusted by 1+ million students worldwide
FUNDAMENTAL OF DIGITAL MARKETING 3
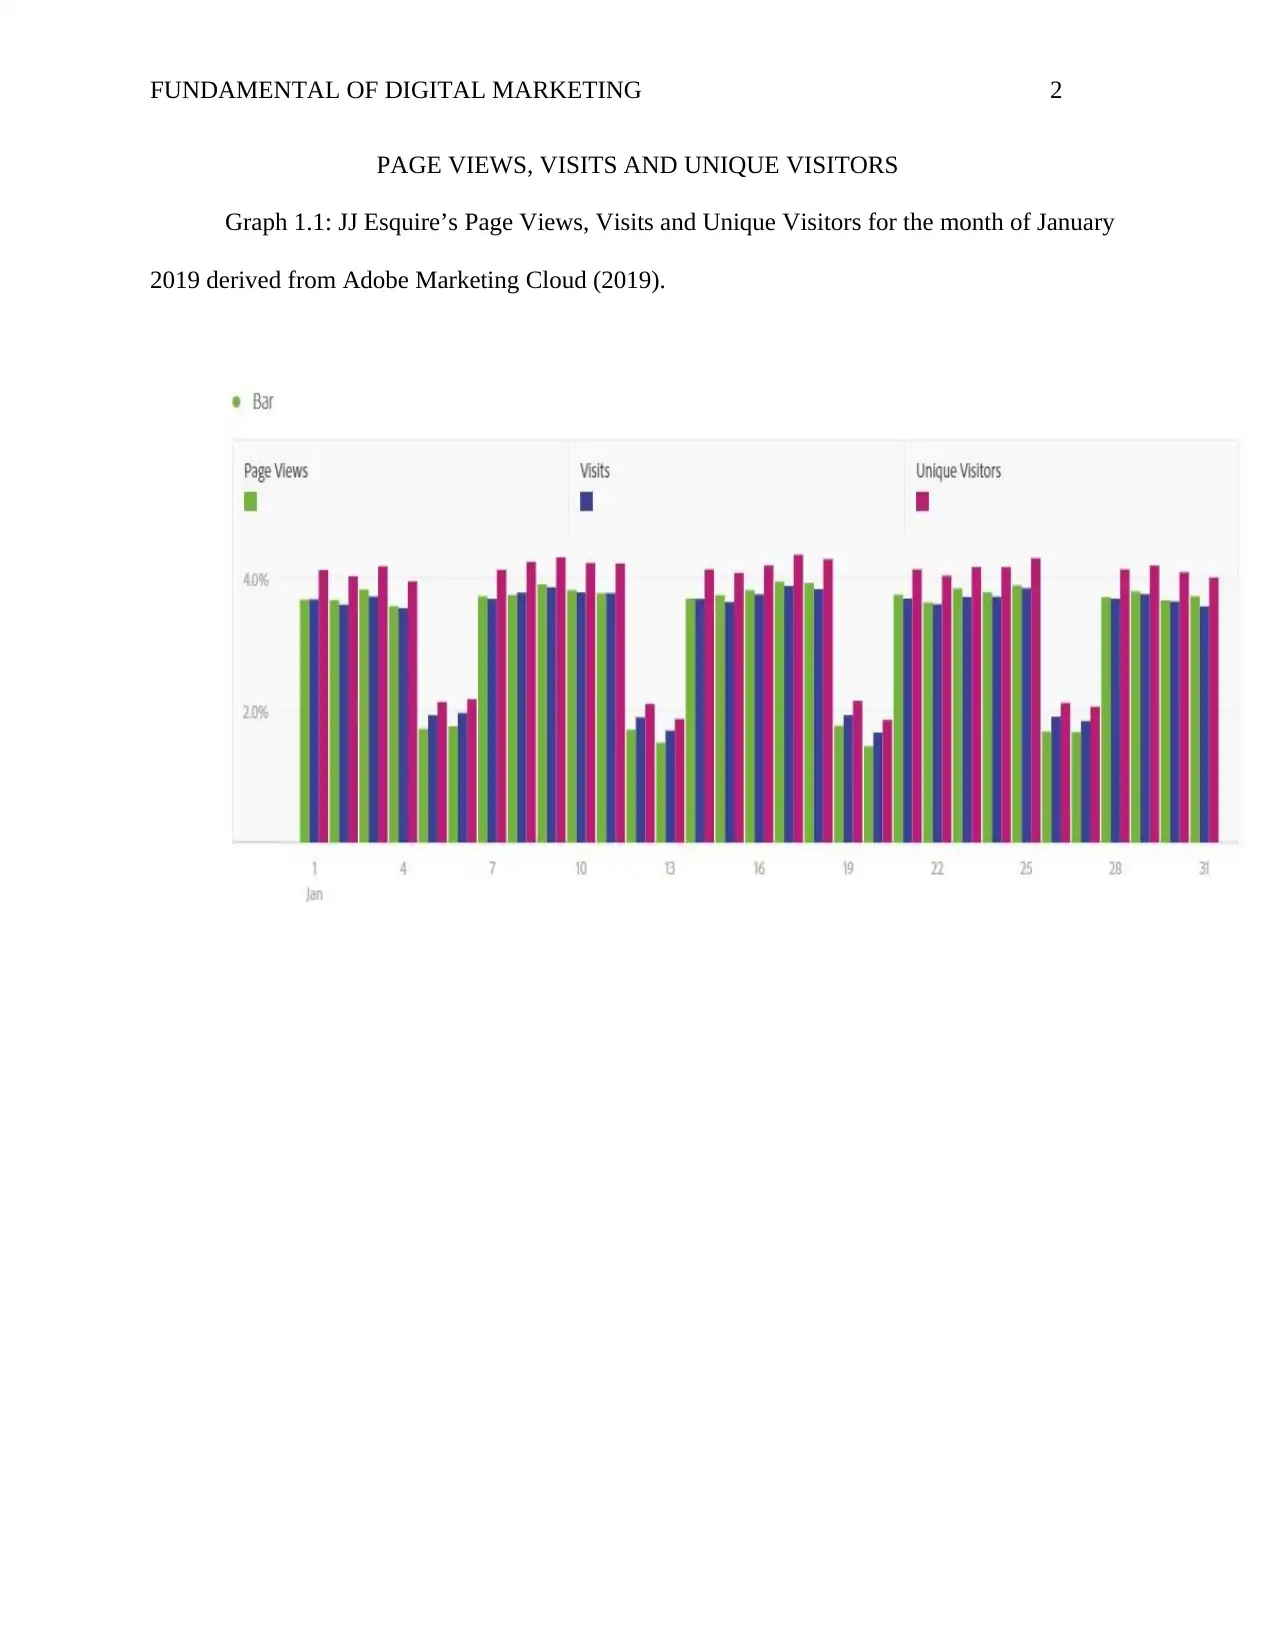
Graph 1.2: JJ Esquire’s Page Views, Visits and Unique Visitors for the month of
February 2019 derived from Adobe Marketing Cloud (2019).
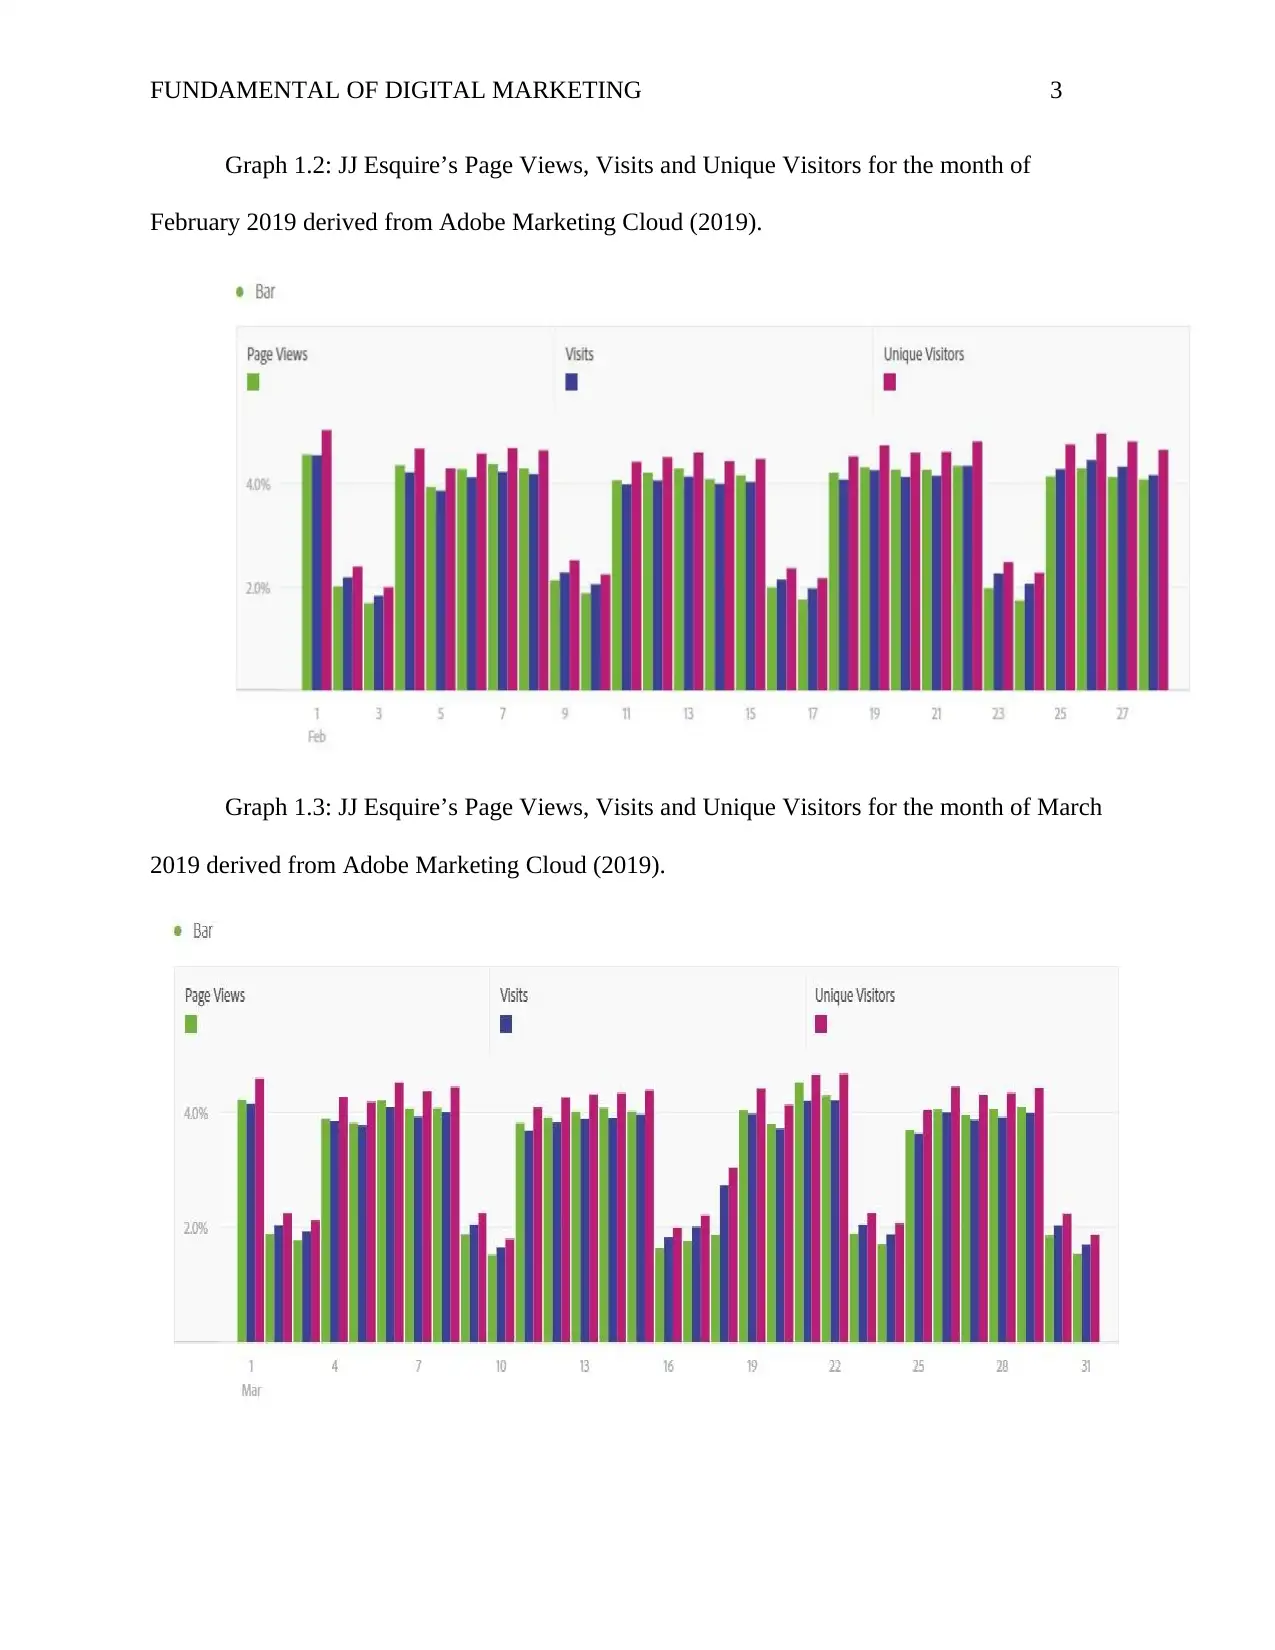
Graph 1.3: JJ Esquire’s Page Views, Visits and Unique Visitors for the month of March
2019 derived from Adobe Marketing Cloud (2019).
Graph 1.2: JJ Esquire’s Page Views, Visits and Unique Visitors for the month of
February 2019 derived from Adobe Marketing Cloud (2019).
Graph 1.3: JJ Esquire’s Page Views, Visits and Unique Visitors for the month of March
2019 derived from Adobe Marketing Cloud (2019).
Paraphrase This Document
Need a fresh take? Get an instant paraphrase of this document with our AI Paraphraser
FUNDAMENTAL OF DIGITAL MARKETING 4
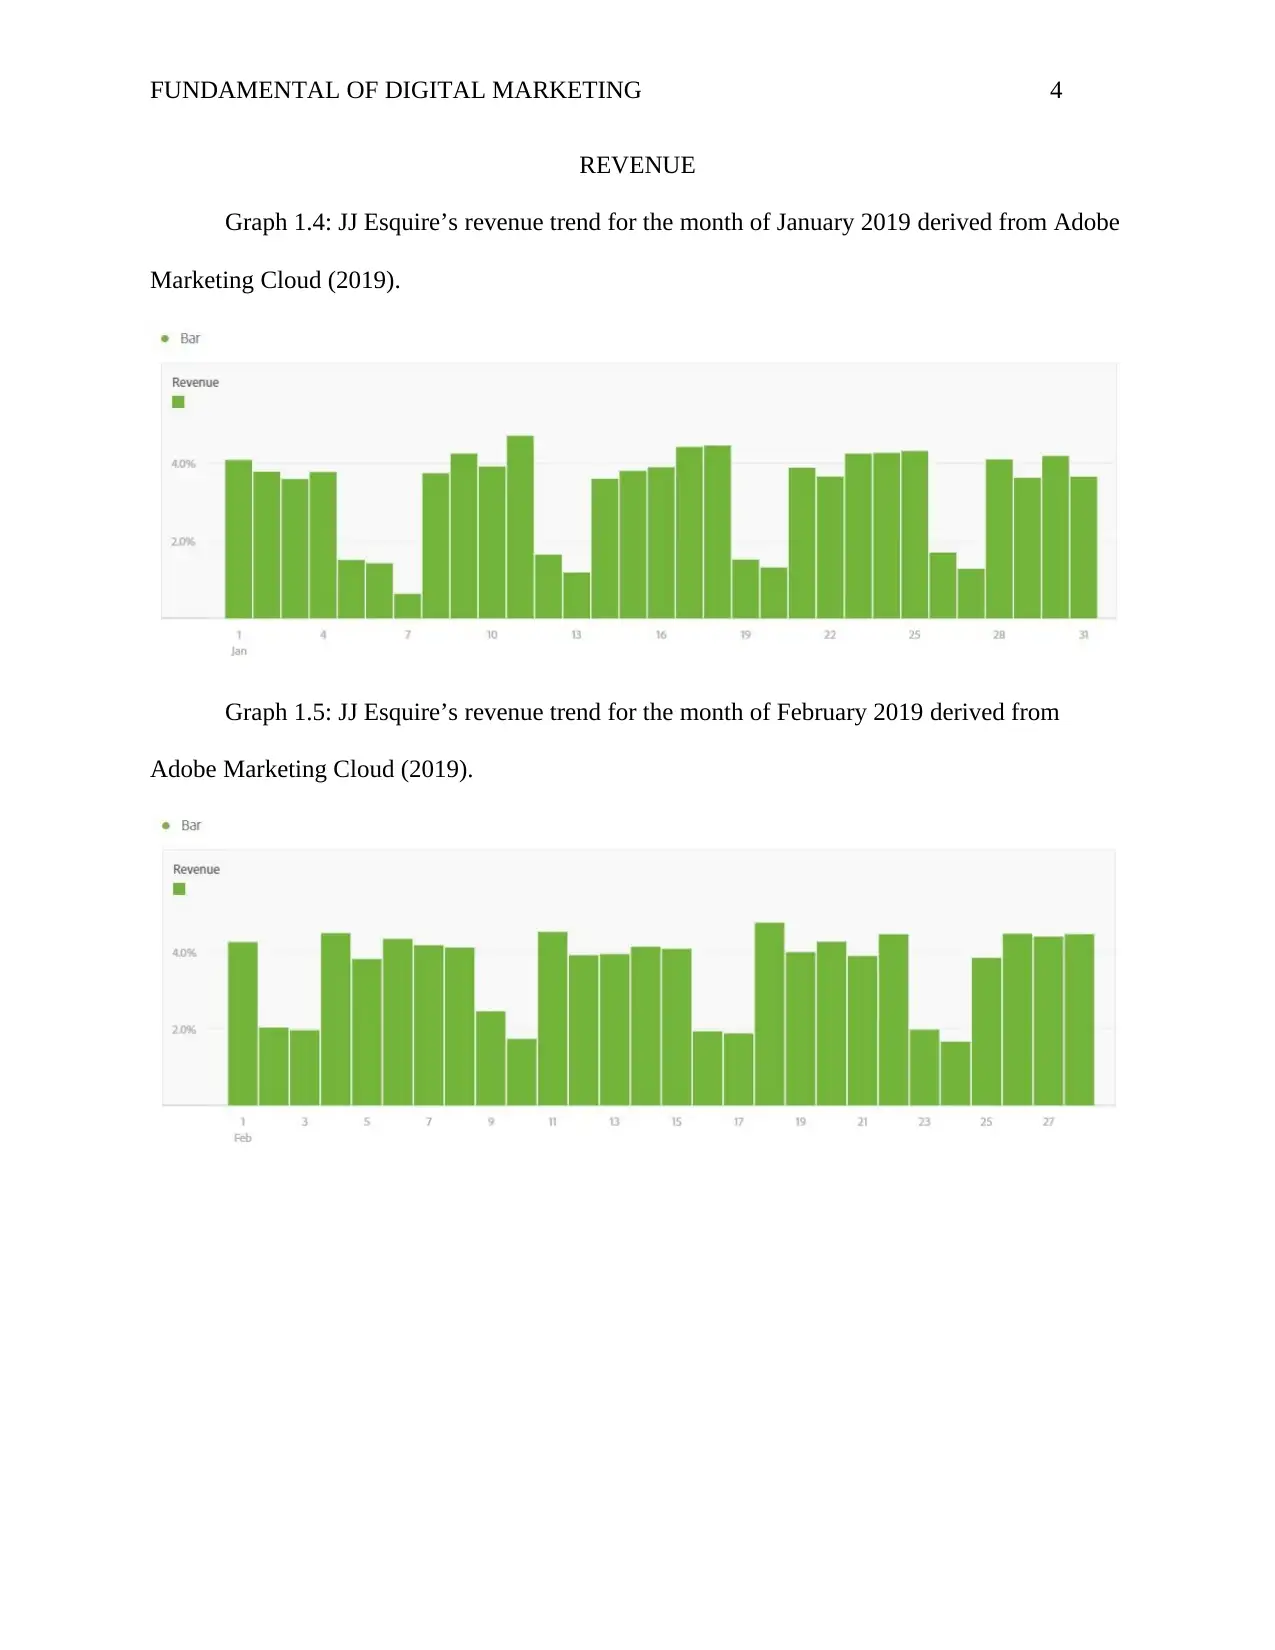
REVENUE
Graph 1.4: JJ Esquire’s revenue trend for the month of January 2019 derived from Adobe
Marketing Cloud (2019).
Graph 1.5: JJ Esquire’s revenue trend for the month of February 2019 derived from
Adobe Marketing Cloud (2019).
REVENUE
Graph 1.4: JJ Esquire’s revenue trend for the month of January 2019 derived from Adobe
Marketing Cloud (2019).
Graph 1.5: JJ Esquire’s revenue trend for the month of February 2019 derived from
Adobe Marketing Cloud (2019).
FUNDAMENTAL OF DIGITAL MARKETING 5
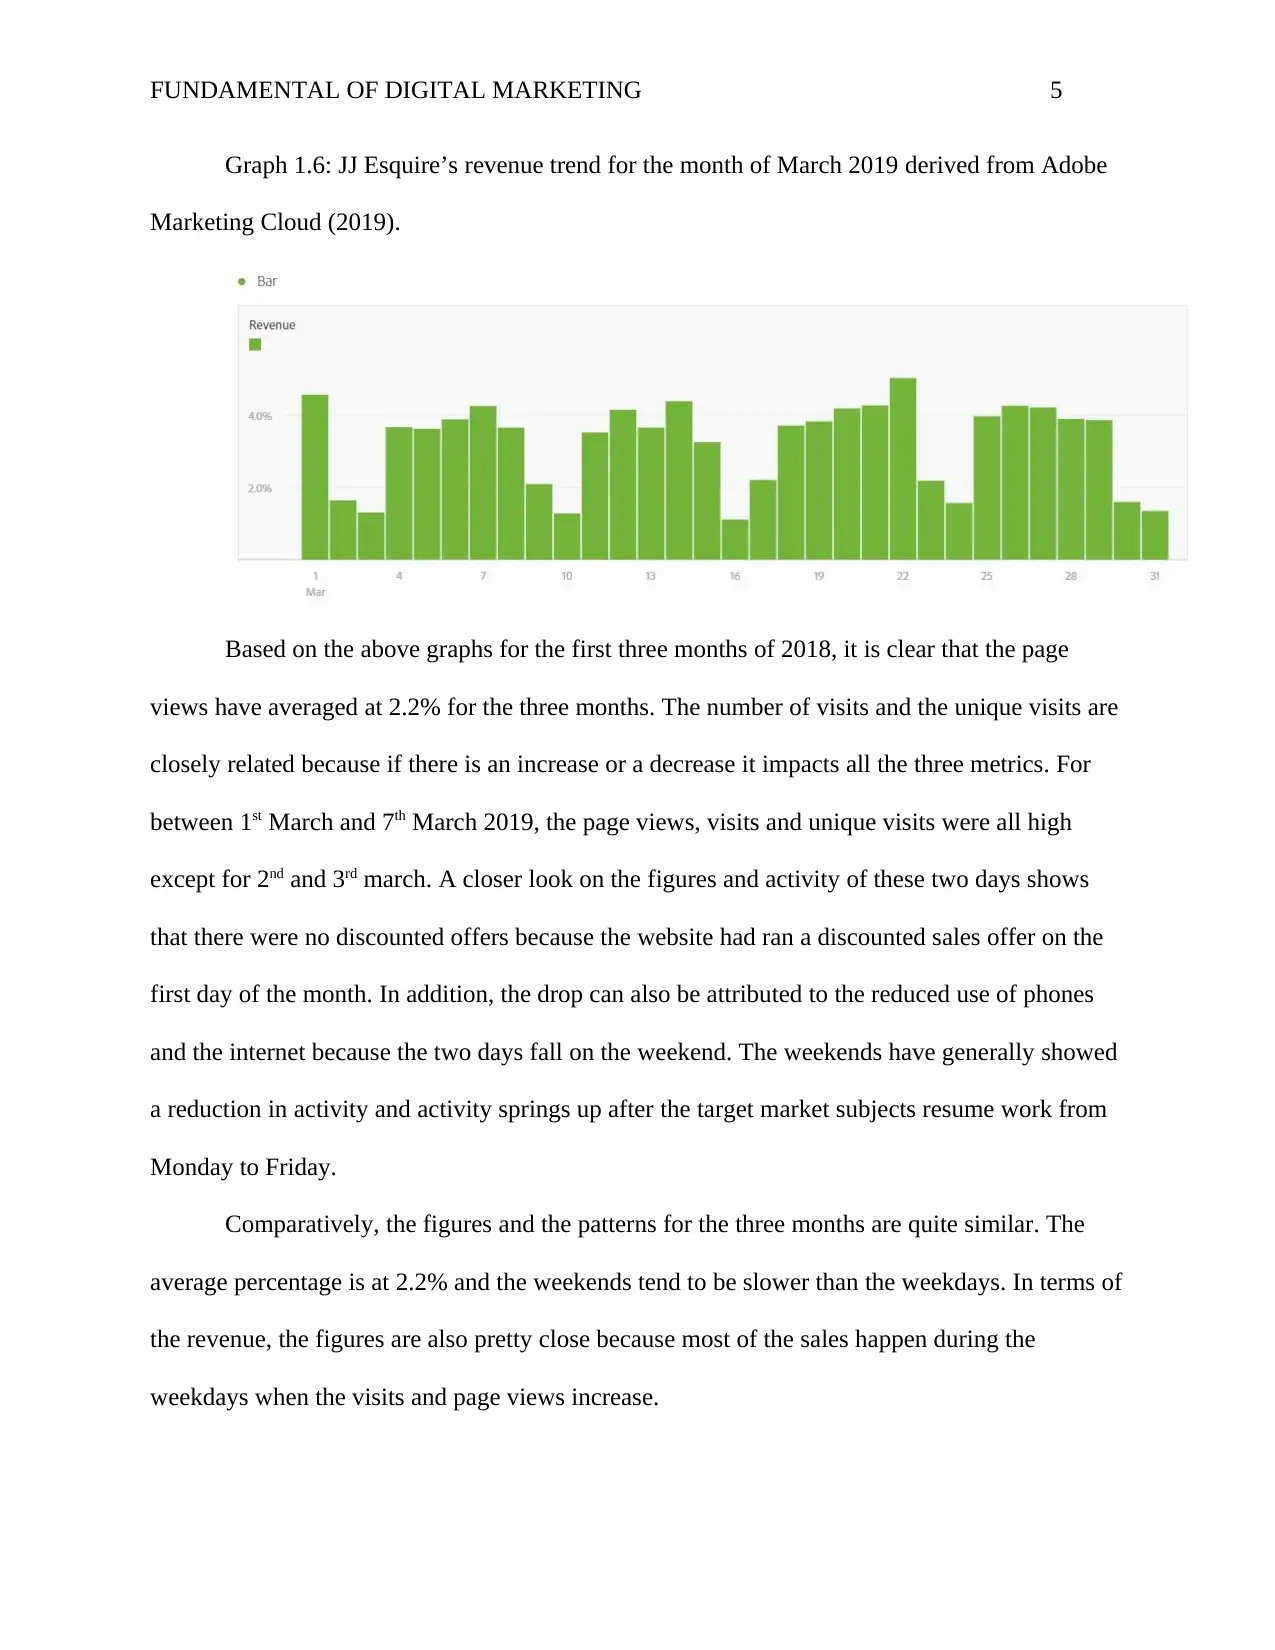
Graph 1.6: JJ Esquire’s revenue trend for the month of March 2019 derived from Adobe
Marketing Cloud (2019).
Based on the above graphs for the first three months of 2018, it is clear that the page
views have averaged at 2.2% for the three months. The number of visits and the unique visits are
closely related because if there is an increase or a decrease it impacts all the three metrics. For
between 1st March and 7th March 2019, the page views, visits and unique visits were all high
except for 2nd and 3rd march. A closer look on the figures and activity of these two days shows
that there were no discounted offers because the website had ran a discounted sales offer on the
first day of the month. In addition, the drop can also be attributed to the reduced use of phones
and the internet because the two days fall on the weekend. The weekends have generally showed
a reduction in activity and activity springs up after the target market subjects resume work from
Monday to Friday.
Comparatively, the figures and the patterns for the three months are quite similar. The
average percentage is at 2.2% and the weekends tend to be slower than the weekdays. In terms of
the revenue, the figures are also pretty close because most of the sales happen during the
weekdays when the visits and page views increase.
⊘ This is a preview!⊘
Do you want full access?
Subscribe today to unlock all pages.
Trusted by 1+ million students worldwide
FUNDAMENTAL OF DIGITAL MARKETING 6
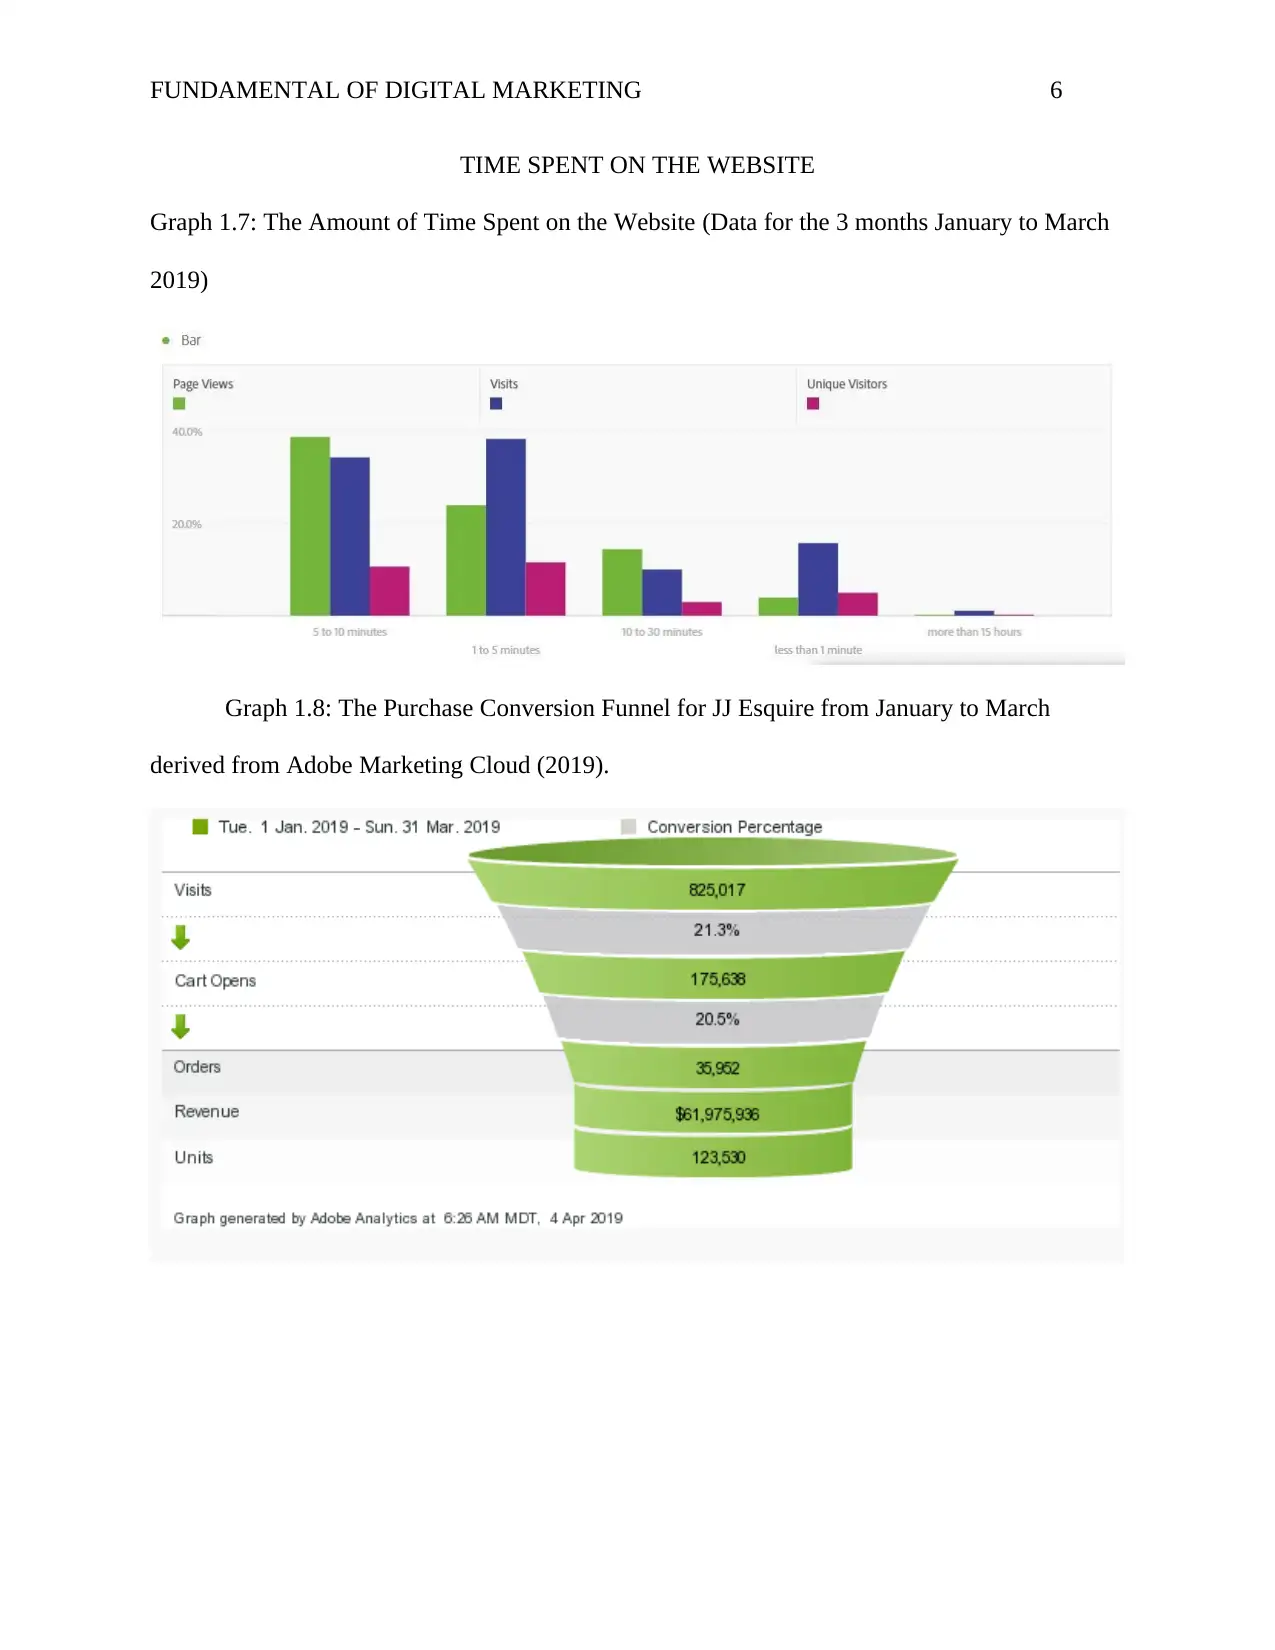
TIME SPENT ON THE WEBSITE
Graph 1.7: The Amount of Time Spent on the Website (Data for the 3 months January to March
2019)
Graph 1.8: The Purchase Conversion Funnel for JJ Esquire from January to March
derived from Adobe Marketing Cloud (2019).
TIME SPENT ON THE WEBSITE
Graph 1.7: The Amount of Time Spent on the Website (Data for the 3 months January to March
2019)
Graph 1.8: The Purchase Conversion Funnel for JJ Esquire from January to March
derived from Adobe Marketing Cloud (2019).
Paraphrase This Document
Need a fresh take? Get an instant paraphrase of this document with our AI Paraphraser
FUNDAMENTAL OF DIGITAL MARKETING 7
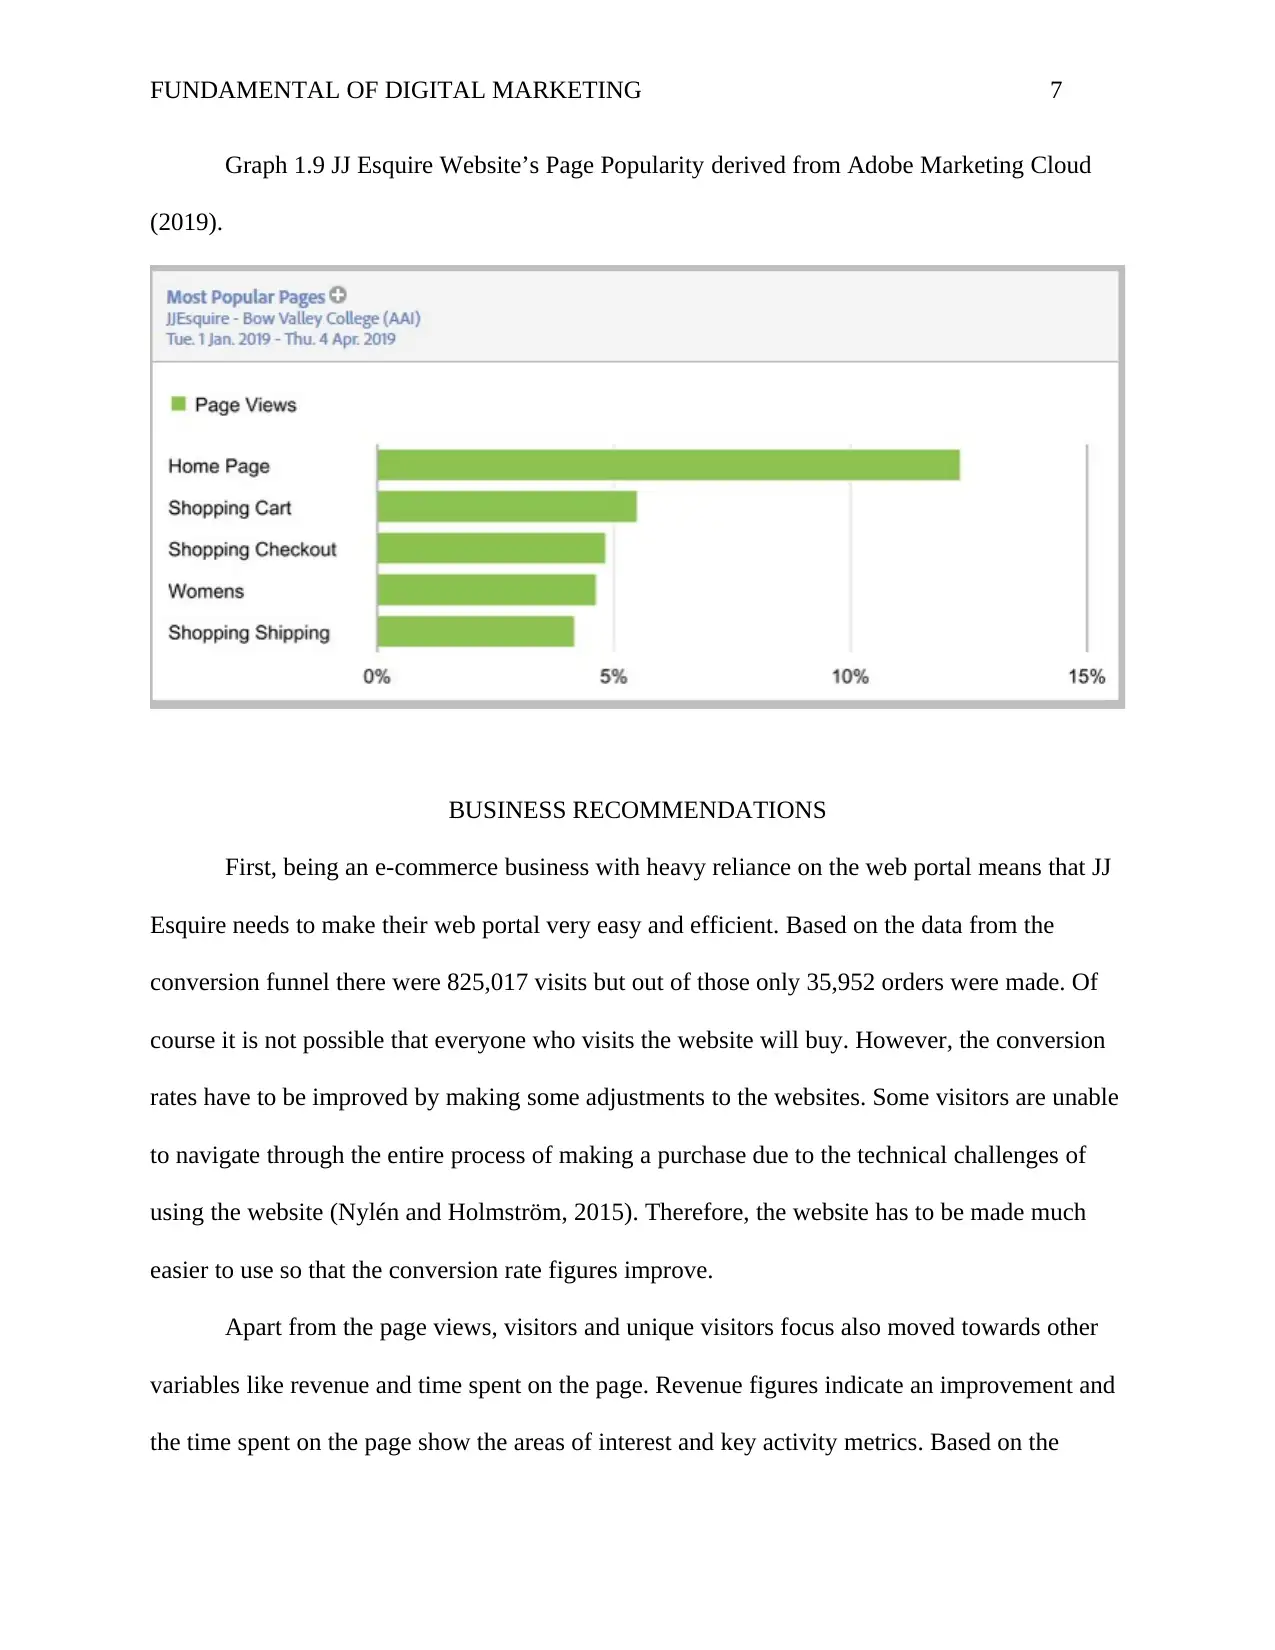
Graph 1.9 JJ Esquire Website’s Page Popularity derived from Adobe Marketing Cloud
(2019).
BUSINESS RECOMMENDATIONS
First, being an e-commerce business with heavy reliance on the web portal means that JJ
Esquire needs to make their web portal very easy and efficient. Based on the data from the
conversion funnel there were 825,017 visits but out of those only 35,952 orders were made. Of
course it is not possible that everyone who visits the website will buy. However, the conversion
rates have to be improved by making some adjustments to the websites. Some visitors are unable
to navigate through the entire process of making a purchase due to the technical challenges of
using the website (Nylén and Holmström, 2015). Therefore, the website has to be made much
easier to use so that the conversion rate figures improve.
Apart from the page views, visitors and unique visitors focus also moved towards other
variables like revenue and time spent on the page. Revenue figures indicate an improvement and
the time spent on the page show the areas of interest and key activity metrics. Based on the
FUNDAMENTAL OF DIGITAL MARKETING 8
assessment of these variables’ metrics, the company needs to involve professional website
developers to increase the time spent on the website and to also ensure that such leads to an
increase in revenue.
Next, the business managers, through the website should help customers make their
decisions on the products they need to acquire. In doing this, the business should come up with
very precise call to action in form of advertising (Carmona et al 2012). The recommendation is
important because based on the data received from the Adobe Analytic tool, the users are
spending an average of 5 to 10 minutes before making a purchase. Of course some spend that
much time choosing the products, but still that could be made faster by including the calls to
action strategies (Li and Li, 2011). The calls to action must be well presented on the website and
all information about them should be very concise. The clients must be well guided on where to
click and the sales support team must be on call at any given time to offer guidance.
Another vital recommendation that JJ Esquire must take into consideration is that they
should endeavor to create great product web pages for their website. As shown in the graph 1.9
relating to page popularity, it is clear that most people exit the website after checking the
homepage. The fact that they will not check other pages is a need for concern. The products
pages need to be made more attractive because they are the pages that have the items on sale.
The best way is to improve their interactivity so that more persons who visit the homepage also
click on them to check out JJ Esquire's product catalogue.
RECOMMENDATIONS
Based on the comparative analysis for the three months, the writer recommends that the
sales and marketing team at JJ Esquire find a way of engaging the visitors during the weekends
and holidays. There are numerous ways this can be done. A good example would be to have
⊘ This is a preview!⊘
Do you want full access?
Subscribe today to unlock all pages.
Trusted by 1+ million students worldwide
FUNDAMENTAL OF DIGITAL MARKETING 9
some good offers, discounts, treasure hunts and similar activities that will make regular and new
unique visitors check the websites during these days (Ghandour, Benwell and Deans, 2011). The
activities will surely increase the page views and make the website much busier and rake in more
revenue for JJ Esquire.
Secondly, the website content management team needs to get more social. As (Verma et
al. 2015) and (Eid, 2011) recommend, website content has to be very social because people tend
to be gravitated towards social content as opposed to more formal content. As a
recommendation, the website should have social and interactive videos, chats, and more people-
related content that will appeal to the visitors. There is no one single strategy for social content
but the website content managers have to try several possibilities and see what works best based
on the impact (Sambhanthan and Good, 2012).
Lastly, JJ Esquire needs to use more targeted and appealing search engine optimization
(SEO) strategies. As (Gao, 2013) advises, SEO is no longer optional for e-commerce websites. It
is an important part of e-commerce and it surely increases web traffic greatly. The team in
charge of the website should use them effectively because that is the surest way of capturing new
visits from different search engines and devices.
Paraphrase This Document
Need a fresh take? Get an instant paraphrase of this document with our AI Paraphraser
FUNDAMENTAL OF DIGITAL MARKETING 10
REFERENCES
Adobe Marketing Cloud. (2019). Retrieved from https://www.adobe.com/marketing-
cloud.html
Carmona, C. J., Ramírez-Gallego, S., Torres, F., Bernal, E., del Jesús, M. J., & García, S.
(2012). Web usage mining to improve the design of an e-commerce website: OrOliveSur.
com. Expert Systems with Applications, 39(12), 11243-11249.
Eid, M. I. (2011). Determinants of e-commerce customer satisfaction, trust, and loyalty in
Saudi Arabia. Journal of electronic commerce research, 12(1), 78.
Gao, R., Hao, B., Bai, S., Li, L., Li, A., & Zhu, T. (2013, October). Improving user
profile with personality traits predicted from social media content. In Proceedings of the 7th
ACM conference on Recommender systems (pp. 355-358). ACM.
Ghandour, A., Benwell, G., & Deans, K. R. (2011). Measuring the performance of
ecommerce websites–An owner’s perspective. Pacific Asia Journal of the Association for
Information Systems, 3(1).
Li, F., & Li, Y. (2011). Usability evaluation of e-commerce on B2C websites in
China. Procedia Engineering, 15, 5299-5304.
Nylén, D., & Holmström, J. (2015). Digital innovation strategy: A framework for
diagnosing and improving digital product and service innovation. Business Horizons, 58(1), 57-
67.
Sambhanthan, A., & Good, A. (2012). Implications for improving accessibility to e-
commerce websites in developing countries: a study of hotel websites. International Journal of
Knowledge-Based Organizations (IJKBO), 2(2), 1-20.

FUNDAMENTAL OF DIGITAL MARKETING 11
Verma, N., Malhotra, D., Malhotra, M., & Singh, J. (2015). E-commerce website ranking
using semantic web mining and neural computing. Procedia Computer Science, 45, 42-51.
Verma, N., Malhotra, D., Malhotra, M., & Singh, J. (2015). E-commerce website ranking
using semantic web mining and neural computing. Procedia Computer Science, 45, 42-51.
⊘ This is a preview!⊘
Do you want full access?
Subscribe today to unlock all pages.
Trusted by 1+ million students worldwide
1 out of 12
Your All-in-One AI-Powered Toolkit for Academic Success.
+13062052269
info@desklib.com
Available 24*7 on WhatsApp / Email
![[object Object]](/_next/static/media/star-bottom.7253800d.svg)
Unlock your academic potential
Copyright © 2020–2026 A2Z Services. All Rights Reserved. Developed and managed by ZUCOL.