JMD1366 Management Accounting 1: Regression, Cost Analysis Report
VerifiedAdded on 2024/05/14
|12
|2590
|286
Report
AI Summary
This report explores management accounting principles, specifically focusing on the application of regression analysis for understanding and forecasting cost overheads. It examines the relationship between direct labor hours and total overheads, providing calculations and interpretations based on a given dataset. The analysis includes determining overhead costs for specific landscaping projects and evaluating the reasonableness of cost estimations. The report also discusses the role of regression analysis in predicting future costs, aiding managerial decision-making, and optimizing resource allocation. Recommendations emphasize the importance of accurate data and the widespread application of regression analysis for effective financial management. Desklib offers a platform to explore similar documents and study resources.

Management Accounting
1
1
Paraphrase This Document
Need a fresh take? Get an instant paraphrase of this document with our AI Paraphraser
Contents
Part I.................................................................................................................................................3
Q.1................................................................................................................................................3
Q.2................................................................................................................................................3
Q3.................................................................................................................................................3
Q.4................................................................................................................................................3
Part2.................................................................................................................................................4
Introduction.................................................................................................................................4
Regression Analysis......................................................................................................................4
Regression analysis serve the following purposes.......................................................................5
Recommendation.........................................................................................................................7
Conclusion....................................................................................................................................8
References.......................................................................................................................................9
2
Part I
Q.1
Y = total overheads = 25901.05 + 10.60 * total labour hours
It implies that for each unit decrease in total direct labour hours, total overheads increase with
10.60 units.
Q.2
For 500 square metres of landscaping, 6 direct labour hours will be needed and accordingly
overhead cost, being dependent on labour hours, will be charged accordingly.
Taking the regression equation into consideration, total overhead costs will be computed.
Overhead cost for 6 direct labour hours will be 10.60*6 = 63.6.
Direct material cost and direct labour cost amounting $500 and $126 will remain same. Total
cost will be = (500+126+63.6) = $689.6.
Q3.
The primary assumption of estimation of total $19 has been made on the basis of traditional
assumptions and practices that are prevalent. However these are not reasonable to assume.
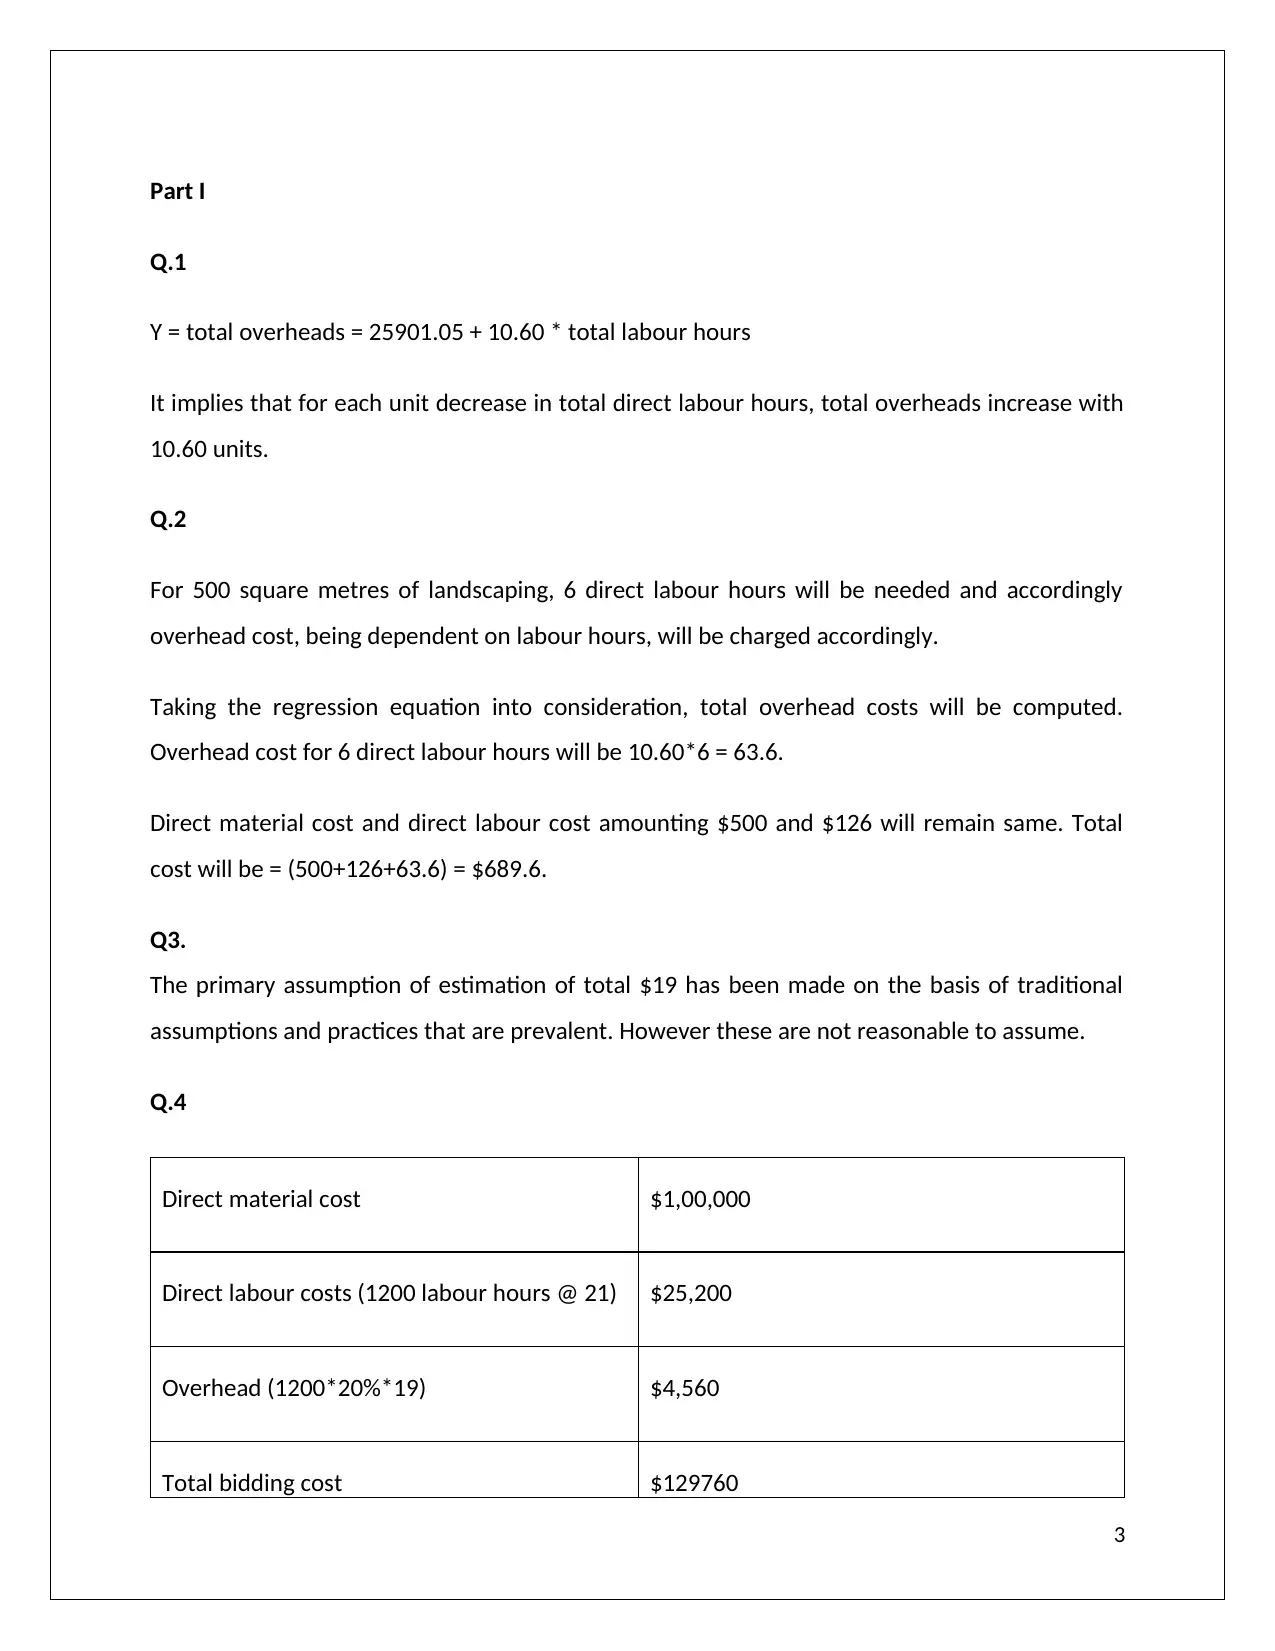
Q.4
Direct material cost $1,00,000
Direct labour costs (1200 labour hours @ 21) $25,200
Overhead (1200*20%*19) $4,560
Total bidding cost $129760
3
Q.1
Y = total overheads = 25901.05 + 10.60 * total labour hours
It implies that for each unit decrease in total direct labour hours, total overheads increase with
10.60 units.
Q.2
For 500 square metres of landscaping, 6 direct labour hours will be needed and accordingly
overhead cost, being dependent on labour hours, will be charged accordingly.
Taking the regression equation into consideration, total overhead costs will be computed.
Overhead cost for 6 direct labour hours will be 10.60*6 = 63.6.
Direct material cost and direct labour cost amounting $500 and $126 will remain same. Total
cost will be = (500+126+63.6) = $689.6.
Q3.
The primary assumption of estimation of total $19 has been made on the basis of traditional
assumptions and practices that are prevalent. However these are not reasonable to assume.
Q.4
Direct material cost $1,00,000
Direct labour costs (1200 labour hours @ 21) $25,200
Overhead (1200*20%*19) $4,560
Total bidding cost $129760
3
⊘ This is a preview!⊘
Do you want full access?
Subscribe today to unlock all pages.
Trusted by 1+ million students worldwide

4
Paraphrase This Document
Need a fresh take? Get an instant paraphrase of this document with our AI Paraphraser
Part2.
Report
Introduction
The report has been designed to understand the impact of cost deriving factors by calculating
the regression equation from the given data. The calculation of the data will help in the making
future forecasts about the cost overheads and their impact over the products that are
produced by the company. In the manufacturing of a product various variable and fixed cost are
involved which has the effect of increasing and decreasing the total cost of the products of the
company. Therefore the entire cost overheads is part of the forecasting about the product. The
report is likely to cover the regression of the statistical measures derived from the variable
heads and non-variable heads.
Regression Analysis
It is a process and mechanism through which the relation among the different variable are
calculated and understood. There are various tools and techniques that are used for the
purpose of understanding the relation between the one dependent variable and another
independent variable (Seber & Lee, 2012). The analysis above stated help in understanding as
to how the value of the dependent variable fluctuates when there is change in the independent
variable. Regression analysis is a tool that is widely used for the purpose of making forecasting
and production in case of overlapping. It further helps in understanding as to which
independent variable is related to the dependent viable and it also helps ion focusing on the
exploration of these forms of relations (Montgomery, et. al., 2012). Many techniques have been
developed which includes the linear regression, simple regression and ordinary least squares.
The various regression modes are developed for calculating the regression analysis and it
includes:
Unknown Parameters which is denoted by β. It is used for representing the scalar or
vector.
Another one is independent variable which is denoted by X.
5
The dependent variable is denoted by Y.
There are two techniques of regression analysis one is Liner and another is non linier. Linear
regression analysis further includes the Simple linear and multiple linear analysis (Sen &
Srivastava, 2012). The simple linear regression analysis is used for the purpose of study of
relation that subsist between dependent and independent variables.
The nonlinear method is used for the purpose of studying the nonlinear relation that subsist
between two or more variables like labour and raw material. The nonlinear regression has
further subheads which includes:
Polynomial regression.
Logistic regression.
Power model regression.
Weibull growth model regression.
Exponential regression
Poisson regression (Müller, 2012)
For the calculation of the regression in the given question involves the 12 months overheads
with 703000 and includes the direct labour hours that is utilised for the production of the
products of the company and overtimes that they give in the production activity for meeting
the urgent demand. For the purpose of solving the given purpose of forecasting the cost off the
goods the following formula was applied.
Y= ax + b
In the given formula Y was used for the purpose of denoting the total overheads for the given
time period of 12 moths and the same was calculated as 25901.05 and the total labour hours
wee multiplied with the total units which were 10.6. 0on the basis of calculation of the given
data it has been arrived at that if the total direct labour hours of the workers is decreased than
there will be increase in the total overheads of the company with the 10.60 units.
6
⊘ This is a preview!⊘
Do you want full access?
Subscribe today to unlock all pages.
Trusted by 1+ million students worldwide
Regression analysis serve the following purposes
1. Regression analysis is one of the tool of predicting the future of the product of the
entire company., it is best suited to the small business organisation which can with the
help of it can make predictions about the change in the demand of the customers, taxes
that are changed by the government and the various shift that takes place in the
economy of the country (Atkinson & Riani, 2012)
2. It is also used as biggest tool of the decision making by the small and medium term
business organisations. Since the previous data are used for the purpose of making the
various analysis and on the basis of that future predictions are made they always serve
the right data for basing them for the important decision that are taken in the business
organisation.
3. The calculative analysis that are made in this system on the basis of the variable and
non-variable heads of factors forming the cost also helping in making the various
managerial decisions in right direction as well as in changing the strategic planning
(Gupta, et. al., 2012).
4. Since the real data will be taken for study of change in variable head and one non
variable head it will help in making analysis as to which variable and non-variable
combination will be fit for the future purposes so that in the less time and less efforts
and material the same can be manufactured by maintaining the high quality of the
products. Thus it also helps in making the efficient work process,
Therefore regression analysis is important for the business prospective since the cost that is
incurred in the production of the goods and services in the preceding year is made basis for the
purpose of understanding thee relation between the various heads of cost. It help is
understanding as to how the change in one variable head will cause the change in the entire
cost and the profitability out of the product of the company. Therefore on the basis of the
analysis results the companies of small to big level makes the decision as to the future manner
in which it will conduct its production activity and what heads it will change to decrease the
cost of production and increase the profit out of that. In the given question the cost of
production and the total expenditure in the manufacturing activity changes when there is
7
Paraphrase This Document
Need a fresh take? Get an instant paraphrase of this document with our AI Paraphraser
change in the total overtime hours of work done by the employees of the organisation (Stanley
& Doucouliagos, 2012)
On the calculation of the regression analysis with the overheads and variables given in the
question it has been analysed with the help of regression that if the total working hours of the
employees of the organisation is decreased than the viable unit will be increased by 10.t6 units
which is not a good sign and therefore the decision of reduction in the total working hour of the
employees of the organisation may have the adverse impact over the performance of the
organisation (Draper & Smith, 2014). The analysis is helpful in various manner as the
management team of the organisation will be prepared for hiring the employees that are
required to perform the work on time and to maintain the given working hour in the
organisation. It will also be focused on finding the other alternative in which it can product its
results effectively with the less resources. The better strategic planning and execution will be
taken in the organisation.
In the second question the for the landscaping of for 500 square metres 6 direct labour hours
were needed and therefore overhead cost, which was dependent on labour hours, has been
changed accordingly to serve the given purpose. As per the previous calculation done in
relation to the regression the total coast that will be required for the completion of the total
overhead costs were computed and the same was 10.60*6 = 63.6. Here the cost of the direct
labour and direct material will be the same since they are not falling under the variable head.
Therefore the total cost calculated for the work completion was (500+126+63.6) = $689.6. This
analysis is very useful example to understand how the regression analysis serve the need of
determining the cost and the e individual heads of expenditure in completion of a single
activity. This regression analysis is helpful in making the right budget allocation to the various
activities that are carried on in the business. This analysis is helpful as there are various types of
activities that are carried on in the business and the right allocation of the budget and the
resources and time for the same will help in keeping the proper management of time and
resources in the organisation. Entire operational function of the business can be kept in control
with the help of this analysis (Polanczyk, et. al., 2014).
8
Another useful example of the regression analysis is calculations that are done in last section of
first part wherein the total direct cost that was included in the activity of biding was $1, 00,000.
The cost of labour hour has been $ 25200 and the overheads includes the $4,560. With the help
of these heads the total biding cost of the company has been forecasted as $1, 29, and 760. The
regression analysis has helped in making the analysis that the total cost will be $1, 29, and 760
in the entire biding activity and therefore on the basis of this prediction company can plan the
time when it will carry out its biding activity (Allison, 2014).
Recommendation
On the basis of detailed study of regression analysis the various usefulness of it has been found
out an on the basis of that it can be recommended that regression analysis calculation if carried
out on the basis of right data that are correctly calculated will serve the very useful purpose in
the organisation. It must be used for each and every business activity that is of financial nature
so that the loss of time and material can be eliminated from the business activities and only the
useful and beneficial activities can be carried out. It is useful for all type of the business
organisation whether it is small or big. The suitability of the analysis is also proven for the small
business activity as well as for big business activities. Therefore it must be used for carrying the
business in planned manner and for keeping the balance between the variable and invariable
heads of cost.
Conclusion
The Regression analysis is a system that is generally adopted by the business organisation for
the purpose of understanding the relation between the variable and non-variable heads of cost.
The right relation can lonely be understood when one head is viable and another head is
invariable. The regression modes like Unknown Parameters for representing the scalar or
vector, independent variable and dependent variable etc. must be purpose and object with
which analysis is to be made. The selection of the linear and nonlinear is also have to be made
accordingly so that right results can be achieved. Before any analysis is carried out the various
information in relation to the variable and non-variables must be collected so that right and
useful information can be gathered and the right decision can thereby be taken. In this way
9
⊘ This is a preview!⊘
Do you want full access?
Subscribe today to unlock all pages.
Trusted by 1+ million students worldwide
regression analysis is useful for all type of business activities and also for planning the future
activities of the business. The important decision of running the business in future or not
cannot be taken on the basis of the reports of this analysis if the data taken form calculation are
wholly reliable.
10
activities of the business. The important decision of running the business in future or not
cannot be taken on the basis of the reports of this analysis if the data taken form calculation are
wholly reliable.
10
Paraphrase This Document
Need a fresh take? Get an instant paraphrase of this document with our AI Paraphraser
References
Allison, P. D. (2014). Event history and survival analysis: Regression for longitudinal event
data (Vol. 46). SAGE publications.
Atkinson, A., & Riani, M. (2012). Robust diagnostic regression analysis. Springer Science &
Business Media.
Draper, N. R., & Smith, H. (2014). Applied regression analysis(Vol. 326). John Wiley & Sons.
Gupta, R. K., Jordan, M. R., Sultan, B. J., Hill, A., Davis, D. H., Gregson, J., ... & Bertagnolio, S.
(2012). Global trends in antiretroviral resistance in treatment-naive individuals with HIV
after rollout of antiretroviral treatment in resource-limited settings: a global
collaborative study and meta-regression analysis. The Lancet, 380(9849), 1250-1258.
Montgomery, D. C., Peck, E. A., & Vining, G. G. (2012). Introduction to linear regression
analysis (Vol. 821). John Wiley & Sons.
Müller, H. G. (2012). Nonparametric regression analysis of longitudinal data (Vol. 46). Springer
Science & Business Media.
Polanczyk, G. V., Willcutt, E. G., Salum, G. A., Kieling, C., & Rohde, L. A. (2014). ADHD prevalence
estimates across three decades: an updated systematic review and meta-regression
analysis. International journal of epidemiology, 43(2), 434-442.
Seber, G. A., & Lee, A. J. (2012). Linear regression analysis(Vol. 329). John Wiley & Sons.
Sen, A., & Srivastava, M. (2012). Regression analysis: theory, methods, and applications.
Springer Science & Business Media.
Stanley, T. D., & Doucouliagos, H. (2012). Meta-regression analysis in economics and
business (Vol. 5). Routledge.
11

12
⊘ This is a preview!⊘
Do you want full access?
Subscribe today to unlock all pages.
Trusted by 1+ million students worldwide
1 out of 12
Related Documents


Your All-in-One AI-Powered Toolkit for Academic Success.
+13062052269
info@desklib.com
Available 24*7 on WhatsApp / Email
![[object Object]](/_next/static/media/star-bottom.7253800d.svg)
Unlock your academic potential
Copyright © 2020–2025 A2Z Services. All Rights Reserved. Developed and managed by ZUCOL.