BUACC5931 Semester 1 Assignment 1: Statistics and Job Insecurity Study
VerifiedAdded on 2022/09/22
|13
|2647
|24
Homework Assignment
AI Summary
This assignment solution analyzes a research study on the association between quantitative and qualitative job insecurity and employee well-being in the Belgian banking sector. It begins by examining the statistical methods used to determine the optimal sample size, comparing the calculated sample size with the one used in the study, and discussing the implications of the chosen sample size. The solution then explores the stratified random sampling technique employed in the study, highlighting its advantages and disadvantages. Furthermore, the assignment delves into the concepts of reliability and validity, using Cronbach's alpha values to assess the consistency and appropriateness of the measures used in the study. The importance of social demographics data is also discussed, emphasizing its role in enabling extended data analysis. Finally, the assignment concludes by identifying the quantitative research design and correlational approach applied in the study, outlining the pros and cons of this approach.

Statistics
Paraphrase This Document
Need a fresh take? Get an instant paraphrase of this document with our AI Paraphraser
Statistics
Question 1
The portion of a study population used for the analysis and eventual inferencing in a
research is referred to as the sample (Ahmed, 2009). The main statistical (mathematical)
approach used to come up with the number of observations from the study population to be used
as the sample is Cochran’s Formula. Cochran’s Formula is a sample size determination formula
that takes into consideration the level of error that the researcher is willing to allow in the
analysis and findings in the research, as well as the characteristics of the study population in the
research (Shaffer, 2011).
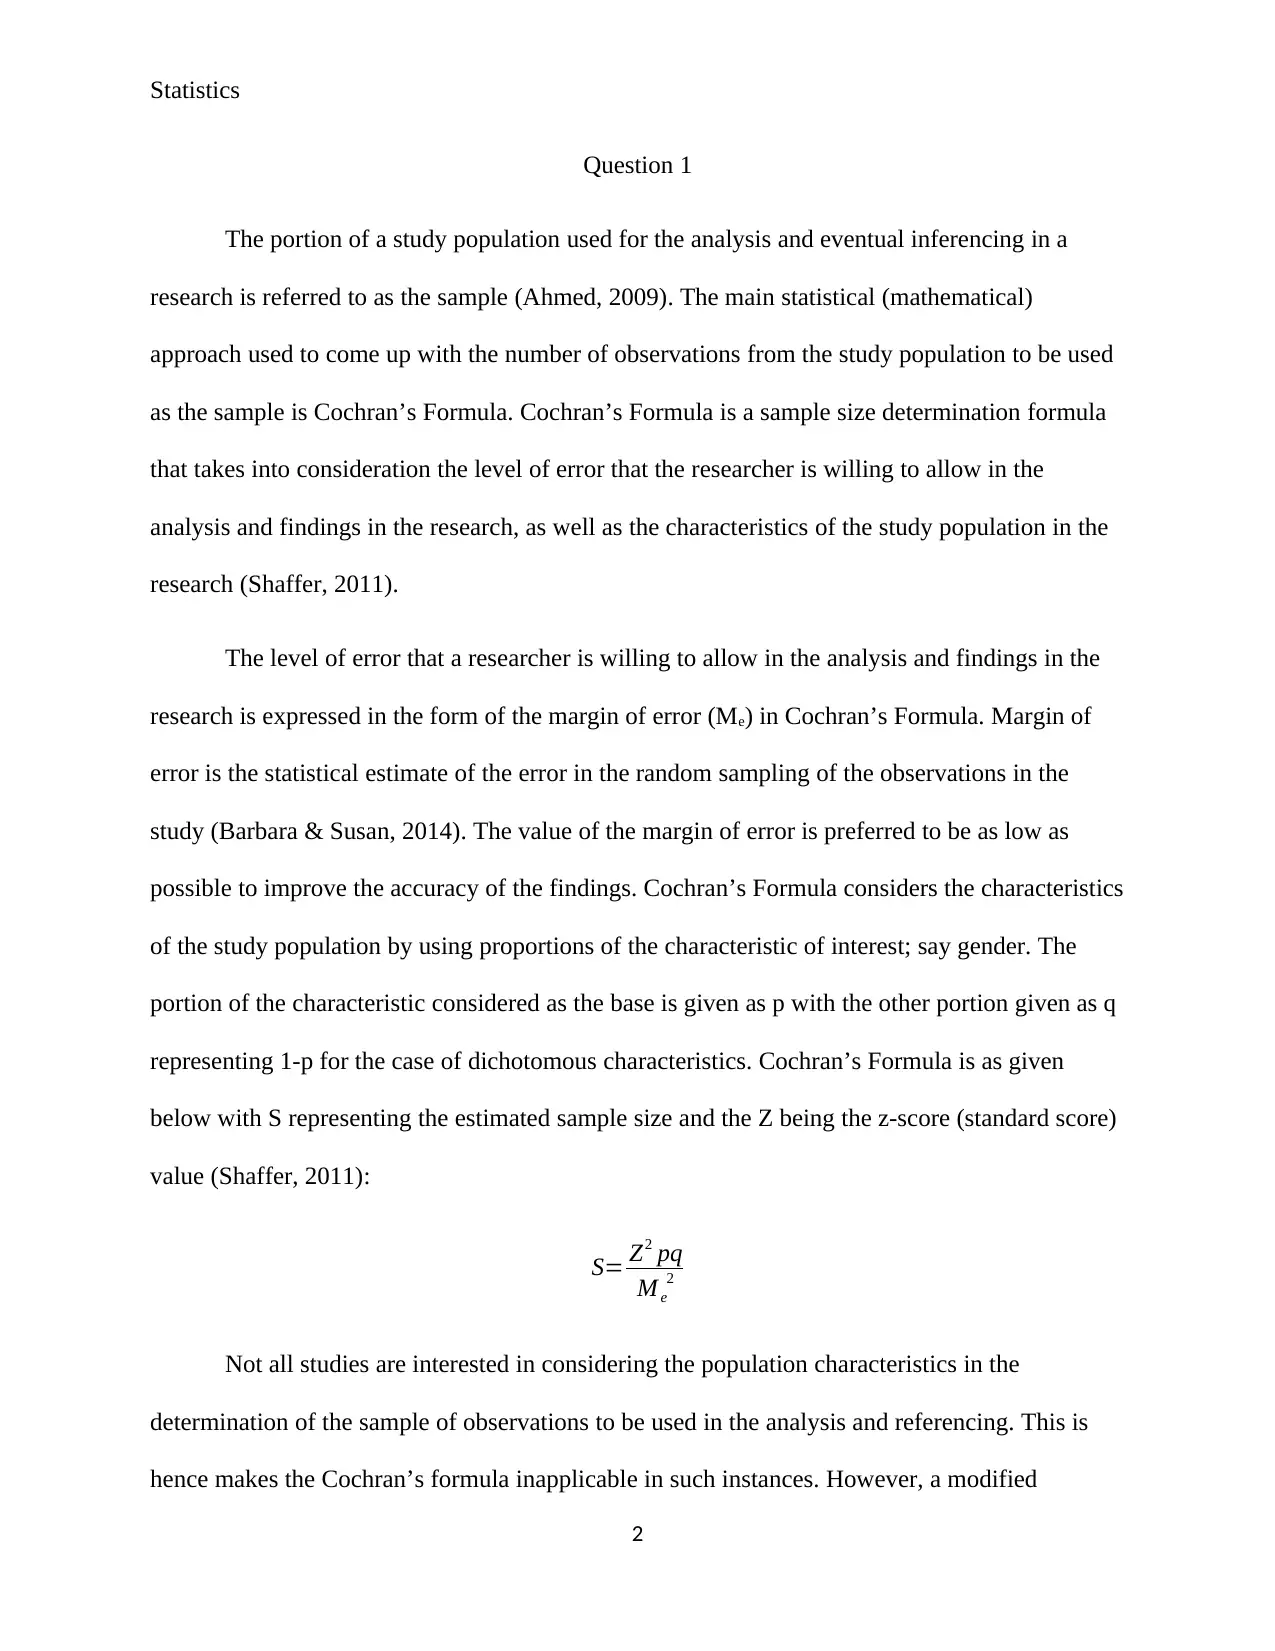
The level of error that a researcher is willing to allow in the analysis and findings in the
research is expressed in the form of the margin of error (Me) in Cochran’s Formula. Margin of
error is the statistical estimate of the error in the random sampling of the observations in the
study (Barbara & Susan, 2014). The value of the margin of error is preferred to be as low as
possible to improve the accuracy of the findings. Cochran’s Formula considers the characteristics
of the study population by using proportions of the characteristic of interest; say gender. The
portion of the characteristic considered as the base is given as p with the other portion given as q
representing 1-p for the case of dichotomous characteristics. Cochran’s Formula is as given
below with S representing the estimated sample size and the Z being the z-score (standard score)
value (Shaffer, 2011):
S= Z2 pq
M e
2
Not all studies are interested in considering the population characteristics in the
determination of the sample of observations to be used in the analysis and referencing. This is
hence makes the Cochran’s formula inapplicable in such instances. However, a modified
2
Question 1
The portion of a study population used for the analysis and eventual inferencing in a
research is referred to as the sample (Ahmed, 2009). The main statistical (mathematical)
approach used to come up with the number of observations from the study population to be used
as the sample is Cochran’s Formula. Cochran’s Formula is a sample size determination formula
that takes into consideration the level of error that the researcher is willing to allow in the
analysis and findings in the research, as well as the characteristics of the study population in the
research (Shaffer, 2011).
The level of error that a researcher is willing to allow in the analysis and findings in the
research is expressed in the form of the margin of error (Me) in Cochran’s Formula. Margin of
error is the statistical estimate of the error in the random sampling of the observations in the
study (Barbara & Susan, 2014). The value of the margin of error is preferred to be as low as
possible to improve the accuracy of the findings. Cochran’s Formula considers the characteristics
of the study population by using proportions of the characteristic of interest; say gender. The
portion of the characteristic considered as the base is given as p with the other portion given as q
representing 1-p for the case of dichotomous characteristics. Cochran’s Formula is as given
below with S representing the estimated sample size and the Z being the z-score (standard score)
value (Shaffer, 2011):
S= Z2 pq
M e
2
Not all studies are interested in considering the population characteristics in the
determination of the sample of observations to be used in the analysis and referencing. This is
hence makes the Cochran’s formula inapplicable in such instances. However, a modified
2
Statistics
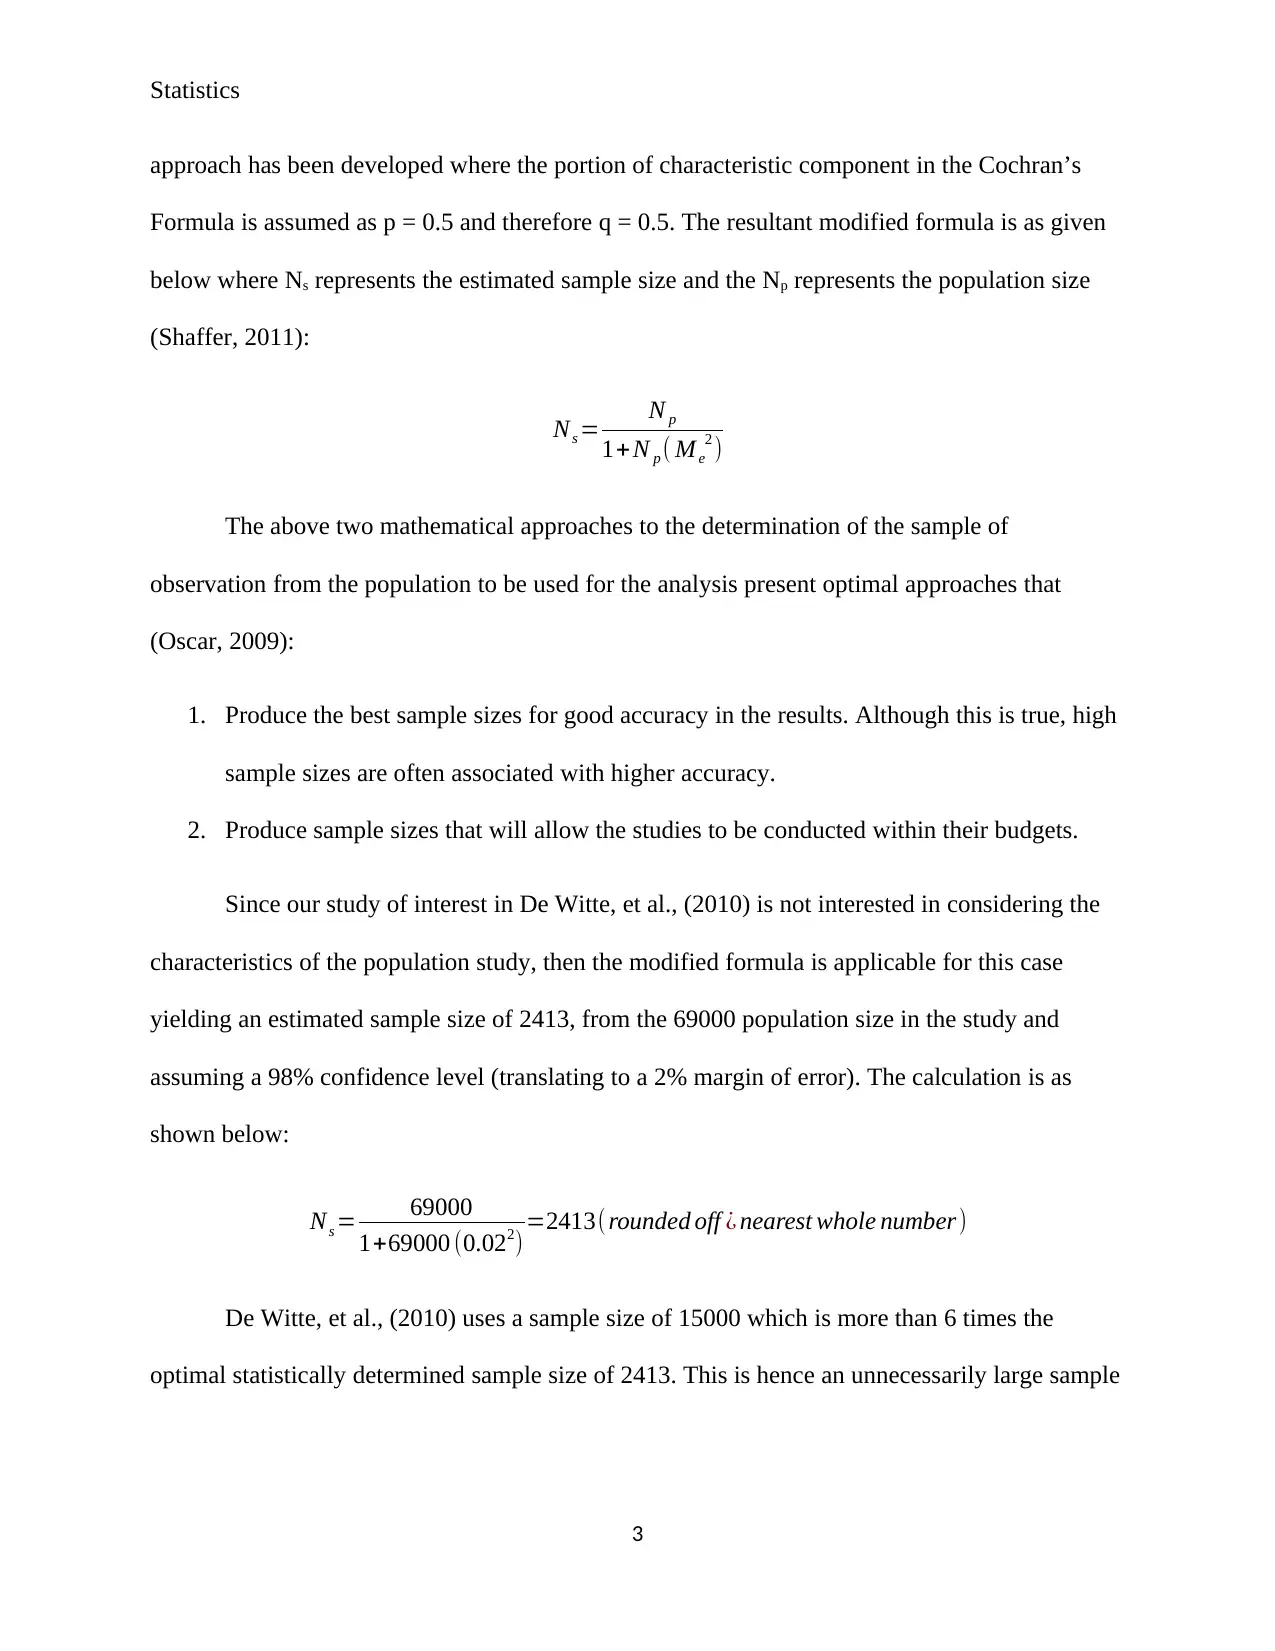
approach has been developed where the portion of characteristic component in the Cochran’s
Formula is assumed as p = 0.5 and therefore q = 0.5. The resultant modified formula is as given
below where Ns represents the estimated sample size and the Np represents the population size
(Shaffer, 2011):
Ns = N p
1+N p ( Me
2 )
The above two mathematical approaches to the determination of the sample of
observation from the population to be used for the analysis present optimal approaches that
(Oscar, 2009):
1. Produce the best sample sizes for good accuracy in the results. Although this is true, high
sample sizes are often associated with higher accuracy.
2. Produce sample sizes that will allow the studies to be conducted within their budgets.
Since our study of interest in De Witte, et al., (2010) is not interested in considering the
characteristics of the population study, then the modified formula is applicable for this case
yielding an estimated sample size of 2413, from the 69000 population size in the study and
assuming a 98% confidence level (translating to a 2% margin of error). The calculation is as
shown below:
Ns = 69000
1+69000 (0.022) =2413(rounded off ¿ nearest whole number)
De Witte, et al., (2010) uses a sample size of 15000 which is more than 6 times the
optimal statistically determined sample size of 2413. This is hence an unnecessarily large sample
3
⊘ This is a preview!⊘
Do you want full access?
Subscribe today to unlock all pages.
Trusted by 1+ million students worldwide
Statistics
size since it makes the study expensive to conduct with the data collection being up to 6 times as
expensive as the data collection for the optimal sample size.
Question 2
De Witte, et al., (2010) sampling approach is the stratified form of random sampling.
Stratified random sampling is a probability sampling technique in which the study population is
first divided into strata that are homogenous with respect to an attribute, and then conducting
simple random sampling within each stratum (Himmelfarb Health Sciences Library, 2011). The
sample observations collected using the simple random sampling from each stratum then
collectively form the sample for the study. In De Witte, et al., (2010), the entire population of
69000 employees is divided into 63 strata. The strata are selected based on the bank in which the
employee works for. In each of the banks a sample of 21% of the whole population of the
employees working for the bank in question is then randomly selected.
The advantages of the stratified random sampling technique are (O'Neil & Schutt, 2013):
1. The consideration for the existence of homogeneity among observations in a population
enhances the precision of the study to enable higher accuracy of the results and findings.
2. The sampling of the strata in the stratified random sampling technique allows the analysis
in the study to be extended to consider the homogenous groups within the study
population. Hence stratified random sampling allows for the drawing of inferences that
are both general and group-wise.
4
Paraphrase This Document
Need a fresh take? Get an instant paraphrase of this document with our AI Paraphraser
Statistics
3. The consideration for the existence of homogeneity also serves to counter the effects of
lack of representativeness often associated with simple random sampling. This as well
improves on the quality of the study findings.
4. The stratified random sampling technique requires a significantly lower number of
observations for the sample in comparison to the simple random sampling technique.
Hence presenting a cheaper alternative to simple random sampling.
The disadvantages of the stratified random sampling technique are (O'Neil & Schutt,
2013):
1. In cases where individuals qualify to be in more than one strata, the stratified random
sampling technique becomes inapplicable.
2. The stratified random sampling technique has a strict criterion for application. This
criterion is in relation to the placing of observations in the population into strata, where
the observations are expected to be accurately placed in the correct stratum.
Misplacement of observation affects the precision of the findings in studies that use the
stratified random sampling technique.
Question 3
The reliability of a measure is the criteria of the level of reproducibility of the output of
the measure in question (Galit, Peter, Inbal, Patel, & Kenneth, 2018). Reliability concerns the
consistency of a measure in producing results that are similar repeatedly, assuming all factors
remain the same (Chakrabartty, 2013). The Cronbach’s alpha value was used in the De Witte, et
al., (2010) to measure the reliability of the measures used. The Cronbach’s alpha value is an
5
Statistics
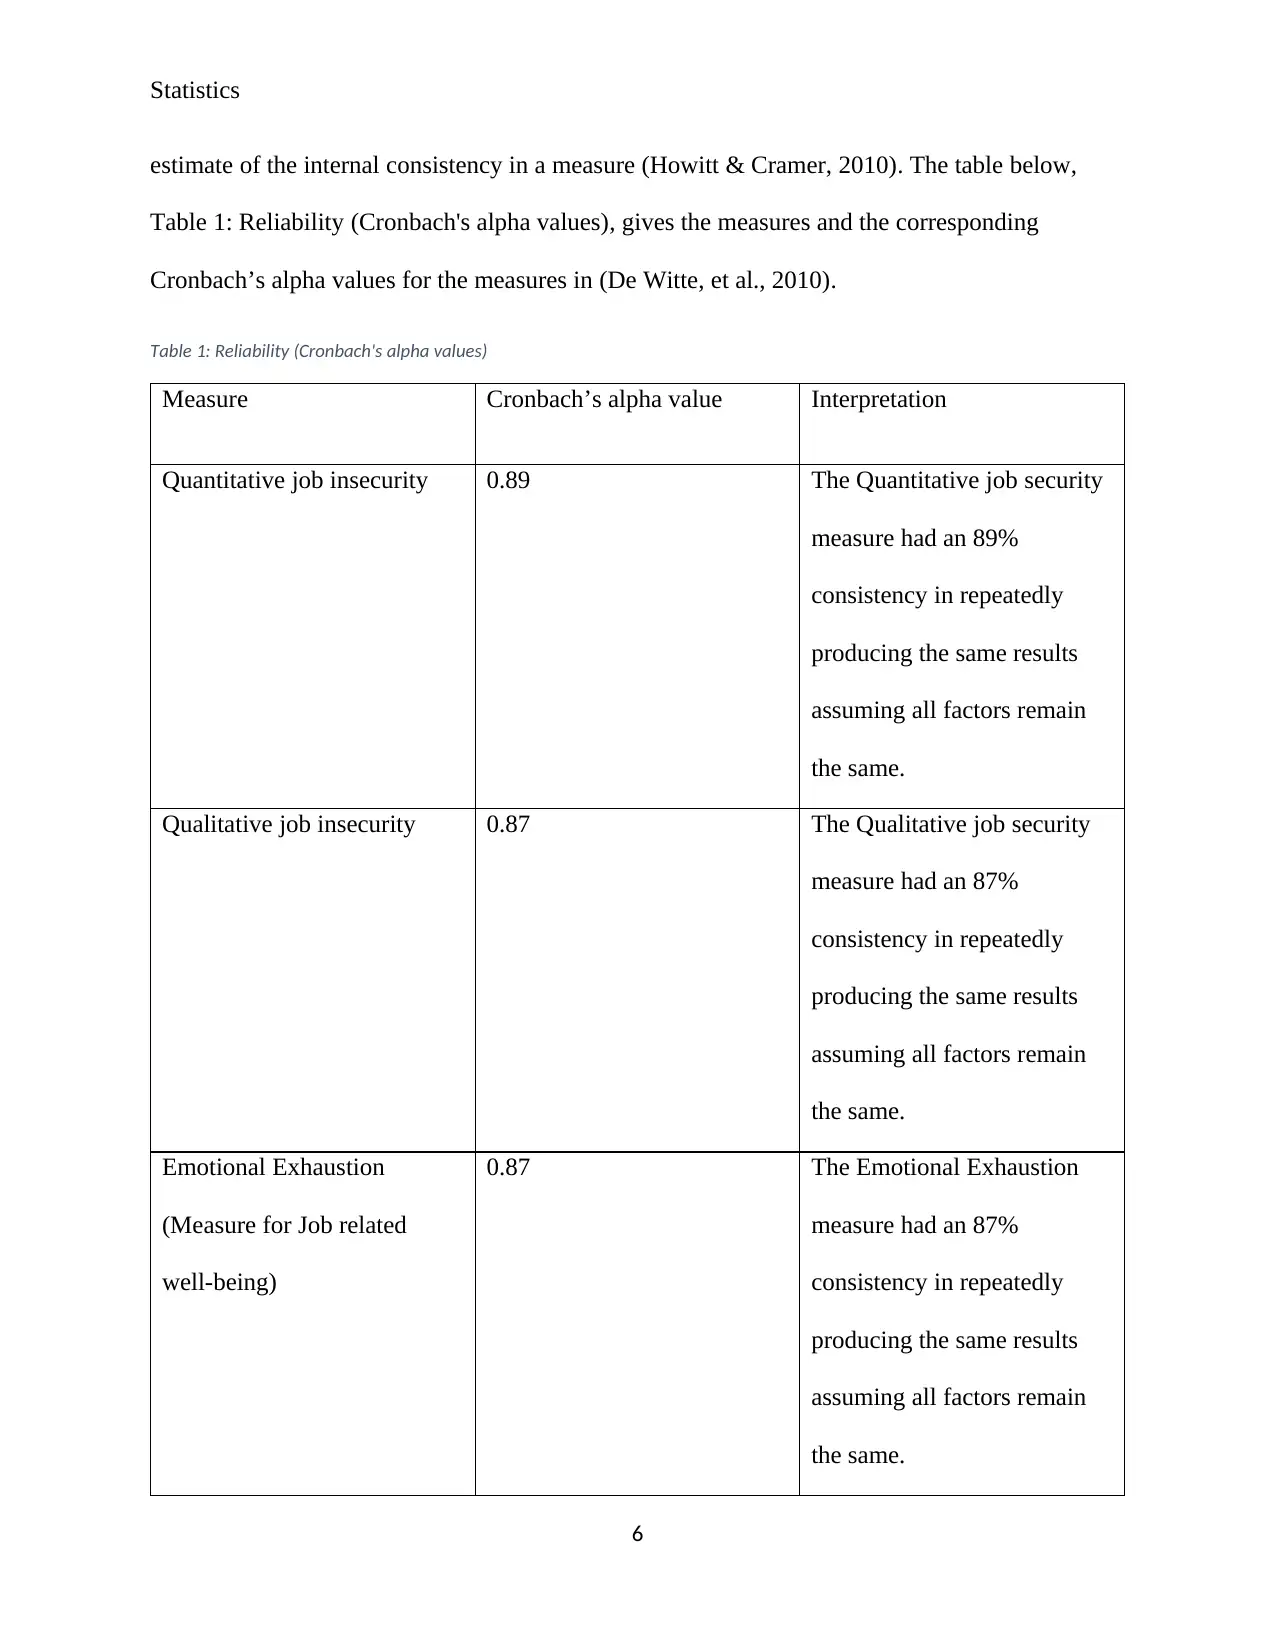
estimate of the internal consistency in a measure (Howitt & Cramer, 2010). The table below,
Table 1: Reliability (Cronbach's alpha values), gives the measures and the corresponding
Cronbach’s alpha values for the measures in (De Witte, et al., 2010).
Table 1: Reliability (Cronbach's alpha values)
Measure Cronbach’s alpha value Interpretation
Quantitative job insecurity 0.89 The Quantitative job security
measure had an 89%
consistency in repeatedly
producing the same results
assuming all factors remain
the same.
Qualitative job insecurity 0.87 The Qualitative job security
measure had an 87%
consistency in repeatedly
producing the same results
assuming all factors remain
the same.
Emotional Exhaustion
(Measure for Job related
well-being)
0.87 The Emotional Exhaustion
measure had an 87%
consistency in repeatedly
producing the same results
assuming all factors remain
the same.
6
⊘ This is a preview!⊘
Do you want full access?
Subscribe today to unlock all pages.
Trusted by 1+ million students worldwide
Statistics
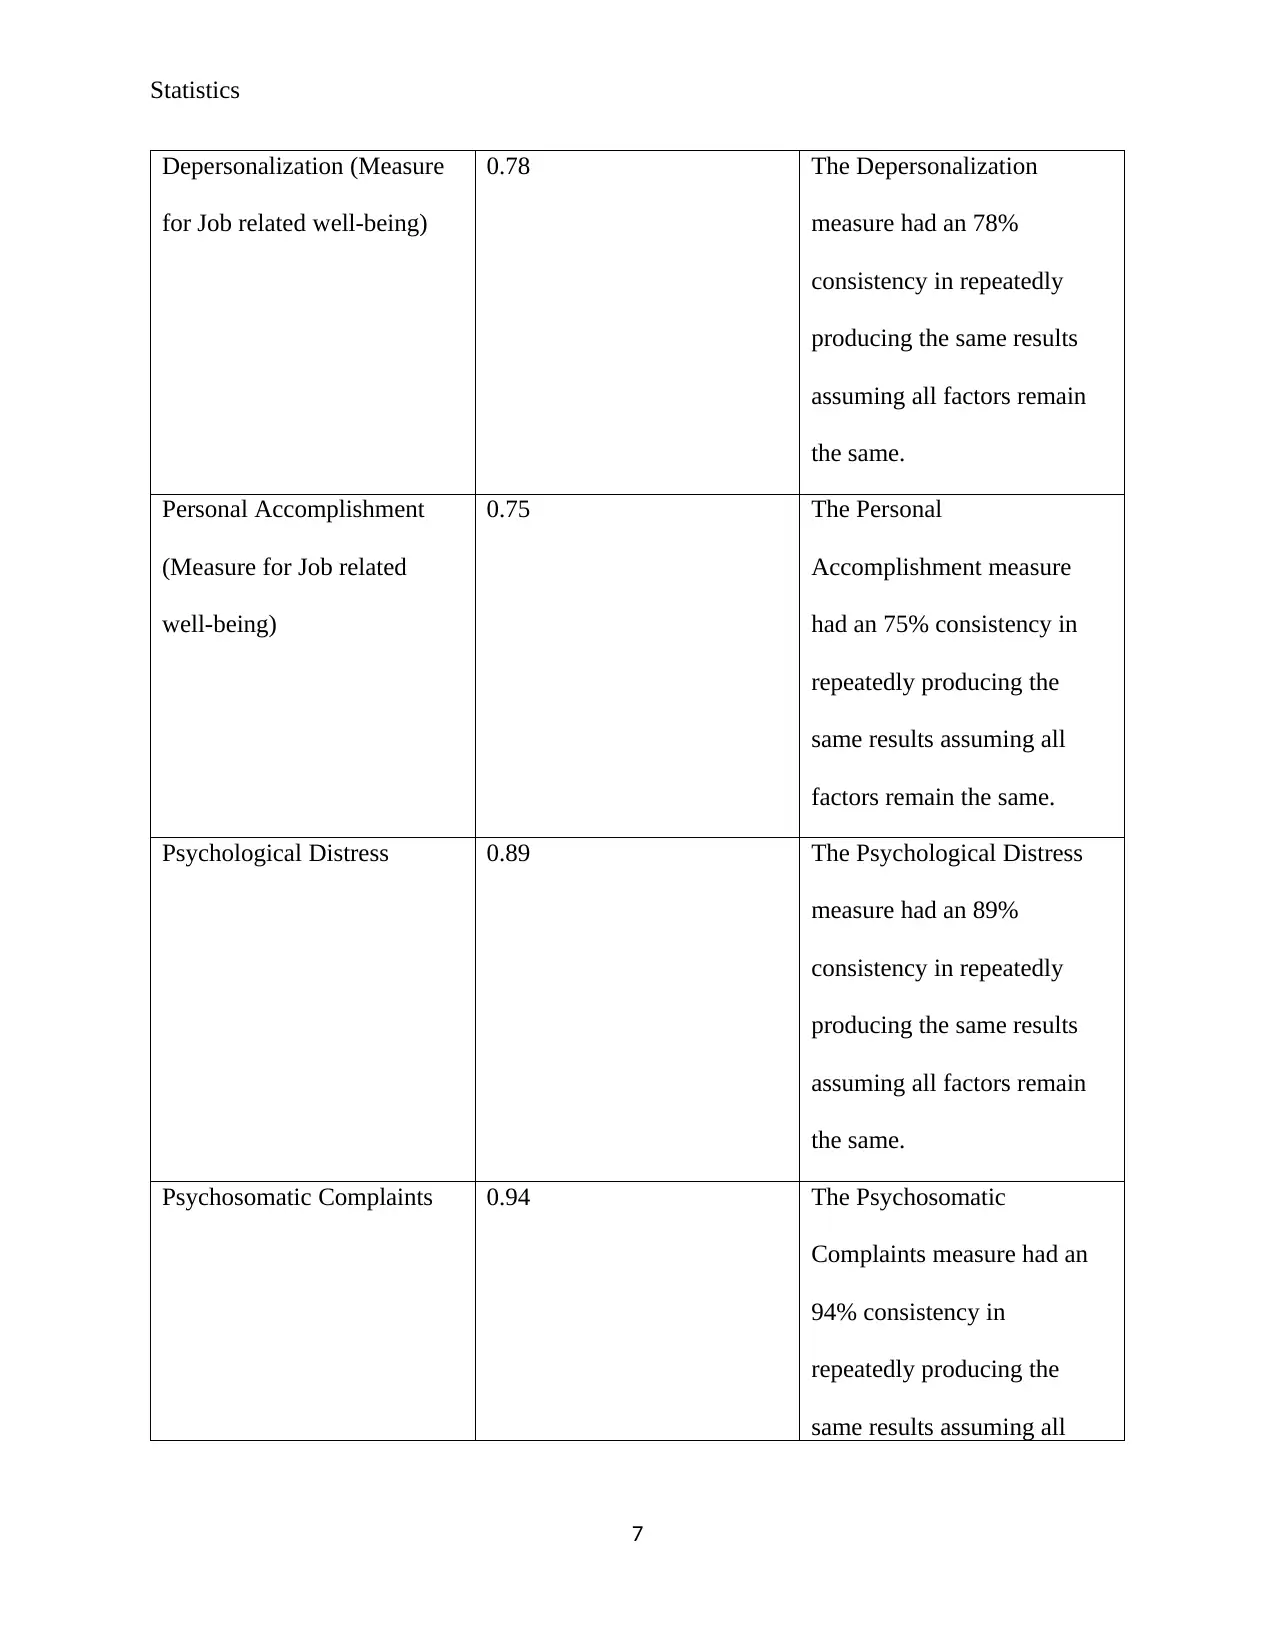
Depersonalization (Measure
for Job related well-being)
0.78 The Depersonalization
measure had an 78%
consistency in repeatedly
producing the same results
assuming all factors remain
the same.
Personal Accomplishment
(Measure for Job related
well-being)
0.75 The Personal
Accomplishment measure
had an 75% consistency in
repeatedly producing the
same results assuming all
factors remain the same.
Psychological Distress 0.89 The Psychological Distress
measure had an 89%
consistency in repeatedly
producing the same results
assuming all factors remain
the same.
Psychosomatic Complaints 0.94 The Psychosomatic
Complaints measure had an
94% consistency in
repeatedly producing the
same results assuming all
7
Paraphrase This Document
Need a fresh take? Get an instant paraphrase of this document with our AI Paraphraser
Statistics
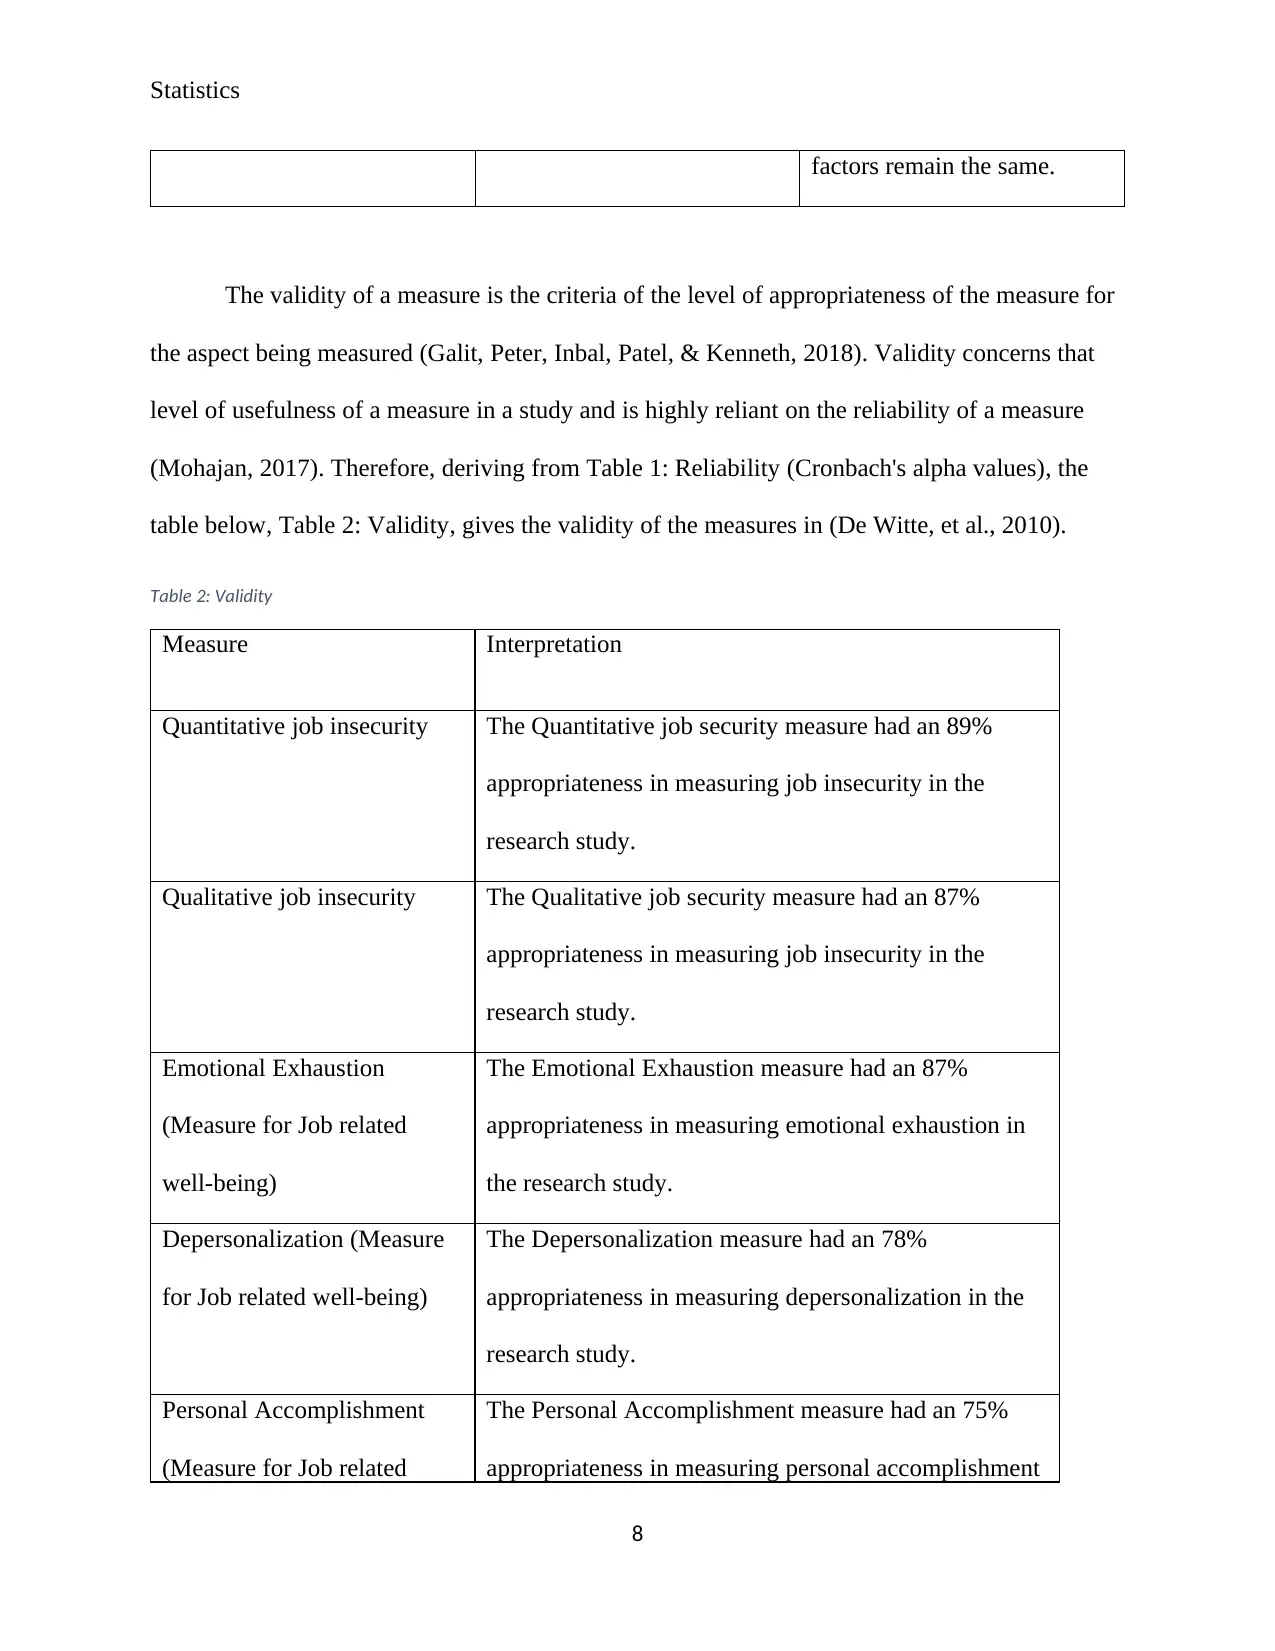
factors remain the same.
The validity of a measure is the criteria of the level of appropriateness of the measure for
the aspect being measured (Galit, Peter, Inbal, Patel, & Kenneth, 2018). Validity concerns that
level of usefulness of a measure in a study and is highly reliant on the reliability of a measure
(Mohajan, 2017). Therefore, deriving from Table 1: Reliability (Cronbach's alpha values), the
table below, Table 2: Validity, gives the validity of the measures in (De Witte, et al., 2010).
Table 2: Validity
Measure Interpretation
Quantitative job insecurity The Quantitative job security measure had an 89%
appropriateness in measuring job insecurity in the
research study.
Qualitative job insecurity The Qualitative job security measure had an 87%
appropriateness in measuring job insecurity in the
research study.
Emotional Exhaustion
(Measure for Job related
well-being)
The Emotional Exhaustion measure had an 87%
appropriateness in measuring emotional exhaustion in
the research study.
Depersonalization (Measure
for Job related well-being)
The Depersonalization measure had an 78%
appropriateness in measuring depersonalization in the
research study.
Personal Accomplishment
(Measure for Job related
The Personal Accomplishment measure had an 75%
appropriateness in measuring personal accomplishment
8
Statistics
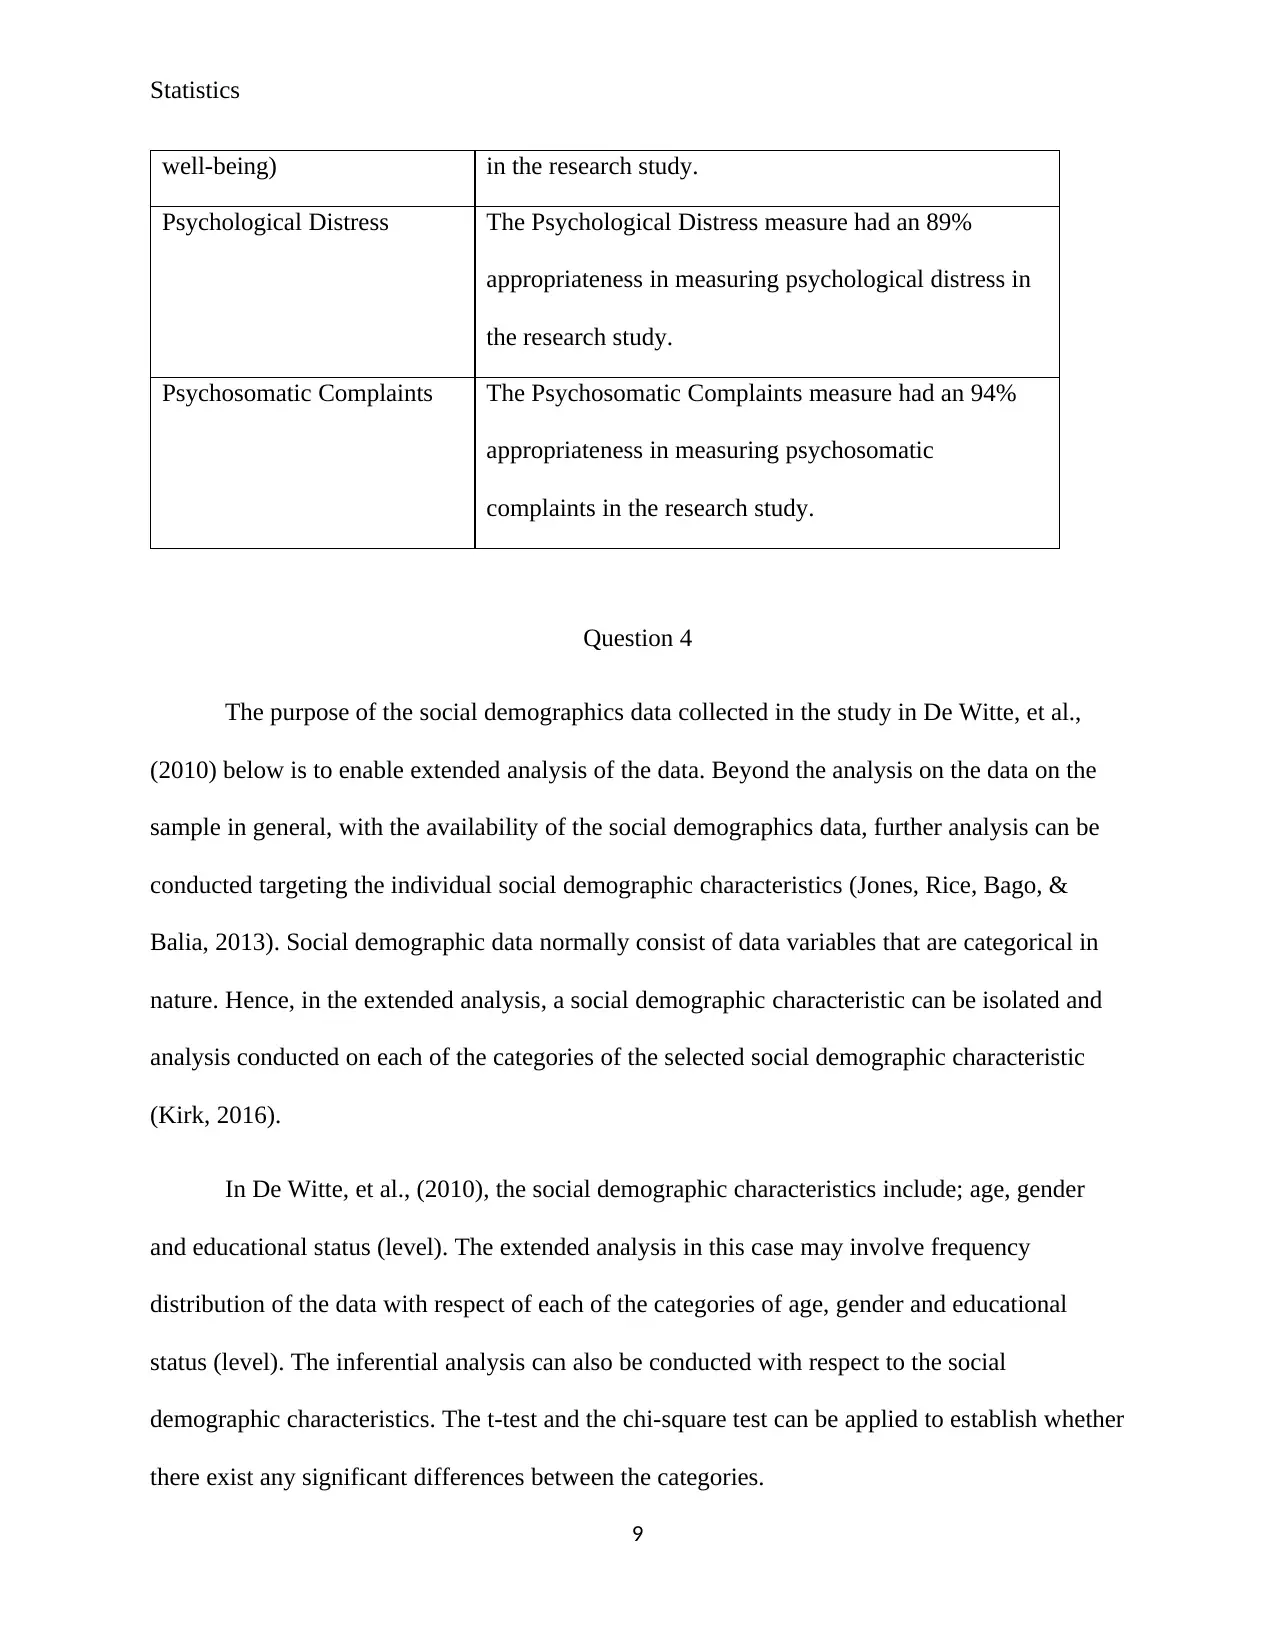
well-being) in the research study.
Psychological Distress The Psychological Distress measure had an 89%
appropriateness in measuring psychological distress in
the research study.
Psychosomatic Complaints The Psychosomatic Complaints measure had an 94%
appropriateness in measuring psychosomatic
complaints in the research study.
Question 4
The purpose of the social demographics data collected in the study in De Witte, et al.,
(2010) below is to enable extended analysis of the data. Beyond the analysis on the data on the
sample in general, with the availability of the social demographics data, further analysis can be
conducted targeting the individual social demographic characteristics (Jones, Rice, Bago, &
Balia, 2013). Social demographic data normally consist of data variables that are categorical in
nature. Hence, in the extended analysis, a social demographic characteristic can be isolated and
analysis conducted on each of the categories of the selected social demographic characteristic
(Kirk, 2016).
In De Witte, et al., (2010), the social demographic characteristics include; age, gender
and educational status (level). The extended analysis in this case may involve frequency
distribution of the data with respect of each of the categories of age, gender and educational
status (level). The inferential analysis can also be conducted with respect to the social
demographic characteristics. The t-test and the chi-square test can be applied to establish whether
there exist any significant differences between the categories.
9
⊘ This is a preview!⊘
Do you want full access?
Subscribe today to unlock all pages.
Trusted by 1+ million students worldwide
Statistics
In general, the social demographic characteristics in De Witte, et al., (2010) allow for
better understanding of the data by allowing for more analysis to be conducted and inferences
drawn.
Question 5
The study in De Witte, et al., (2010) applies a quantitative research design. A quantitative
research design refers to a study in which the data collected in composed of quantifiable
attributes that are numerical in nature or coerced into numerical variables (Bernard, 2012). The
correlational approach to the quantitative research design was applied in the study in De Witte, et
al., (2010). The correlational design is a quantitative research design approach that evaluates the
relationship between attributes in a dataset of interest (Punch, 2013).
The pros of the correlational approach to the quantitative research design are (Vicenc,
2017):
1. The data collection process for the correlational design approach, as opposed to the
experimental design approach, allows for the collection of data of more observations and
on more variables.
2. The correlational design approach forms a good basis for extension of research on the
research area. Further analysis can use the findings from the correlational design
approach as a point of reference.
The main disadvantage of the correlational approach to the quantitative research design is
that the results of the analysis only give information with regards to the association between the
10
Paraphrase This Document
Need a fresh take? Get an instant paraphrase of this document with our AI Paraphraser
Statistics
variables; it’s direction and strength (Barbara & Susan, 2014). The correlational approach fails in
giving information on the cause for the existence of the association between the variables.
References
Ahmed, S. (2009). Methods in Sample Survey. Johns Hopkins Bloomberg. , 1-14. New York:
John Hopkins Bloomberg.
Barbara, I., & Susan, D. (2014). Introductory Statistics (1st ed.). New York: OpenStax CNX.
11
Statistics
Bernard, H. R. (2012). Social Research Methods: Qualitative and Quantitative Approaches (1st
ed.). New York: Sage.
Chakrabartty, S. N. (2013). Best Split-Half and Maximum Reliability. IOSR Journal of Research
and Method in Education, 3(1), 1-8.
De Witte, H., De Cuyper, N., Handaja, Y., Sverke, M., Näswall, K., & Hellgren, J. (2010).
Associations between quantitative and qualitative job insecurity and well-being: A test in
Belgian banks. International Studies of Management and Organization, 40(1), 40-56.
Galit, S., Peter, B. C., Inbal, Y., Patel, N. R., & Kenneth, L. C. (2018). Data Mining for Business
Analytics (1st ed.). New Delhi: John Wiley & Sons, Inc.
Himmelfarb Health Sciences Library. (2011). Study Design 101. Retrieved from Himmelfarb:
https://himmelfarb.gwu.edu/tutorials/studydesign101.html
Howitt, D., & Cramer, D. (2010). Introduction to Descriptive Statistics in Psycology, 5th
Edition. New York: Prentice Hall.
Jones, A. M., Rice, N., Bago, D. T., & Balia, S. (2013). Duration Data. Applied Health
Economics, 139-181.
Kirk, A. (2016). Data Visualization: A Handbook for Data Driven Design (2nd ed.). Thousand
Oaks, CA: Sage Publications, Ltd.
Mohajan, H. (2017). Two Criteria for Good Measurements In Research: Validity and Reliability.
Annals of Spiru Haret University, 17(3), 58-82.
O'Neil, C., & Schutt, R. (2013). Doing Data Science (3rd ed.). London: O'Reily.
12
⊘ This is a preview!⊘
Do you want full access?
Subscribe today to unlock all pages.
Trusted by 1+ million students worldwide
1 out of 13
Related Documents


Your All-in-One AI-Powered Toolkit for Academic Success.
+13062052269
info@desklib.com
Available 24*7 on WhatsApp / Email
![[object Object]](/_next/static/media/star-bottom.7253800d.svg)
Unlock your academic potential
Copyright © 2020–2026 A2Z Services. All Rights Reserved. Developed and managed by ZUCOL.