BB108 Business Statistics: Job Satisfaction Analysis Report

Verified

Added on  2022/10/09

|10
|883
|109
Report
AI Summary
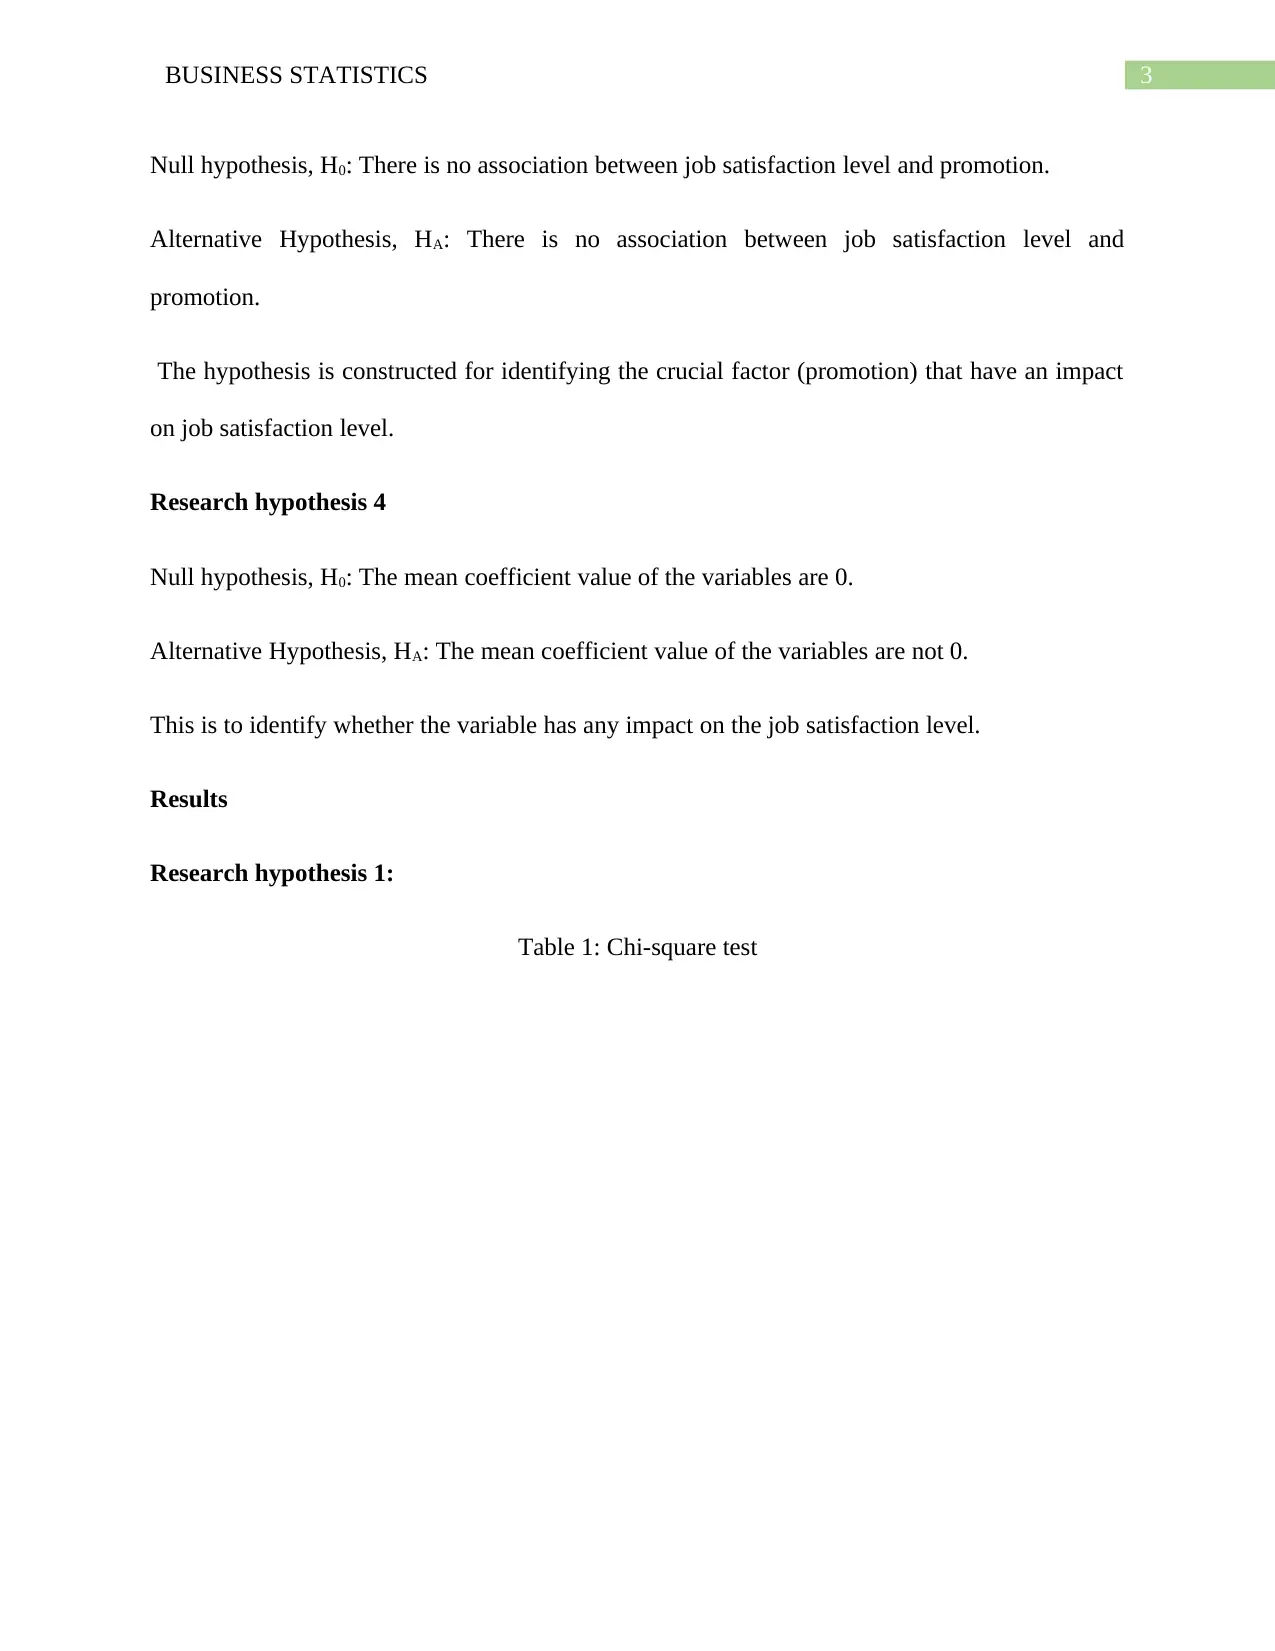
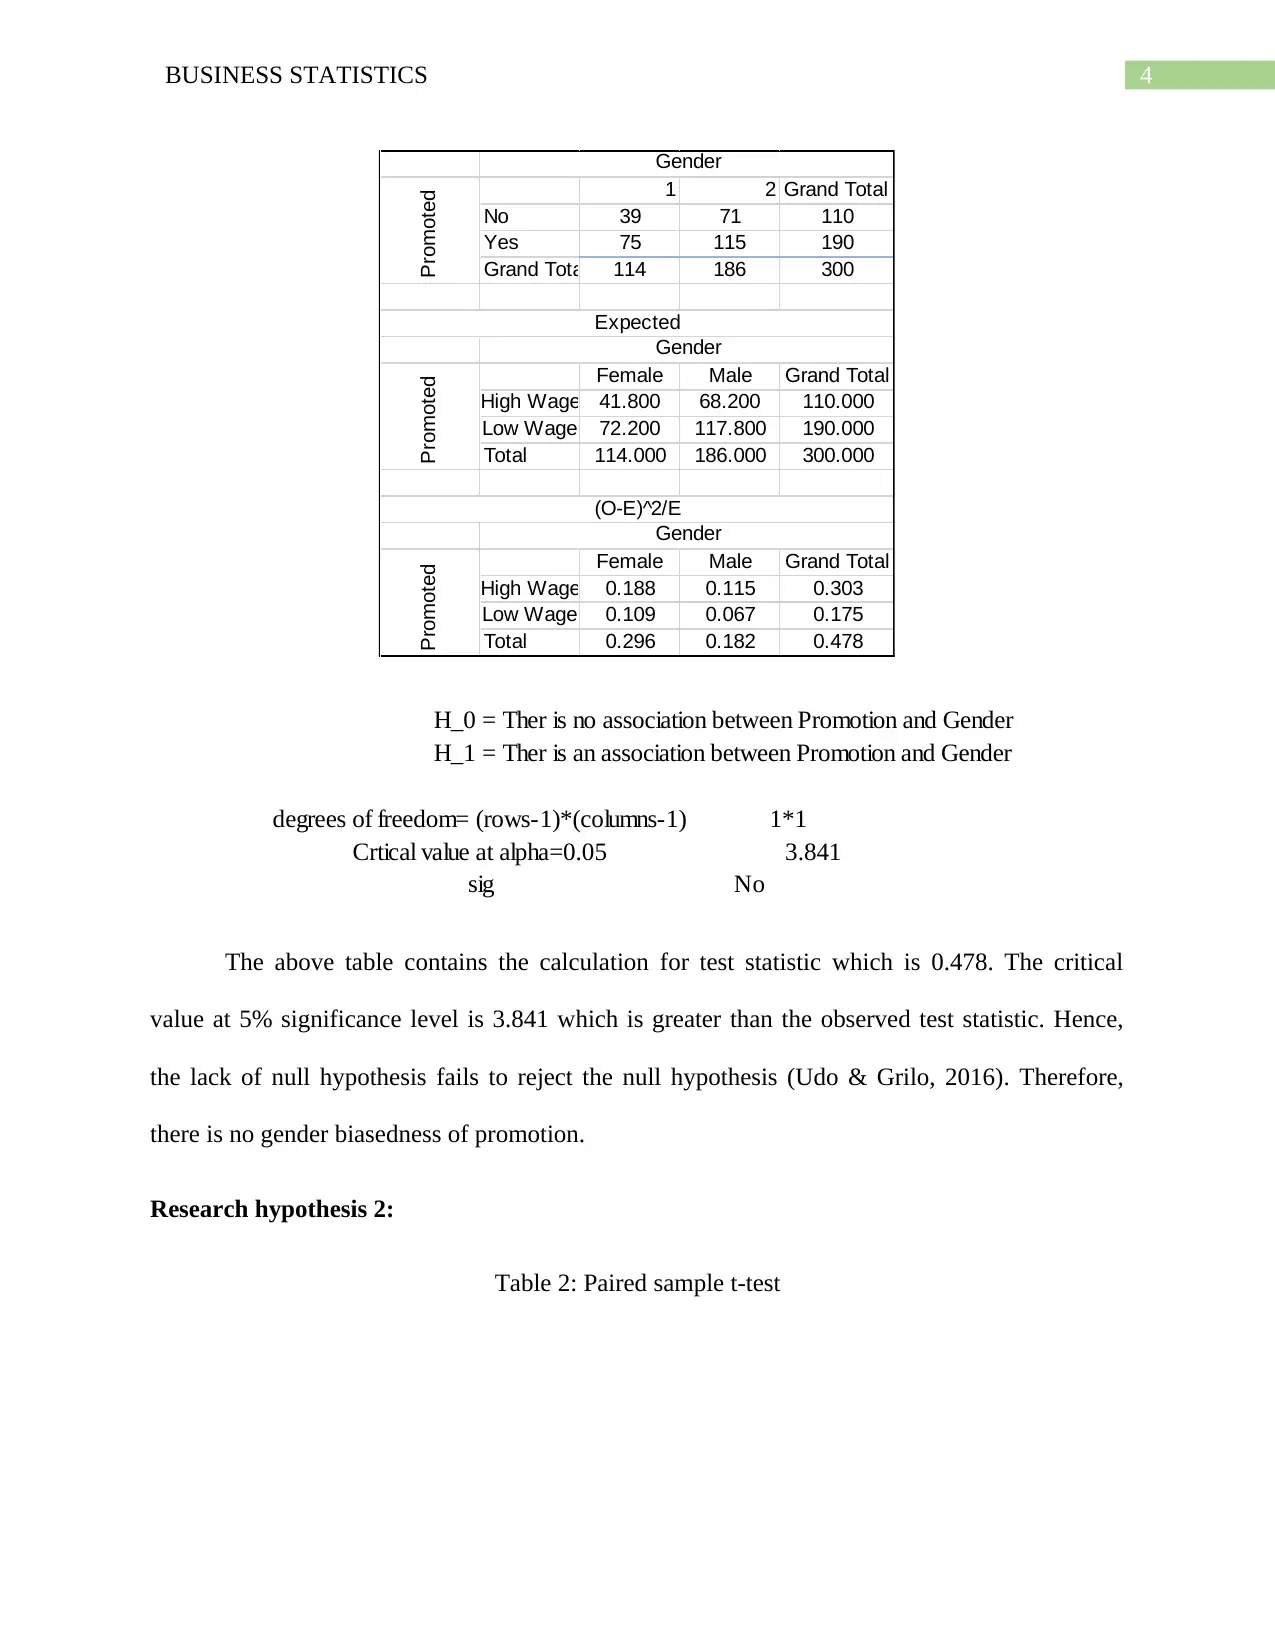
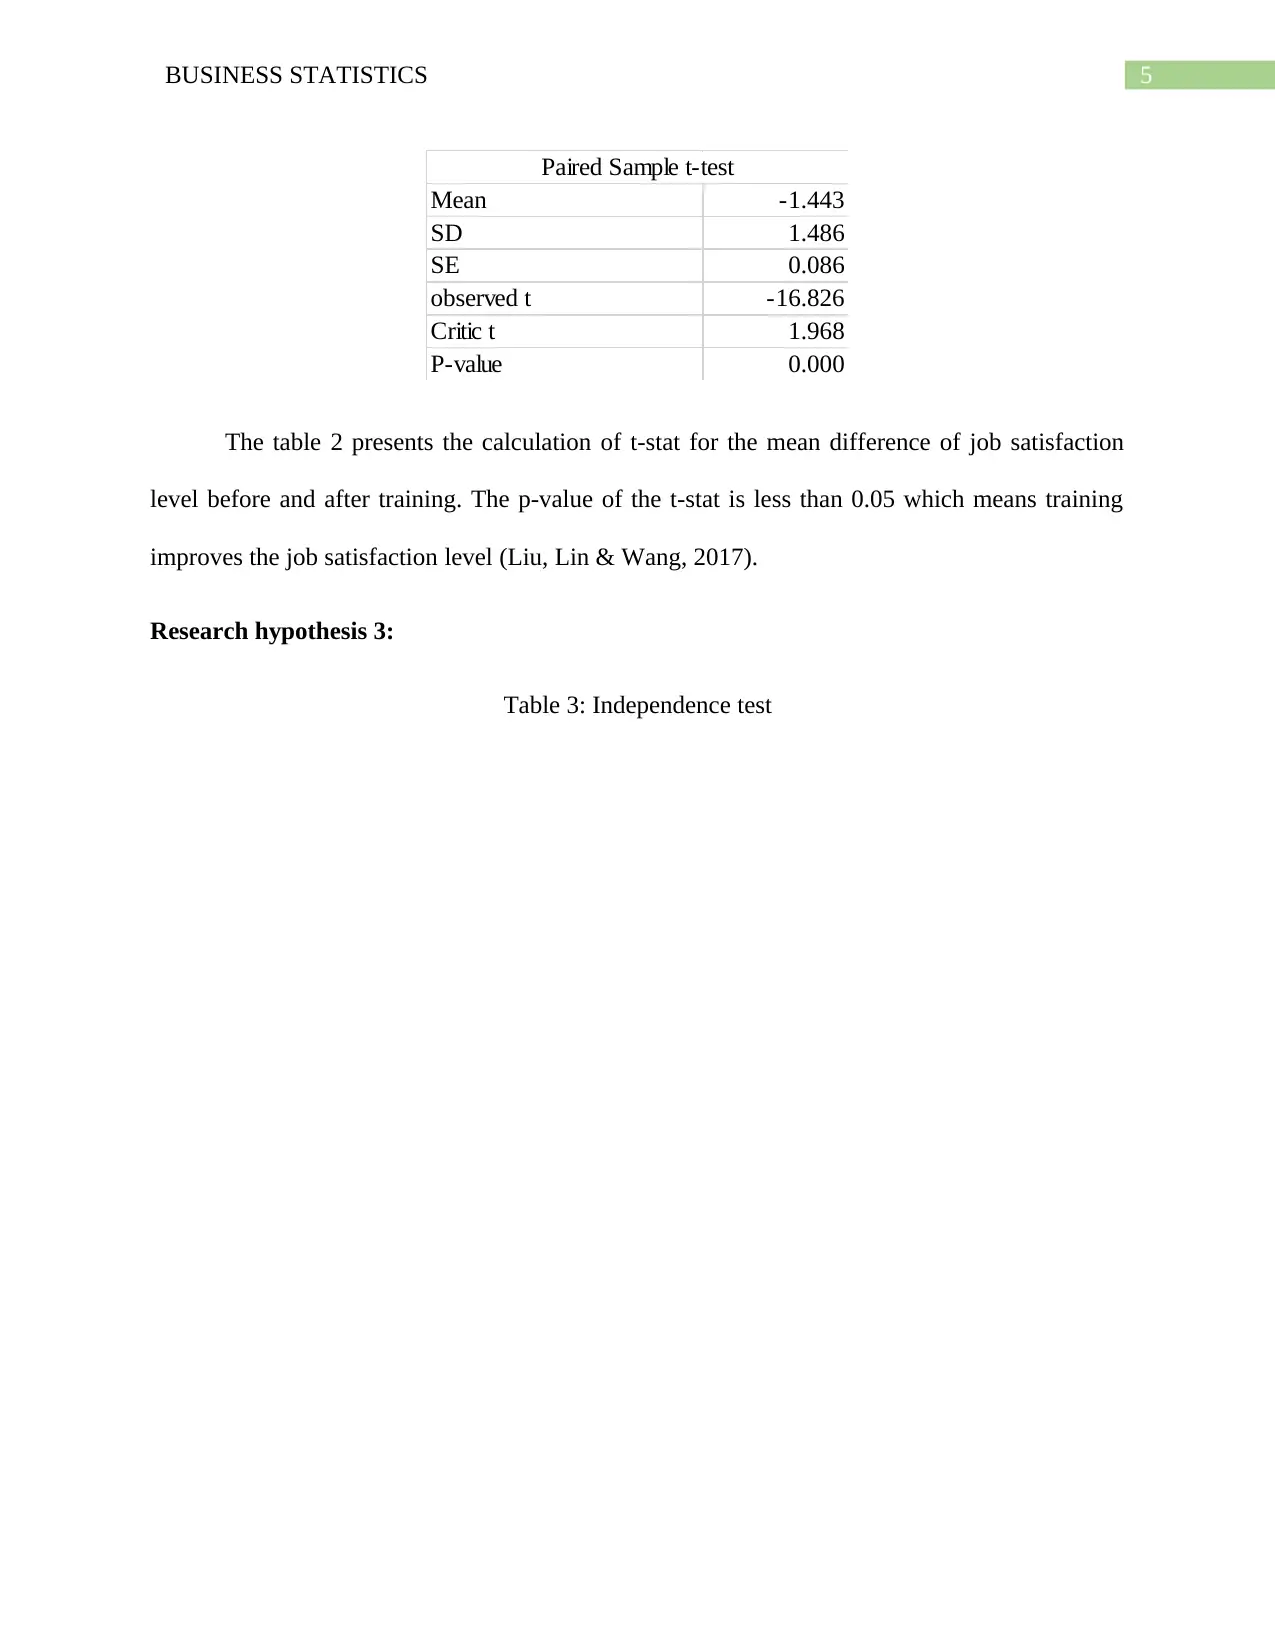
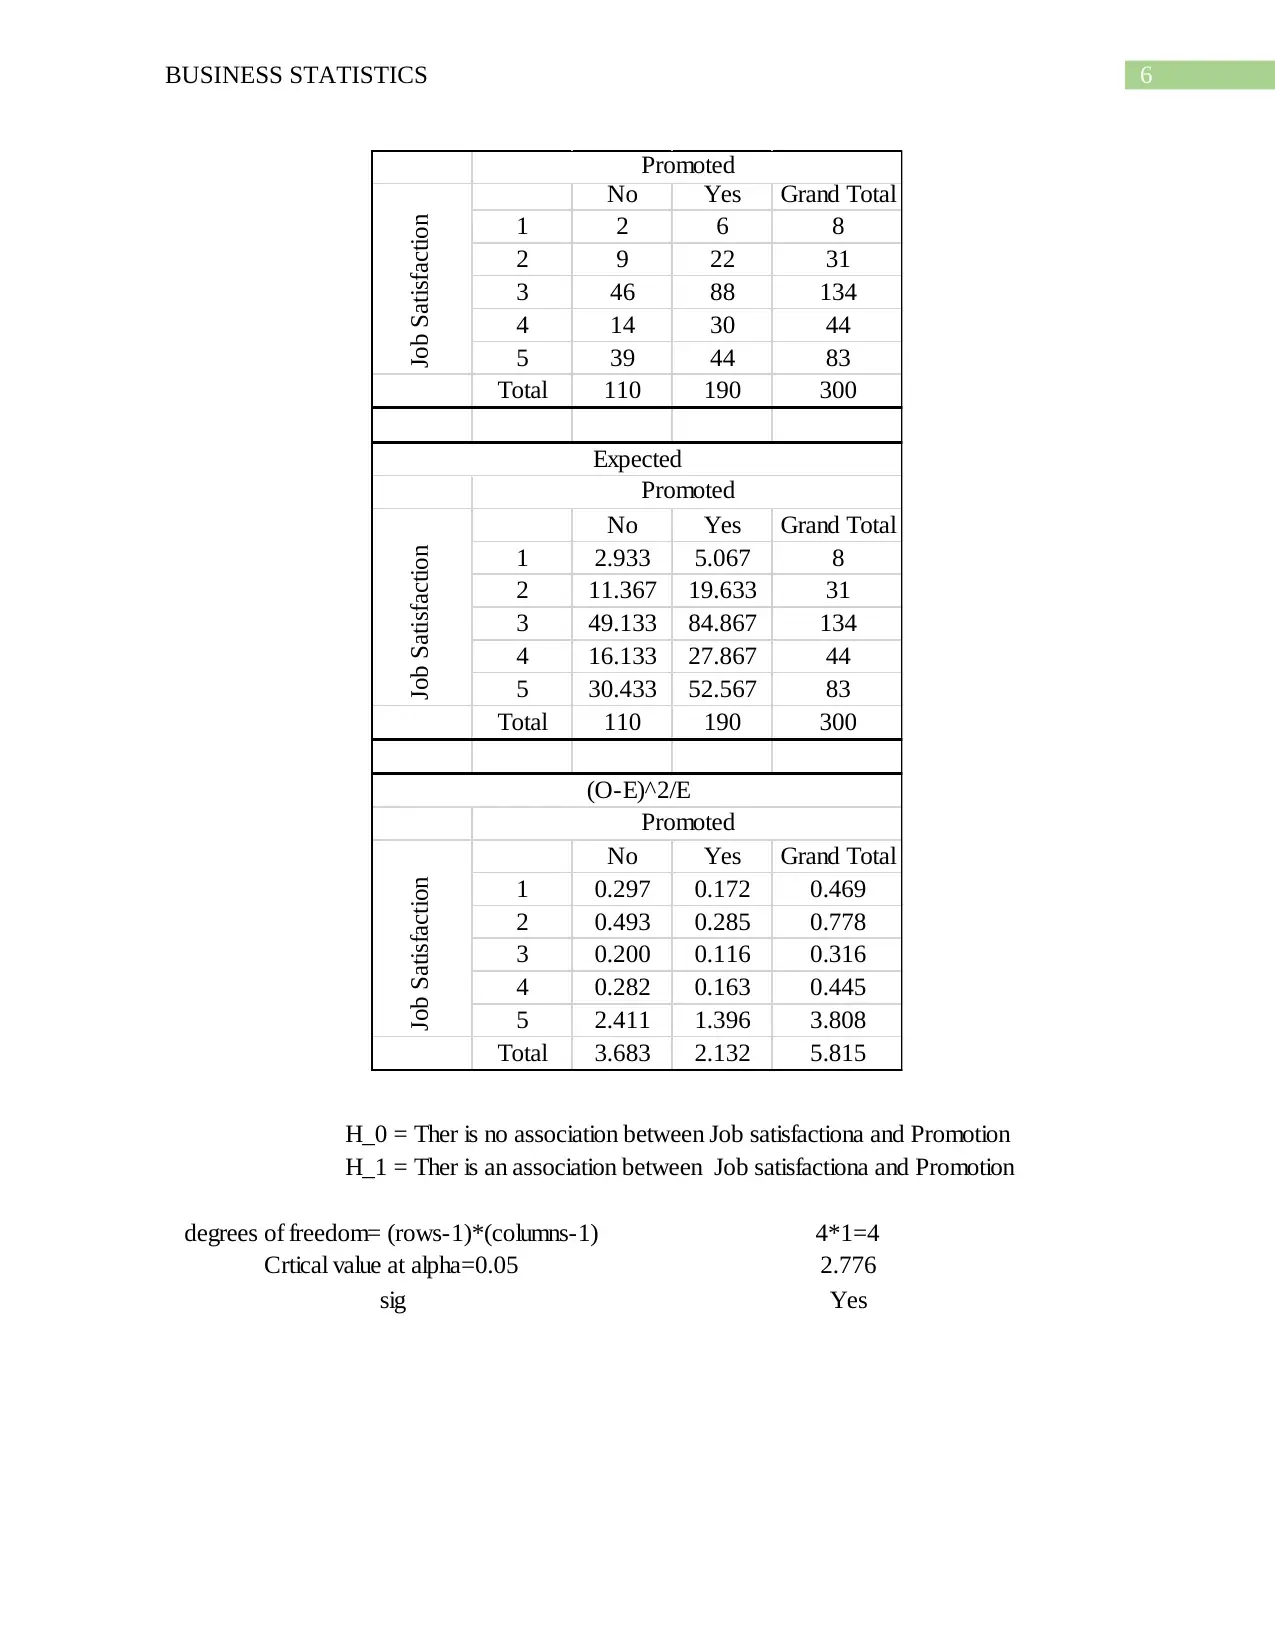
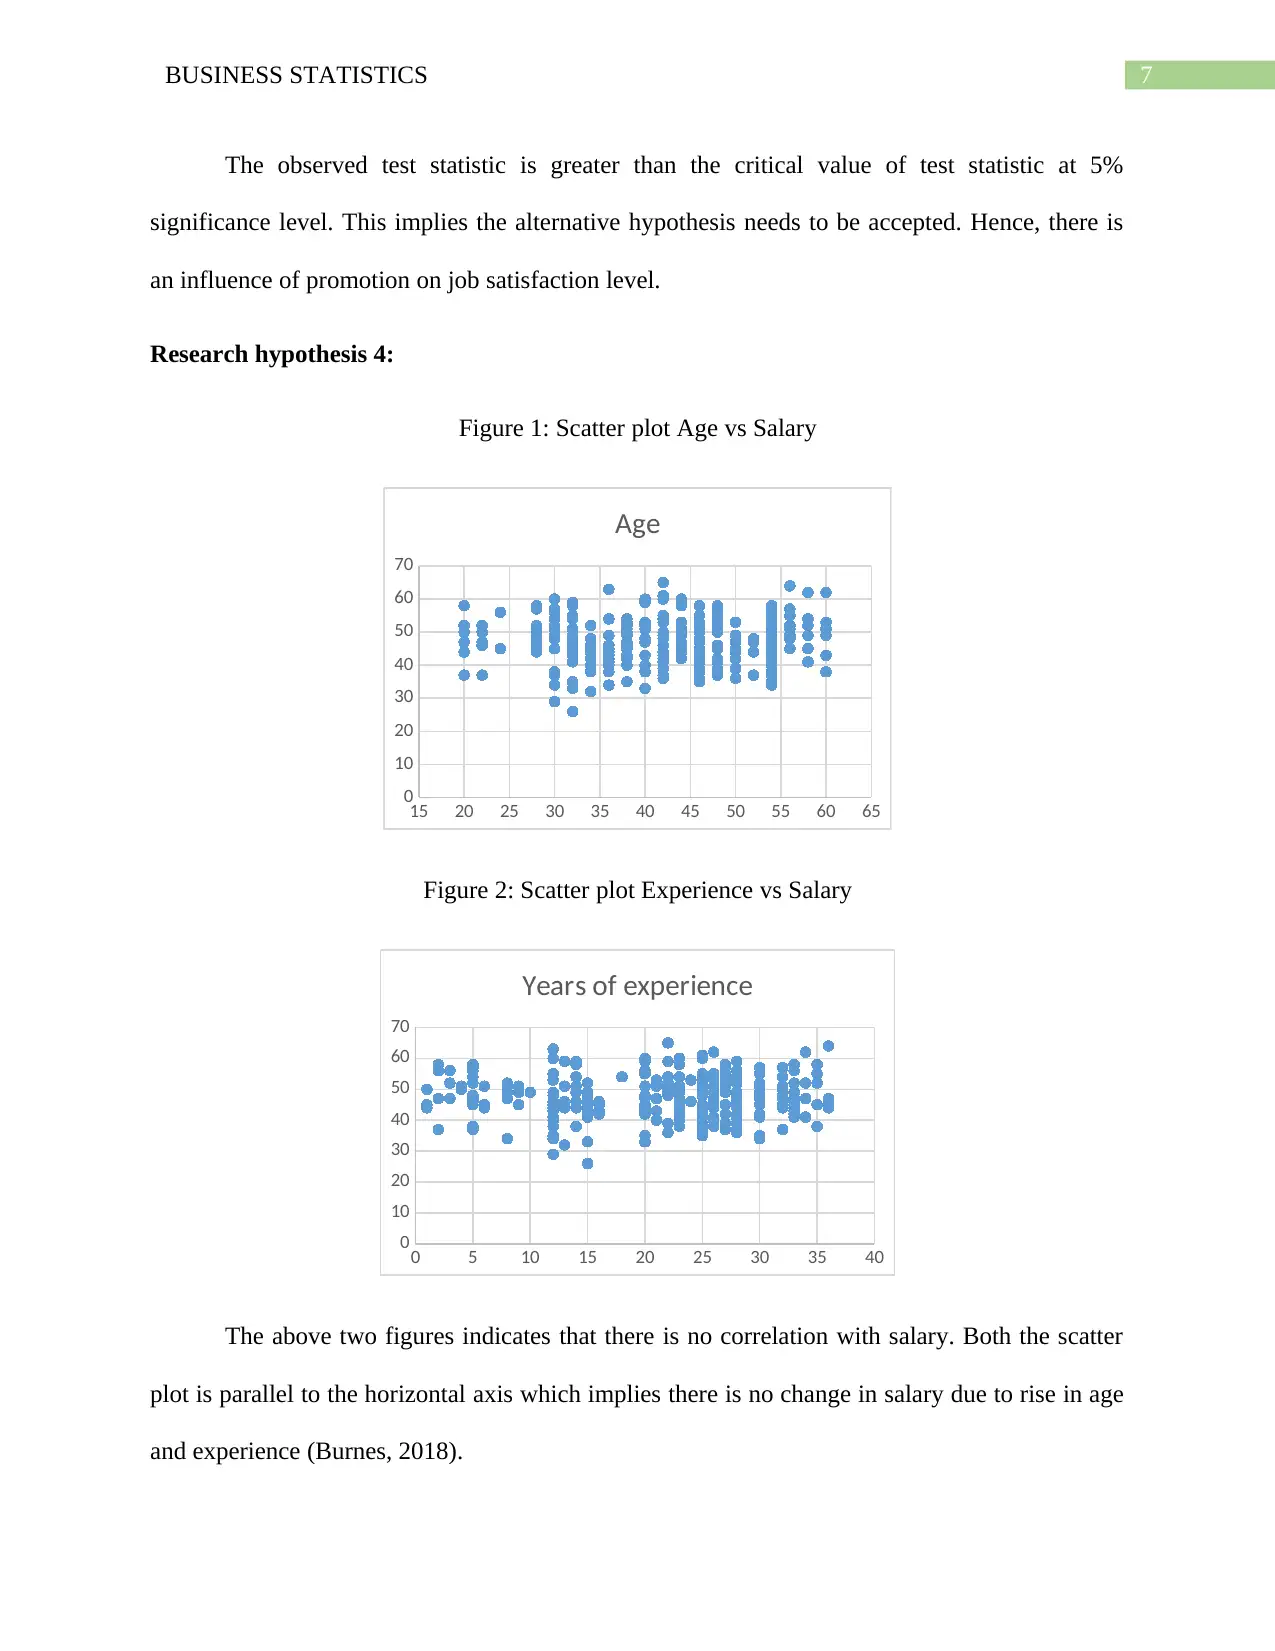
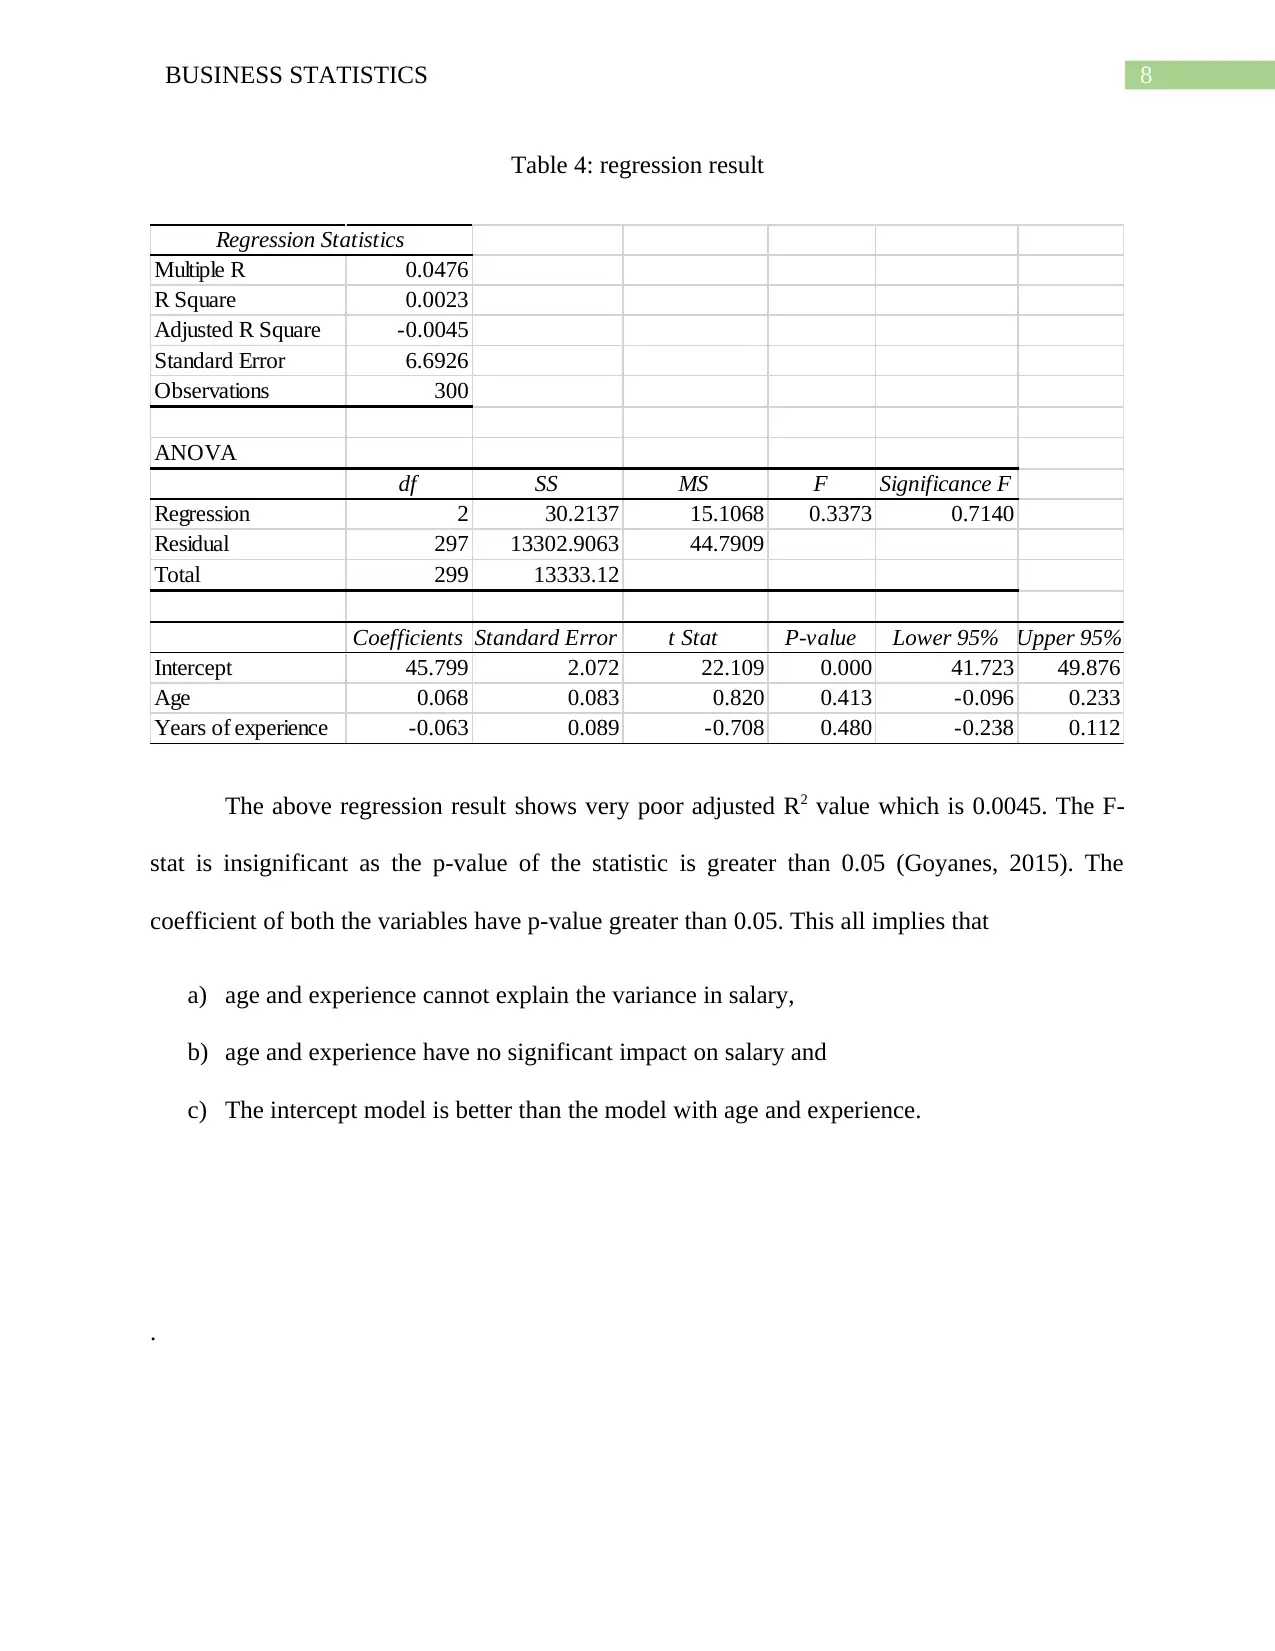
This report analyzes factors influencing job satisfaction using statistical methods. It investigates the relationship between gender and promotion, the impact of training on job satisfaction, and the influence of promotion on job satisfaction. The study employs statistical techniques such as paired sample t-tests, chi-square independence tests, and regression analysis to test several hypotheses. The results indicate no gender bias in promotions, training positively influences job satisfaction, and promotion impacts job satisfaction. However, the analysis finds no correlation between age, experience and salary. The report also includes a discussion of the statistical findings and their implications for improving employee satisfaction.
tabler-icon-diamond-filled.svg

Contribute Materials

Your contribution can guide someone’s learning journey. Share your documents today.
Document Page
Running head: BUSINESS STATISTICS
Business Statistics
Name of the Student
Name of the University
Course ID
tabler-icon-diamond-filled.svg

Secure Best Marks with AI Grader

Need help grading? Try our AI Grader for instant feedback on your assignments.
Document Page
1BUSINESS STATISTICS
Table of Contents
Introduction......................................................................................................................................2
Results..............................................................................................................................................3
Research hypothesis 1:................................................................................................................3
Research hypothesis 2:................................................................................................................4
Research hypothesis 3:................................................................................................................4
Research hypothesis 4:................................................................................................................6
Reference.........................................................................................................................................8
Document Page
2BUSINESS STATISTICS
Introduction
The report discusses about factors that has influence on the job satisfaction level and
relation with the age and experience of the employees. The collected data is very useful in
examining and finding important features of the employees that can improve the satisfaction
level of the employees from the job. Now, the study uses statistical tool and techniques in order
to achieve the research objectives. For instance, paired sample t-test, chi-square independence
test and regression analysis is used to conclude the answers of research questions. The above
tests are performed to test the hypothesis that leads to attain the research goals. The test and
hypothesis are mentioned below:
Research hypothesis 1
Null hypothesis, H0: There is no association between gender and promotion
Alternative Hypothesis, HA: There is an association between gender and promotion.
The hypothesis helps to find out whether any gender biasedness of promotion exists or
not.
Research hypothesis 2
Null hypothesis, H0: The difference between job satisfaction level before training and after
training is 0.
Alternative Hypothesis, HA: The difference between job satisfaction level before training and
after training is not 0.
This hypothesis is set to find out the influence of training on the satisfaction level.
Research hypothesis 3
Document Page
3BUSINESS STATISTICS
Null hypothesis, H0: There is no association between job satisfaction level and promotion.
Alternative Hypothesis, HA: There is no association between job satisfaction level and
promotion.
The hypothesis is constructed for identifying the crucial factor (promotion) that have an impact
on job satisfaction level.
Research hypothesis 4
Null hypothesis, H0: The mean coefficient value of the variables are 0.
Alternative Hypothesis, HA: The mean coefficient value of the variables are not 0.
This is to identify whether the variable has any impact on the job satisfaction level.
Results
Research hypothesis 1:
Table 1: Chi-square test
tabler-icon-diamond-filled.svg

Secure Best Marks with AI Grader

Need help grading? Try our AI Grader for instant feedback on your assignments.
Document Page
4BUSINESS STATISTICS
1 2 Grand Total
No 39 71 110
Yes 75 115 190
Grand Total 114 186 300
Female Male Grand Total
High Wage 41.800 68.200 110.000
Low Wage 72.200 117.800 190.000
Total 114.000 186.000 300.000
Female Male Grand Total
High Wage 0.188 0.115 0.303
Low Wage 0.109 0.067 0.175
Total 0.296 0.182 0.478
(O-E)^2/E
Gender
Promoted Promoted
Gender
Expected
Gender
Promoted
H_0 = Ther is no association between Promotion and Gender
H_1 = Ther is an association between Promotion and Gender
degrees of freedom= (rows-1)*(columns-1) 1*1
Crtical value at alpha=0.05 3.841
sig No
The above table contains the calculation for test statistic which is 0.478. The critical
value at 5% significance level is 3.841 which is greater than the observed test statistic. Hence,
the lack of null hypothesis fails to reject the null hypothesis (Udo & Grilo, 2016). Therefore,
there is no gender biasedness of promotion.
Research hypothesis 2:
Table 2: Paired sample t-test
Document Page
5BUSINESS STATISTICS
Mean -1.443
SD 1.486
SE 0.086
observed t -16.826
Critic t 1.968
P-value 0.000
Paired Sample t-test
The table 2 presents the calculation of t-stat for the mean difference of job satisfaction
level before and after training. The p-value of the t-stat is less than 0.05 which means training
improves the job satisfaction level (Liu, Lin & Wang, 2017).
Research hypothesis 3:
Table 3: Independence test
Document Page
6BUSINESS STATISTICS
No Yes Grand Total
1 2 6 8
2 9 22 31
3 46 88 134
4 14 30 44
5 39 44 83
Total 110 190 300
No Yes Grand Total
1 2.933 5.067 8
2 11.367 19.633 31
3 49.133 84.867 134
4 16.133 27.867 44
5 30.433 52.567 83
Total 110 190 300
No Yes Grand Total
1 0.297 0.172 0.469
2 0.493 0.285 0.778
3 0.200 0.116 0.316
4 0.282 0.163 0.445
5 2.411 1.396 3.808
Total 3.683 2.132 5.815
(O-E)^2/E
Promoted
Job Satisfaction
Promoted
Job Satisfaction
Promoted
Job Satisfaction
Expected
H_0 = Ther is no association between Job satisfactiona and Promotion
H_1 = Ther is an association between Job satisfactiona and Promotion
degrees of freedom= (rows-1)*(columns-1) 4*1=4
Crtical value at alpha=0.05 2.776
sig Yes
tabler-icon-diamond-filled.svg

Paraphrase This Document

Need a fresh take? Get an instant paraphrase of this document with our AI Paraphraser
Document Page
7BUSINESS STATISTICS
The observed test statistic is greater than the critical value of test statistic at 5%
significance level. This implies the alternative hypothesis needs to be accepted. Hence, there is
an influence of promotion on job satisfaction level.
Research hypothesis 4:
Figure 1: Scatter plot Age vs Salary
15 20 25 30 35 40 45 50 55 60 65
0
10
20
30
40
50
60
70
Age
Figure 2: Scatter plot Experience vs Salary
0 5 10 15 20 25 30 35 40
0
10
20
30
40
50
60
70
Years of experience
The above two figures indicates that there is no correlation with salary. Both the scatter
plot is parallel to the horizontal axis which implies there is no change in salary due to rise in age
and experience (Burnes, 2018).
Document Page
8BUSINESS STATISTICS
Table 4: regression result
Regression Statistics
Multiple R 0.0476
R Square 0.0023
Adjusted R Square -0.0045
Standard Error 6.6926
Observations 300
ANOVA
df SS MS F Significance F
Regression 2 30.2137 15.1068 0.3373 0.7140
Residual 297 13302.9063 44.7909
Total 299 13333.12
Coefficients Standard Error t Stat P-value Lower 95% Upper 95%
Intercept 45.799 2.072 22.109 0.000 41.723 49.876
Age 0.068 0.083 0.820 0.413 -0.096 0.233
Years of experience -0.063 0.089 -0.708 0.480 -0.238 0.112
The above regression result shows very poor adjusted R2 value which is 0.0045. The F-
stat is insignificant as the p-value of the statistic is greater than 0.05 (Goyanes, 2015). The
coefficient of both the variables have p-value greater than 0.05. This all implies that
a) age and experience cannot explain the variance in salary,
b) age and experience have no significant impact on salary and
c) The intercept model is better than the model with age and experience.
.
Document Page
9BUSINESS STATISTICS
Reference
Burnes, M. (2018). The effects of a campus-wide student employment program on securing full-
time employment, salary, and job satisfaction after graduation (Doctoral dissertation, University
of Alabama Libraries).
Goyanes, M. (2015). The value of proximity: Examining the willingness to pay for online local
news. International Journal of Communication, 9, 18.
Liu, S. F., Lin, P. Y., & Wang, M. H. (2017, July). The Effects of the Transparency of the
Guiding Diagrams on the Phone Interface for the Elderly. In International Conference on
Human Aspects of IT for the Aged Population (pp. 92-100). Springer, Cham.
Udo, T., & Grilo, C. M. (2016). Perceived weight discrimination, childhood maltreatment, and
weight gain in US adults with overweight/obesity. Obesity, 24(6), 1366-1372.
chevron_up_icon
1 out of 10
circle_padding
hide_on_mobile
zoom_out_icon
logo.png

Your All-in-One AI-Powered Toolkit for Academic Success.

Available 24*7 on WhatsApp / Email

[object Object]