Financial Analysis and Valuation of K2Fly Limited: Project Report
VerifiedAdded on 2020/05/16
|24
|5739
|25
Project
AI Summary
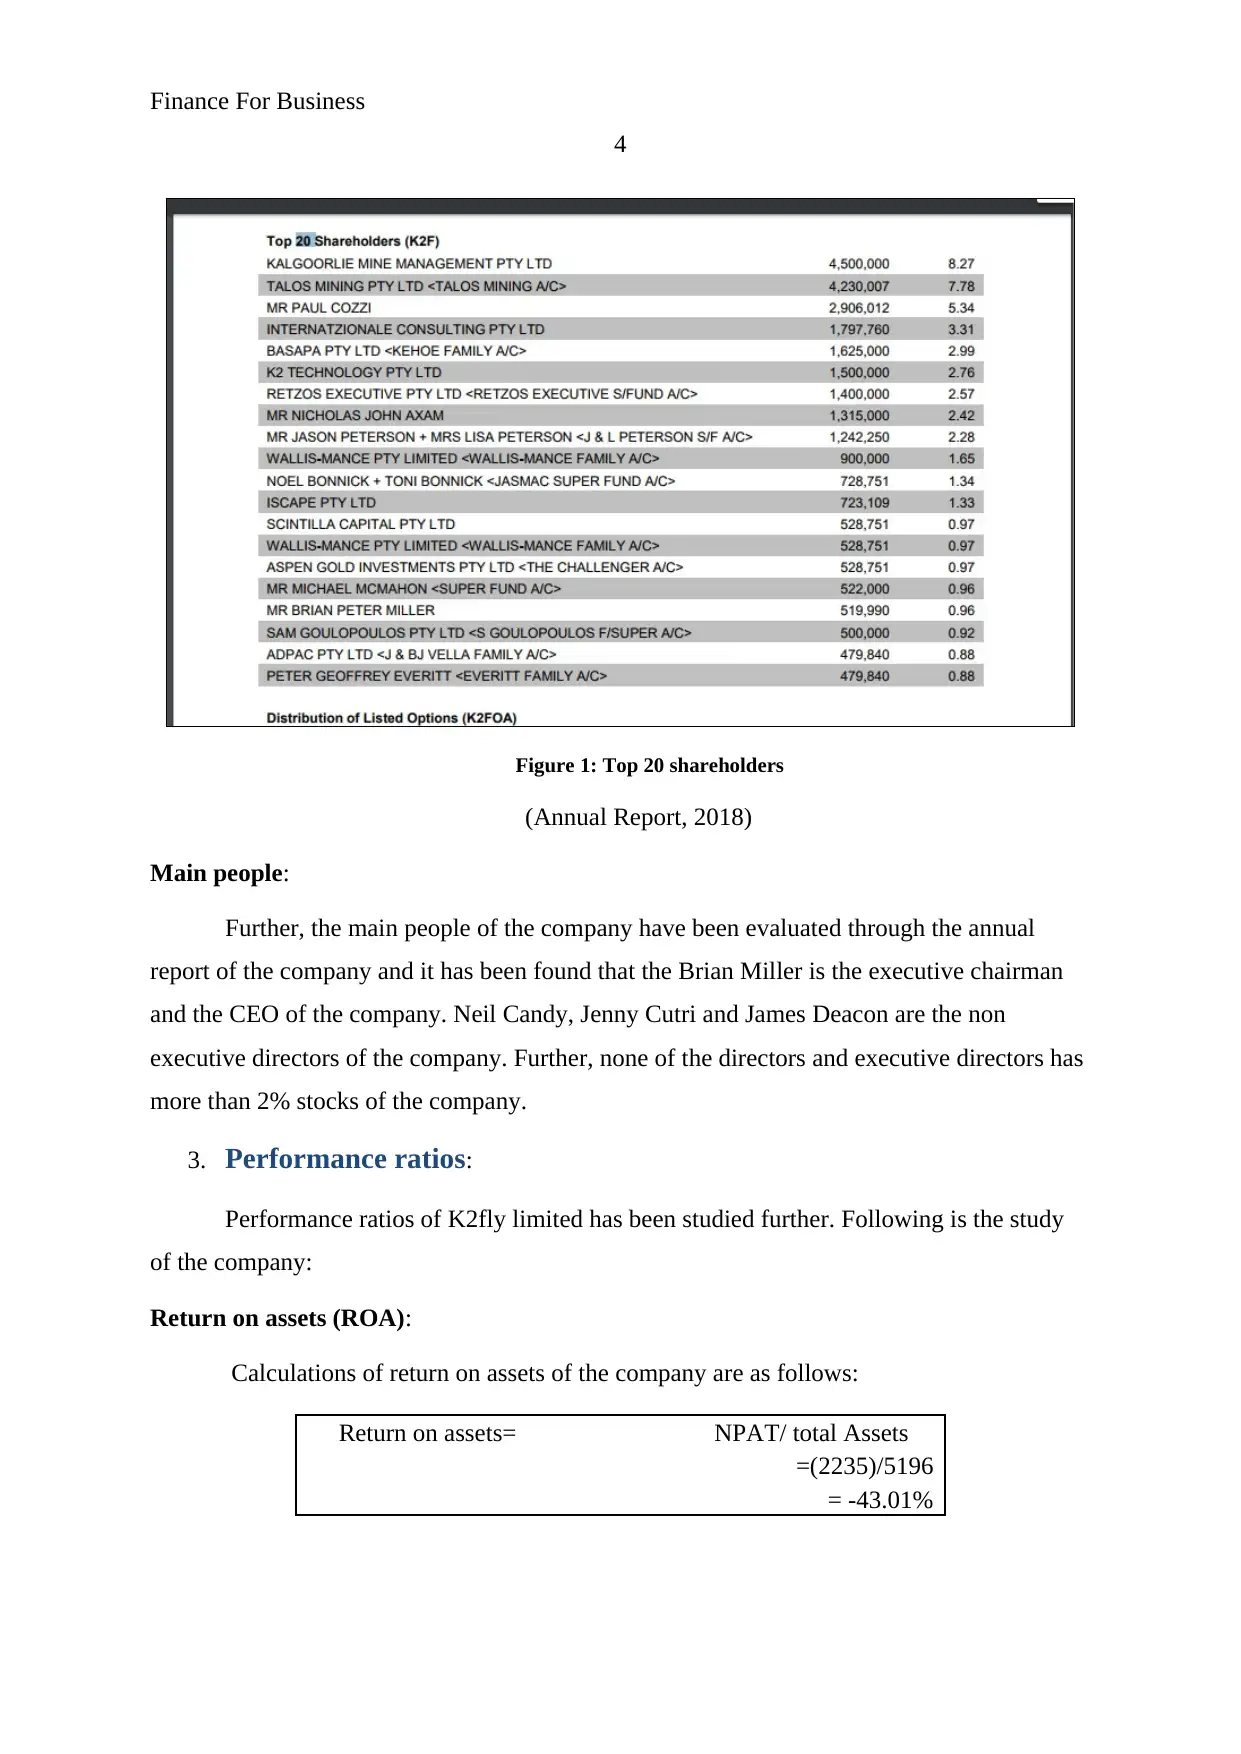
This project report presents a detailed financial analysis of K2Fly Limited, an Australian software and services company. The report begins with an introduction and company description, followed by an examination of the ownership and governance structure, highlighting key stakeholders and management personnel. It then delves into the company's performance ratios, including ROA, ROE, and debt ratios, revealing a challenging financial position. The analysis continues with an evaluation of stock price changes, significant factors influencing the stock, and the calculation of CAPM and beta values to assess risk and return. WACC calculations are also presented. The report explores debt ratios, dividend policy, and offers recommendations based on the findings, concluding that investment in the company is not advisable due to its financial performance. Supporting financial statements and calculations are provided in the appendix, offering a comprehensive overview of K2Fly Limited's financial standing.

Running Head: Finance For Business
1
Project Report: Finance for business
1
Project Report: Finance for business
Paraphrase This Document
Need a fresh take? Get an instant paraphrase of this document with our AI Paraphraser

Finance For Business
2
Contents
1. Introduction and company description....................................................................3
2. Ownership governance structure.............................................................................3
3. Performance ratios...................................................................................................4
4. Changes in stock price.............................................................................................5
5. Significant factors....................................................................................................6
6. Calculation of CAPM and beta values.....................................................................6
7. WACC calculations.................................................................................................7
8. Debt ratios................................................................................................................8
9. Dividend policy........................................................................................................8
10. Recommendation and Conclusion...........................................................................8
References.......................................................................................................................10
Appendix.........................................................................................................................11

Finance For Business
3
1. Introduction and company description:
This report depicts about the valuation and the worth of the K2Fly limited. This
company is managing its business through Australian market. For evaluating the worth of the
company, various financial evaluation and analysis techniques have been used. Firstly, the
ownership of the company has been evaluated and in addition, the study has been conducted
over the stock price, financial statement and the AORD stock to evaluate the market position
and financial position of the company. The company is working under Software and service
industry of Australia (About us, 2018). The financial performance of the company is not that
much good. Still, the current changes of the company are quite competitive.
2. Ownership governance structure:
This Section depicts about the governance structure of K2Fly limited.
Substantial stakeholders:
The annual report of K2Fly limited explain that around 55% stock of the company
are held by the top 20 shareholders of the company out of which the highest stock are held by
KALGOORLIE MINE MANAGEMENT PTY LTD which is total of 8.27% of the stock.
Further, the 2nd and 3rd top shareholder of the company is TALOS MINING PTY LTD
<TALOS MINING A/C> and MR PAUL COZZI who are holding 7.78% and 5.34% share of
the company. Following figure-1 explain about the shareholders of the company in brief:
⊘ This is a preview!⊘
Do you want full access?
Subscribe today to unlock all pages.

Trusted by 1+ million students worldwide

Finance For Business
4
Figure 1: Top 20 shareholders
(Annual Report, 2018)
Main people:
Further, the main people of the company have been evaluated through the annual
report of the company and it has been found that the Brian Miller is the executive chairman
and the CEO of the company. Neil Candy, Jenny Cutri and James Deacon are the non
executive directors of the company. Further, none of the directors and executive directors has
more than 2% stocks of the company.
3. Performance ratios:
Performance ratios of K2fly limited has been studied further. Following is the study
of the company:
Return on assets (ROA):
Calculations of return on assets of the company are as follows:
Return on assets= NPAT/ total Assets
=(2235)/5196
= -43.01%
Paraphrase This Document
Need a fresh take? Get an instant paraphrase of this document with our AI Paraphraser

Finance For Business
5
It explains that the company is facing huge loss and thus the position and performance
of the company is not at all good.
Return on equity (ROE):
Calculations of return on equity of the company are as follows:
Return on Equity=
Net profit after tax/
ordinary equity
(2235)/11683
-19.13%
It explains that the company is facing huge loss and thus the position and performance
of the company is not at all good (Kaplan and Atkinson, 2015).
Debt ratios:
Calculations of debt ratio of the company are as follows:
Debt Ratios =
Total Liabilities/ total
assets
415/5196
7.99%
It explains that the current debt ratio of the company is not at all good.
TA/OE:
Further, the phenomenon of TA/Te has been evaluated and the following equation has
been found:
TA/TE = (NPAT/ Total
assets)/(NPAT/TE)
TA/TE =Total assets/TE
It explains that the few changes into the total assets and the total equity of the
company would directly affect the performance and the ROA and ROE of the company.
ROA and ROE:

Finance For Business
6
In addition, the ROA of the company is -43.01% and -19.13% which explains that the
ROE of the company is greater. Accoridng to XXX, ROE is always greater due to the less
amount of equity in an organization in comparison with the total assets of the company.
4. Changes in stock price:
Figure 2: Changes in stock price
(Yahoo Finance, 2018)
Evalaution:
The above study and figure 2 explain about the stock price of K2Fly limited and
AORD. The graph explains that the stock price of AORD is quite volatile. The correlation of
the company is 0.02% which depicts about the less positive relations among the AORD and
the K2Fly limited.
5. Significant factors:
Further, the annual report of the company explains that the stock prices of the
company have been fluctuated lot in last 2 years. The main points due to which the stock
price of the company has been affected are changes in the management, win of law suits of
the company, new technology of the company, better financial position of the company,
financial analyst report about the company has impacted positively on the stock price of the
company (Annual Report, 2018).
6. Calculation of CAPM and beta values:
⊘ This is a preview!⊘
Do you want full access?
Subscribe today to unlock all pages.

Trusted by 1+ million students worldwide

Finance For Business
7
Beta:
Further, the beta of K2Fly limited is 0.03% which explains that the level of risk of
the company is quite lower.
Required rate of return (CAPM):
Further, required rate of return calculations are as follows:
Calculation of cost of equity (CAPM)
RF 4.00%
RM 6.00%
Beta 0.03%
Required rate of return 4.00%
(Morningstar, 2018)
Explanation:
The above calculations express that the cost of equity of the company is 4% which
depicts that if the company wants to enhance the level of equity than it has to pay 4% as cost.
7. WACC calculations:
Calculation of WACC
Price Cost Weight WACC
Debt 69 4.20% 0.00587 0.00025
Equity 11,683 4.00% 0.99413 0.03977
11,752 Kd 4.00%
Calculation of cost of debt
Outstanding debt 69
interest rate 6%
Tax rate 0.3
Kd 4.20%
Calculation of cost of equity
(CAPM)
RF 4.00%
RM 6.00%
Beta 0.03%
Required rate of return 4.00%
Paraphrase This Document
Need a fresh take? Get an instant paraphrase of this document with our AI Paraphraser

Finance For Business
8
Evaluation:
The above calculations of required rate of return explain that the total cost of the
company to raise the funds is 4%. Currently, the cost of debt and cost of equity of the
company are 4.2% and 4% which explain that cost of capital is quite moderate. Further, it
explains about the lower weight of debt in comparison with the total equity (Brealey, Myers
and Marcus, 2007).
8. Debt ratios:
Optimal capital structure:
Optimal capital structure of the company explains that the capital structure of the
company is not stable. The level of debt ratios have been lowered from 42.54% to 7.99% in
2017. The total assets of the company have been enhanced a lot in 2017.
2017 2016
Debt Ratios =
Total Liabilities/ total
assets
Total Liabilities/ total
assets
415/5196 57/134
7.99% 42.54%
Gearing ratios:
Further, the gearing ratios of the company explain that the capital employed of the
company has been enhanced a lot in 2017 and at the same time, the total liabilities of the
company has also been enhanced. Director’s report explains that the total assets and liabilities
have been enhanced to manage the performance in better way (Kinsky, 2011).
2017 2016
Gearing ratios =
Total Liabilities/ Capital
employed
Total Liabilities/
Capital employed
415/(5196-134) 57/(134-133)
8.20% 0.00%
9. Dividend policy:

Finance For Business
9
Further, the dividend position of the company has been evaluated and the annual report
of the company explains that the company has faced lot losses in current year and due to
which no dividend has been paid by the company to the investors. Though, the company is
following the relevant dividend policies but due to no reserves and profit, it is not able to pay
the dividend (Brigham and Ehrhardt, 2013).
10. Recommendation and Conclusion:
Further, through this report, it is recommended to the investors to not to invest into the
company as the return of the company is quite lesser and the company is not offering any
dividend from last 2 years. On the other hand, huge losses are also faced by the company.
Thus, it depicts that the investors must not go for the company.
⊘ This is a preview!⊘
Do you want full access?
Subscribe today to unlock all pages.

Trusted by 1+ million students worldwide

Finance For Business
10
References:
About us. 2018. K2Fly Limited. viewed Jan 25, 2018, https://www.k2fly.com/about-us/
Annual Report. 2018. K2Fly Limited. viewed Jan 25, 2018, https://www.k2fly.com/wp-
content/uploads/2017/10/K2Fly-Limited-2017-Annual-Report-to-Shareholders.pdf
Brealey, R., Myers, S.C. and Marcus, A.J., 2007. Fundamentals of Corporate Finance. Mc
Graw Hill, New York.
Brigham, E.F. and Ehrhardt, M.C., 2013. Financial management: Theory & practice.
Cengage Learning.
Kaplan, R.S. and Atkinson, A.A., 2015. Advanced management accounting. PHI Learning.
Kinsky, R. 2011. Charting Made Simple: A Beginner's Guide to Technical Analysis. John
Wiley & Sons.
Morningstar. 2018. K2Fly Limited. viewed Jan 25, 2018,
http://financials.morningstar.com/cash-flow/cf.html?t=K2F®ion=aus&culture=en-US
Yahoo finance. 2018. K2Fly Limited. viewed Jan 25, 2018,
https://finance.yahoo.com/quote/K2F.AX/chart?p=K2F.AX
Paraphrase This Document
Need a fresh take? Get an instant paraphrase of this document with our AI Paraphraser

Finance For Business
11
Appendix:
K2FLY LTD (K2F) CashFlowFlag INCOME STATEMENT
Fiscal year ends in June. AUD in
thousands except per share data.
2017-
06
2016-
06
2015-
06
2014-
06
2013-
06
Revenue 627
Cost of revenue 249
Gross profit 378
Operating expenses
Research and development 51
Sales, General and administrative 1693 57 56 52 52
Other operating expenses 877 9 25 15 29
Total operating expenses 2622 66 81 67 81
Operating income -2244 -66 -81 -67 -81
Other income (expense) 9 0 39 41 1
Income before taxes -2235 -66 -42 -26 -80
Net income from continuing operations -2235 -66 -42 -26 -80
Net income -2235 -66 -42 -26 -80
Net income available to common
shareholders -2235 -66 -42 -26 -80
Earnings per share
Basic -0.07 -0.01 -0.01 -0.01 -0.02
Diluted -0.07 -0.01 -0.01 -0.01 -0.02
Weighted average shares outstanding
Basic 33358 5020 5020 5020 4319
Diluted 33358 5020 5020 5020 4319
EBITDA -1817 -66 -81 -67 -81
K2FLY LTD (K2F) CashFlowFlag BALANCE SHEET
Fiscal year ends in June. AUD
in thousands except per share
data.
2017-
06
2016-
06
2015-
06
2014-
06
2013-
06
Assets
Current assets
Cash
Cash and cash equivalents 1744 30 27 44 98
Total cash 1744 30 27 44 98
Receivables 360 2 1 5 7
Prepaid expenses 1
Total current assets 2104 32 29 50 107
Non-current assets
Property, plant and equipment

Finance For Business
12
Gross property, plant and
equipment 16 24 23 37 40
Accumulated Depreciation -3 -5
Net property, plant and
equipment 13 24 23 37 35
Equity and other investments 1 1 1 3 3
Intangible assets 3076
Other long-term assets 2
Total non-current assets 3093 25 23 40 38
Total assets 5196 57 52 89 145
Liabilities and stockholders'
equity
Liabilities
Current liabilities
Short-term debt 100
Accounts payable 75 34 28 58 100
Other current liabilities 271
Total current liabilities 346 134 28 58 100
Non-current liabilities
Other long-term liabilities 69 35
Total non-current liabilities 69 35
Total liabilities 415 134 63 58 100
Stockholders' equity
Common stock 11683 4814 4814 4814 4814
Retained earnings -7126 -4891 -4825 -4783 -4983
Accumulated other
comprehensive income 225 0 214
Total stockholders' equity 4782 -77 -11 31 45
Total liabilities and
stockholders' equity 5196 57 52 89 145
K2FLY LTD (K2F) Statement of CASH FLOW
Fiscal year ends in June. AUD in thousands
except per share data.
2017-
06
2016-
06
2015-
06
2014-
06
2013-
06
Cash Flows From Operating Activities
Other non-cash items -1659 -61 -46 -51 -67
Net cash provided by operating activities -1659 -61 -46 -51 -67
Cash Flows From Investing Activities
Investments in property, plant, and
equipment -16 -1 -6 -3 -20
Other investing activities -8
⊘ This is a preview!⊘
Do you want full access?
Subscribe today to unlock all pages.

Trusted by 1+ million students worldwide
1 out of 24
Related Documents

Your All-in-One AI-Powered Toolkit for Academic Success.
+13062052269
info@desklib.com
Available 24*7 on WhatsApp / Email
Unlock your academic potential
Copyright © 2020–2025 A2Z Services. All Rights Reserved. Developed and managed by ZUCOL.