KADLex PLC Financial Report: Management, Control, Investment Review
VerifiedAdded on 2023/06/07
|17
|4531
|370
Report
AI Summary
This report provides a comprehensive financial analysis of KADLex PLC, a financial consultancy company in London. It evaluates various financial ratios, including profitability, liquidity, gearing, and asset utilization ratios, to assess the company's financial health and performance compared to the previous year. The report also includes a break-even analysis and discusses the importance of this metric in profitability management. Furthermore, it delves into investment techniques such as payback period, discounted payback period, accounting rate of return (ARR), net present value (NPV), and internal rate of return (IRR) to evaluate investment opportunities for Perri-Perri Sauce Ltd. Finally, the report outlines the budgeting process and explains how targets, budgets, and strategic plans are interrelated within an organization. This assignment is available on Desklib, where students can find more solved assignments and study resources.

Financial Management
and Control
and Control
Paraphrase This Document
Need a fresh take? Get an instant paraphrase of this document with our AI Paraphraser
Contents
Contents...........................................................................................................................................2
Introduction......................................................................................................................................3
Question 1 KADLex PLC................................................................................................................3
Evaluate the various types of ratios of KADLex Plc...................................................................3
2. Break even analysis and critically discuss how each of these three metric.............................7
Part B...............................................................................................................................................8
Calculation of the payback, discounted payback, ARR, NPV and IRR with the help of
investment techniques..................................................................................................................8
Sources of finance......................................................................................................................12
PART C..........................................................................................................................................13
Process of budgeting and how targets, budgets, and strategic plans are interrelated................13
REFERENCES..............................................................................................................................15

⊘ This is a preview!⊘
Do you want full access?
Subscribe today to unlock all pages.
Trusted by 1+ million students worldwide
Introduction
Financial management refers to corporate maintenance of the organization. It helps to
acquisition of dividends and efficient utilization of the funds of any business. There are three
important factor of this management such as funding, dividend and corporate decisions. Controls
are the processors, policies through which the organization analyse and control the position,
portion and utilization of the resources (Polak, 2019). KEDLex PLC is the financial consultancy
company which is situated in the London. The director has prepared the report of ratios and
break even analysis, operating leverage of the business that are discussed below. In this report,
there is another company which is Perri-Perri sauce Ltd that is fast food company in London and
the manager has researched on the investment techniques.
PART A
Question 1 KADLex PLC
Evaluate the various types of ratios of KADLex Plc
Profitability ratio: This ratio helps the company to measure the fiscal performance and the
capability of the enterprise to earn revenues. It assists the organisation to evaluate and compare
the financial health with identical organisation or with past data (Santis and et al., 2018).
1. Gross profit ratio: It indicates the ability of the organisation to generate maximum revenue
by minimising his operating expenses. It is the difference between revenue and cost of goods
sold.
In 2021 Gross profit ratio = Gross profit / Net sales *100
= 31200/58700*100
= 53.15 %
In 2020, Gross profit ratio = 26120/48600*100
= 53.74 %
Interpretation: The gross profit ratio of KADLex PLC in 2021 is 53.15 which is reduced by
very insignificant percentage in against with 2020. KADLex has increased his revenue in 2021
but company has not taken steps to minimise the trading expenses.
2. Net profit ratio: This ratio describe the profit or loss earned by the company after paying
interest and taxes. It shows the relation between earnings after interest and taxes and the
revenue.
Paraphrase This Document
Need a fresh take? Get an instant paraphrase of this document with our AI Paraphraser
In 2021, Net profit ratio = Net profit / Revenue*100
= 13760/58700*100
= 23.44%
In 2020 = 11276/48600*100
= 23.20 %
Interpretation: The income profit ratio of the organisation in 2021 has increased with minor
percentage as comparison to 2020. Entity has to decrease his direct as well as indirect expenses
to increase the profit.
3. Operating profit ratio: It is measured by subtracting indirect expenses from gross profit
(Naranjo Tuesta, Crespo Soler, and Ripoll Feliu,2021). Company with more operating profit ratio
is able to cover the static expenses like depreciation, interest payment etc. through this company
have opportunity to survive in recession condition.
In 2021, Operating profit ratio = Operating profit/ Net sales*100
= 22450/58700*100
= 38.24%
In 2020 = 19070/48600*100
= 39.23%
Interpretation: The company operating profit in 2021 has decreased by 1 percent in relation to
2020. Lower operating profit ratio means company is not able to carry out its operations
efficiently.
Liquidity ratio:
1. Current ratio: This helps the business to know its short term solvency of the company. It is
the power of the organization is to pay the short term debts from current assets (Bechir and et al.,
2022).
In 2021, Current ratio = Current assets / Current liabilities
= 50275/10375
= 4.84
In 2020 = 45500/10800
= 4.21
Interpretation: The current ratio of KADLex PLC is 4.84 in 2021 which is higher than 2020 ratio.
This means company has more short term assets to pay its current obligations and enterprise has
high liquidity in the market.
2. Quick ratio: This is also known as acid test ratio. It is calculated by deducting inventory or
prepaid expenses from current assets (Miller and et al., 2019). It denotes the frequency of
payment of liabilities from cash.
KADLex PLC Quick ratio in 2021 = Quick assets / Current liabilities
= 34325/10375
= 3.3
In 2020 = 33340/10800
= 3.08
Interpretation: In 2021 the acid test ratio of KADLex PLC has increased with small change
which is 3.3 and higher than 2020. It indicates the organisation is efficient, healthy and can meet
out its short term obligations.
Gearing ratio
1. Debt equity ratio: It shows the relation between debt and equity. It measures that how
company long term debt is financed by the equity. The perfect debt equity ratio is 1:1.
KADLex PLC 2021 debt equity ratio = debt / equity
= 34375/64025
= 0.53
In 2020 = 34375/50945
= 0.67
Interpretation: The low debt equity ratio is best. In 2021 the ratio of the business has reduced to
0.53 which is good sign for the company. It means company have more internal funds and can
pay the amount of long term debt.
2. Proprietary ratio: It denotes that how much portion of current or non-current assets funded
by the owners’ equity. It provides benefits to suppliers to assess the fiscal outlook of the
company (Rossi, Boylan and Cebula, 2018).
KADLex PLC 2021 equity to assets ratio = Shareholders fund / Total assets
= 64025/108775
⊘ This is a preview!⊘
Do you want full access?
Subscribe today to unlock all pages.
Trusted by 1+ million students worldwide
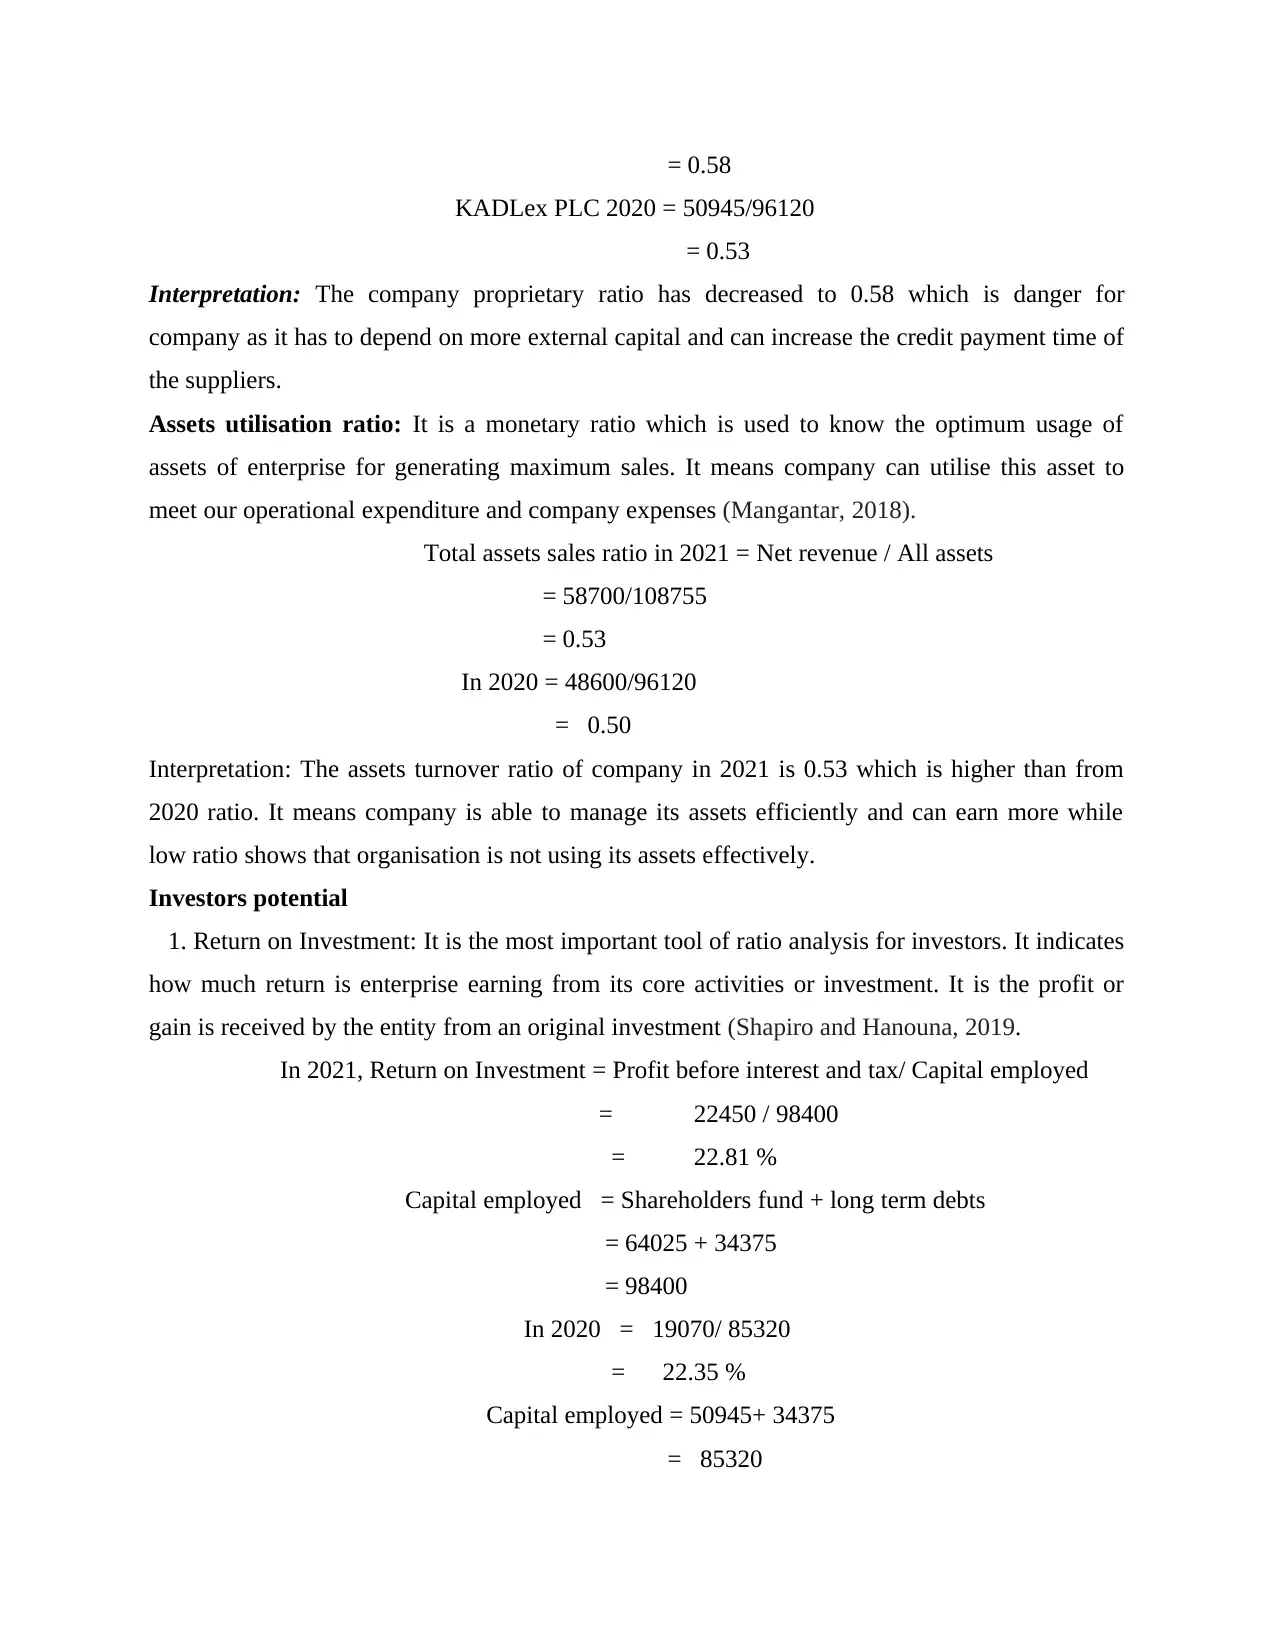
= 0.58
KADLex PLC 2020 = 50945/96120
= 0.53
Interpretation: The company proprietary ratio has decreased to 0.58 which is danger for
company as it has to depend on more external capital and can increase the credit payment time of
the suppliers.
Assets utilisation ratio: It is a monetary ratio which is used to know the optimum usage of
assets of enterprise for generating maximum sales. It means company can utilise this asset to
meet our operational expenditure and company expenses (Mangantar, 2018).
Total assets sales ratio in 2021 = Net revenue / All assets
= 58700/108755
= 0.53
In 2020 = 48600/96120
= 0.50
Interpretation: The assets turnover ratio of company in 2021 is 0.53 which is higher than from
2020 ratio. It means company is able to manage its assets efficiently and can earn more while
low ratio shows that organisation is not using its assets effectively.
Investors potential
1. Return on Investment: It is the most important tool of ratio analysis for investors. It indicates
how much return is enterprise earning from its core activities or investment. It is the profit or
gain is received by the entity from an original investment (Shapiro and Hanouna, 2019.
In 2021, Return on Investment = Profit before interest and tax/ Capital employed
= 22450 / 98400
= 22.81 %
Capital employed = Shareholders fund + long term debts
= 64025 + 34375
= 98400
In 2020 = 19070/ 85320
= 22.35 %
Capital employed = 50945+ 34375
= 85320
Paraphrase This Document
Need a fresh take? Get an instant paraphrase of this document with our AI Paraphraser
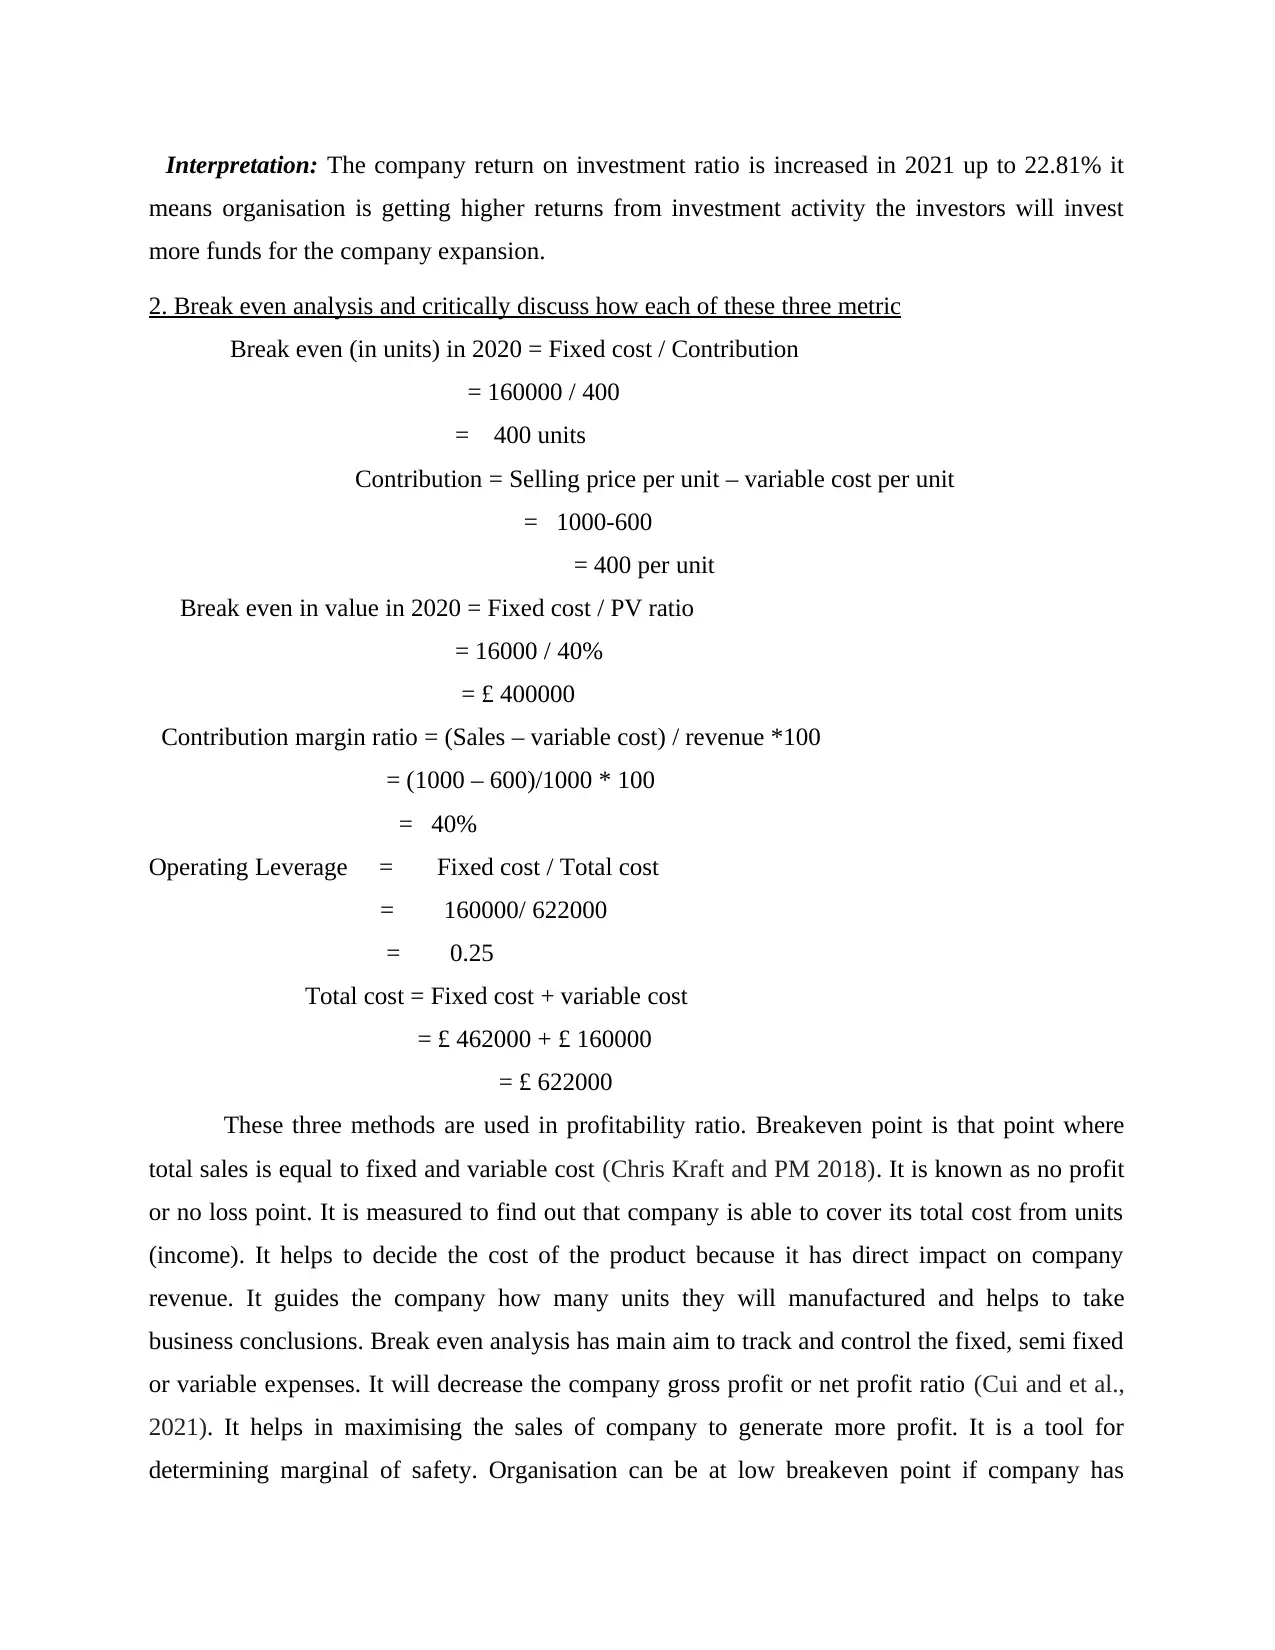
Interpretation: The company return on investment ratio is increased in 2021 up to 22.81% it
means organisation is getting higher returns from investment activity the investors will invest
more funds for the company expansion.
2. Break even analysis and critically discuss how each of these three metric
Break even (in units) in 2020 = Fixed cost / Contribution
= 160000 / 400
= 400 units
Contribution = Selling price per unit – variable cost per unit
= 1000-600
= 400 per unit
Break even in value in 2020 = Fixed cost / PV ratio
= 16000 / 40%
= £ 400000
Contribution margin ratio = (Sales – variable cost) / revenue *100
= (1000 – 600)/1000 * 100
= 40%
Operating Leverage = Fixed cost / Total cost
= 160000/ 622000
= 0.25
Total cost = Fixed cost + variable cost
= £ 462000 + £ 160000
= £ 622000
These three methods are used in profitability ratio. Breakeven point is that point where
total sales is equal to fixed and variable cost (Chris Kraft and PM 2018). It is known as no profit
or no loss point. It is measured to find out that company is able to cover its total cost from units
(income). It helps to decide the cost of the product because it has direct impact on company
revenue. It guides the company how many units they will manufactured and helps to take
business conclusions. Break even analysis has main aim to track and control the fixed, semi fixed
or variable expenses. It will decrease the company gross profit or net profit ratio (Cui and et al.,
2021). It helps in maximising the sales of company to generate more profit. It is a tool for
determining marginal of safety. Organisation can be at low breakeven point if company has
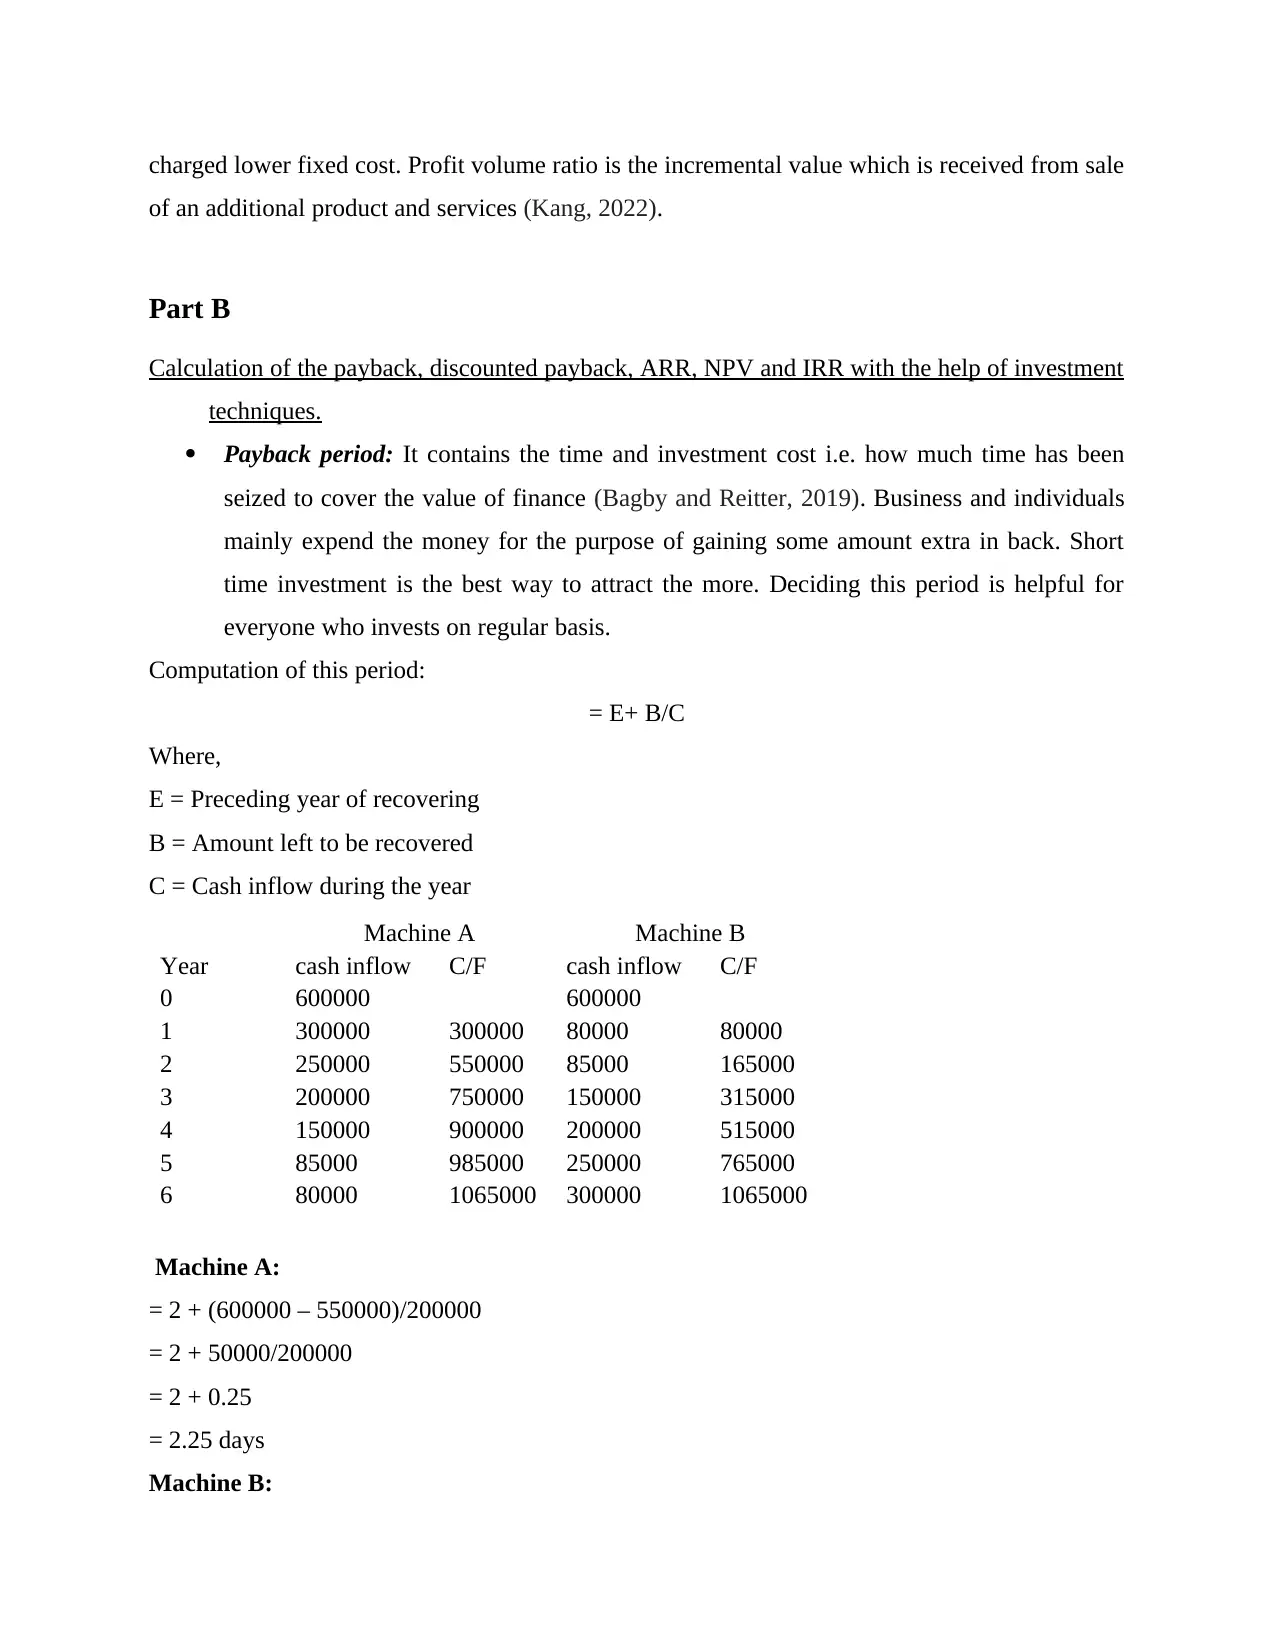
charged lower fixed cost. Profit volume ratio is the incremental value which is received from sale
of an additional product and services (Kang, 2022).
Part B
Calculation of the payback, discounted payback, ARR, NPV and IRR with the help of investment
techniques.
Payback period: It contains the time and investment cost i.e. how much time has been
seized to cover the value of finance (Bagby and Reitter, 2019). Business and individuals
mainly expend the money for the purpose of gaining some amount extra in back. Short
time investment is the best way to attract the more. Deciding this period is helpful for
everyone who invests on regular basis.
Computation of this period:
= E+ B/C
Where,
E = Preceding year of recovering
B = Amount left to be recovered
C = Cash inflow during the year
Machine A Machine B
Year cash inflow C/F cash inflow C/F
0 600000 600000
1 300000 300000 80000 80000
2 250000 550000 85000 165000
3 200000 750000 150000 315000
4 150000 900000 200000 515000
5 85000 985000 250000 765000
6 80000 1065000 300000 1065000
Machine A:
= 2 + (600000 – 550000)/200000
= 2 + 50000/200000
= 2 + 0.25
= 2.25 days
Machine B:
⊘ This is a preview!⊘
Do you want full access?
Subscribe today to unlock all pages.
Trusted by 1+ million students worldwide
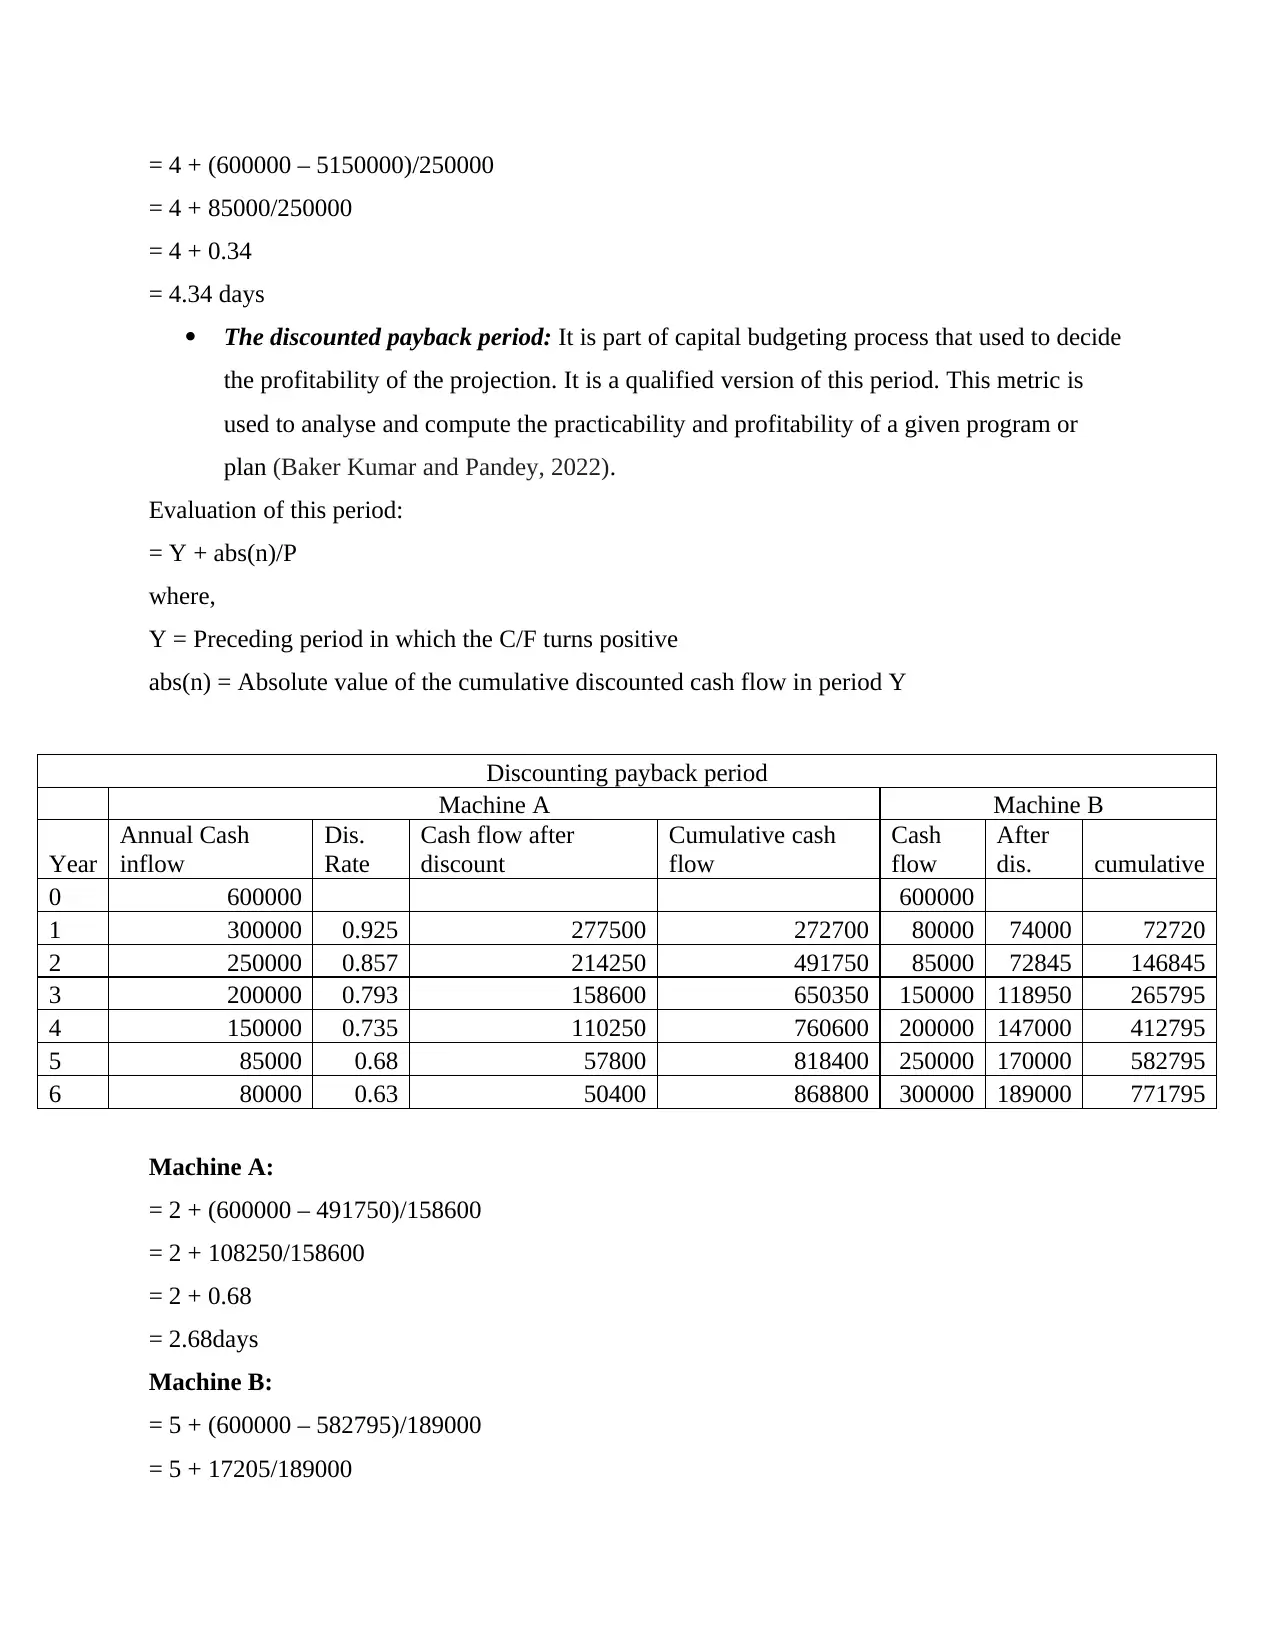
= 4 + (600000 – 5150000)/250000
= 4 + 85000/250000
= 4 + 0.34
= 4.34 days
The discounted payback period: It is part of capital budgeting process that used to decide
the profitability of the projection. It is a qualified version of this period. This metric is
used to analyse and compute the practicability and profitability of a given program or
plan (Baker Kumar and Pandey, 2022).
Evaluation of this period:
= Y + abs(n)/P
where,
Y = Preceding period in which the C/F turns positive
abs(n) = Absolute value of the cumulative discounted cash flow in period Y
Discounting payback period
Machine A Machine B
Year
Annual Cash
inflow
Dis.
Rate
Cash flow after
discount
Cumulative cash
flow
Cash
flow
After
dis. cumulative
0 600000 600000
1 300000 0.925 277500 272700 80000 74000 72720
2 250000 0.857 214250 491750 85000 72845 146845
3 200000 0.793 158600 650350 150000 118950 265795
4 150000 0.735 110250 760600 200000 147000 412795
5 85000 0.68 57800 818400 250000 170000 582795
6 80000 0.63 50400 868800 300000 189000 771795
Machine A:
= 2 + (600000 – 491750)/158600
= 2 + 108250/158600
= 2 + 0.68
= 2.68days
Machine B:
= 5 + (600000 – 582795)/189000
= 5 + 17205/189000
Paraphrase This Document
Need a fresh take? Get an instant paraphrase of this document with our AI Paraphraser
= 5 + 0.09
= 5.09days
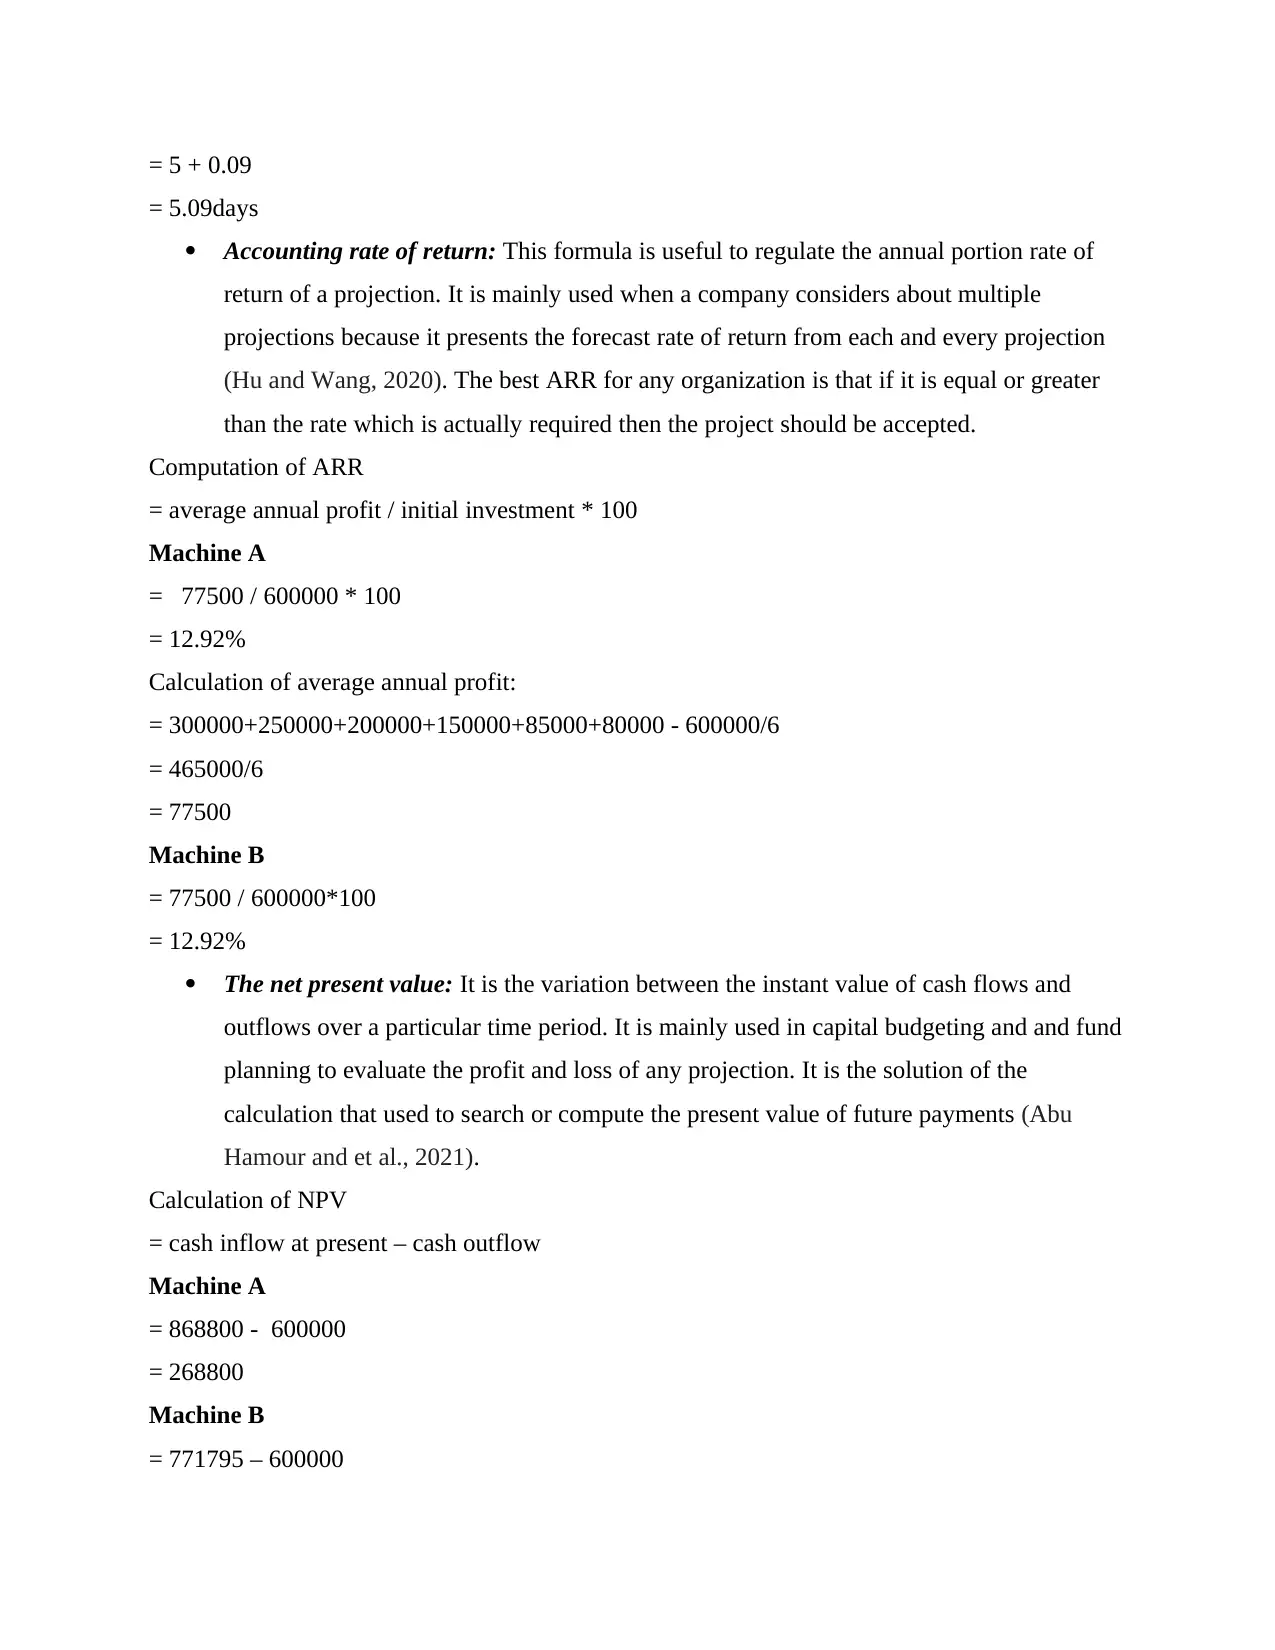
Accounting rate of return: This formula is useful to regulate the annual portion rate of
return of a projection. It is mainly used when a company considers about multiple
projections because it presents the forecast rate of return from each and every projection
(Hu and Wang, 2020). The best ARR for any organization is that if it is equal or greater
than the rate which is actually required then the project should be accepted.
Computation of ARR
= average annual profit / initial investment * 100
Machine A
= 77500 / 600000 * 100
= 12.92%
Calculation of average annual profit:
= 300000+250000+200000+150000+85000+80000 - 600000/6
= 465000/6
= 77500
Machine B
= 77500 / 600000*100
= 12.92%
The net present value: It is the variation between the instant value of cash flows and
outflows over a particular time period. It is mainly used in capital budgeting and and fund
planning to evaluate the profit and loss of any projection. It is the solution of the
calculation that used to search or compute the present value of future payments (Abu
Hamour and et al., 2021).
Calculation of NPV
= cash inflow at present – cash outflow
Machine A
= 868800 - 600000
= 268800
Machine B
= 771795 – 600000
= 5.09days
Accounting rate of return: This formula is useful to regulate the annual portion rate of
return of a projection. It is mainly used when a company considers about multiple
projections because it presents the forecast rate of return from each and every projection
(Hu and Wang, 2020). The best ARR for any organization is that if it is equal or greater
than the rate which is actually required then the project should be accepted.
Computation of ARR
= average annual profit / initial investment * 100
Machine A
= 77500 / 600000 * 100
= 12.92%
Calculation of average annual profit:
= 300000+250000+200000+150000+85000+80000 - 600000/6
= 465000/6
= 77500
Machine B
= 77500 / 600000*100
= 12.92%
The net present value: It is the variation between the instant value of cash flows and
outflows over a particular time period. It is mainly used in capital budgeting and and fund
planning to evaluate the profit and loss of any projection. It is the solution of the
calculation that used to search or compute the present value of future payments (Abu
Hamour and et al., 2021).
Calculation of NPV
= cash inflow at present – cash outflow
Machine A
= 868800 - 600000
= 268800
Machine B
= 771795 – 600000
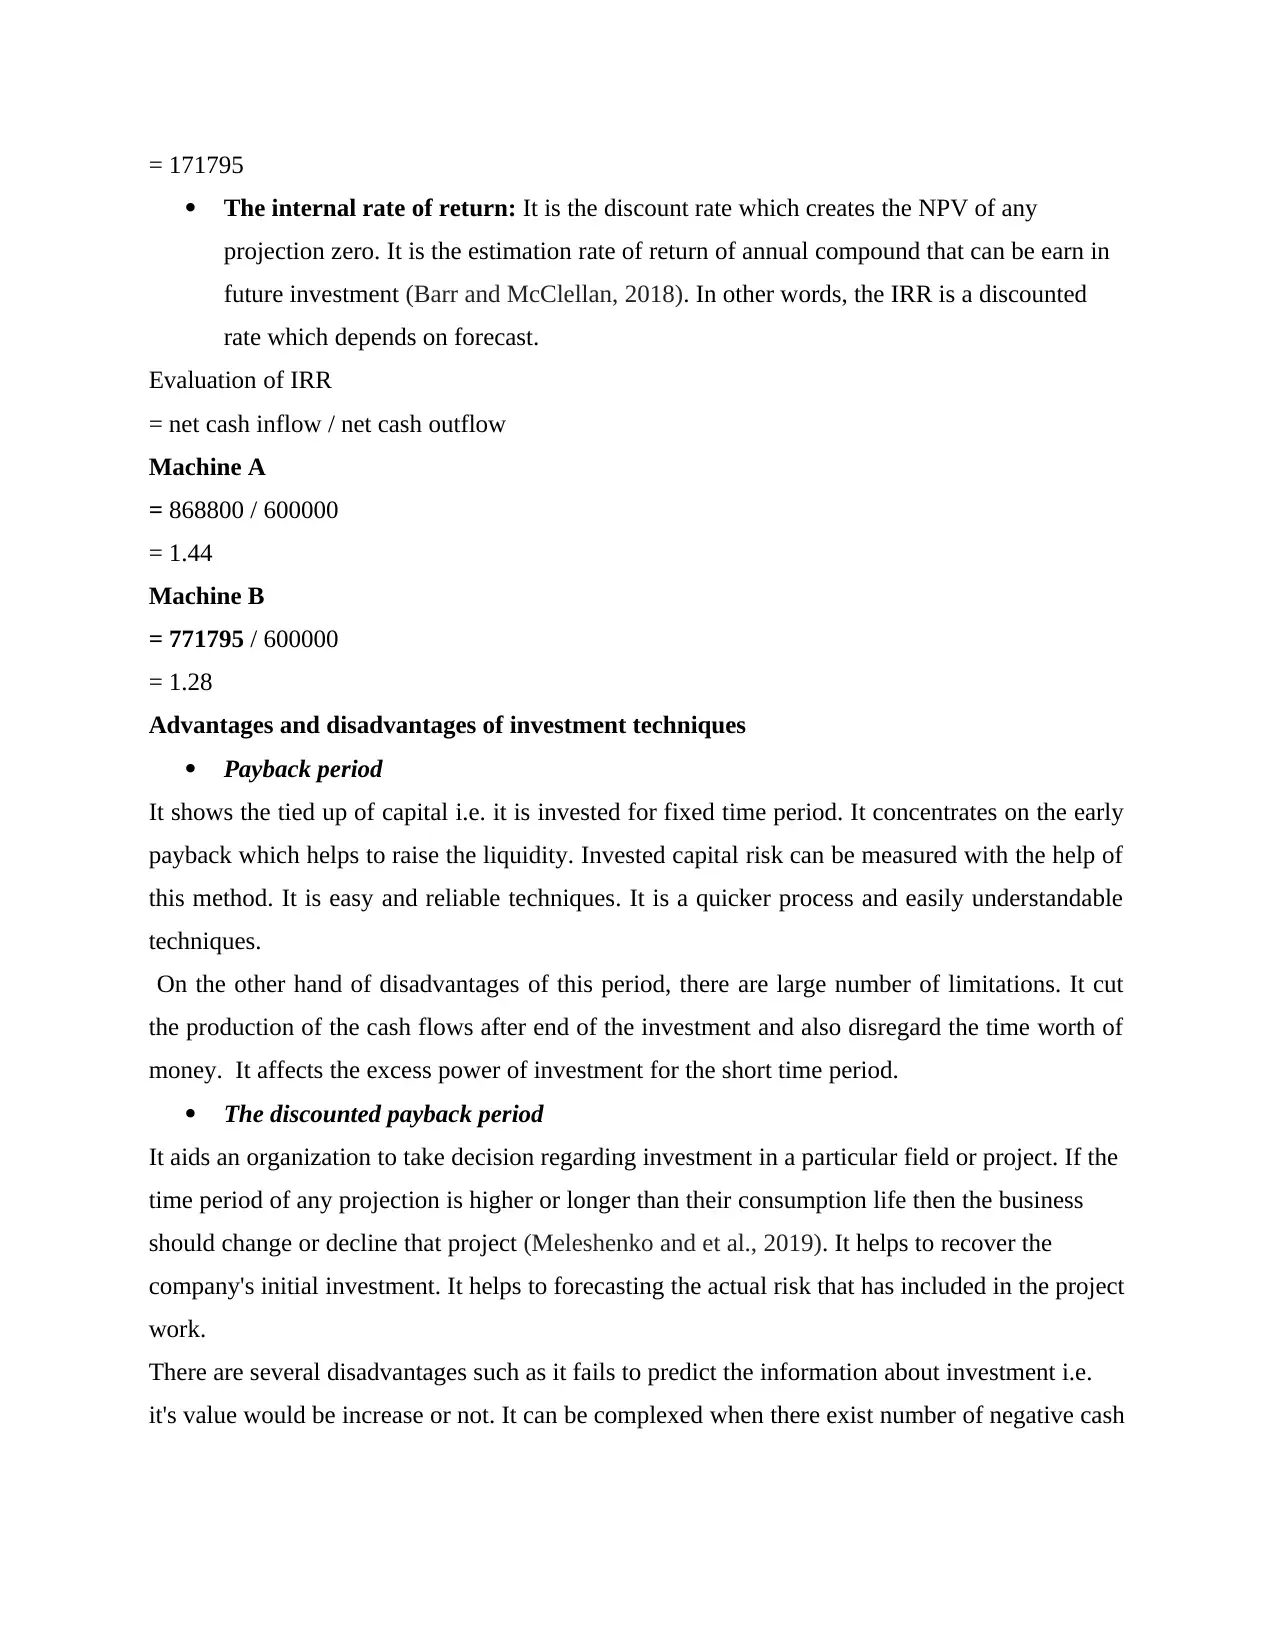
= 171795
The internal rate of return: It is the discount rate which creates the NPV of any
projection zero. It is the estimation rate of return of annual compound that can be earn in
future investment (Barr and McClellan, 2018). In other words, the IRR is a discounted
rate which depends on forecast.
Evaluation of IRR
= net cash inflow / net cash outflow
Machine A
= 868800 / 600000
= 1.44
Machine B
= 771795 / 600000
= 1.28
Advantages and disadvantages of investment techniques
Payback period
It shows the tied up of capital i.e. it is invested for fixed time period. It concentrates on the early
payback which helps to raise the liquidity. Invested capital risk can be measured with the help of
this method. It is easy and reliable techniques. It is a quicker process and easily understandable
techniques.
On the other hand of disadvantages of this period, there are large number of limitations. It cut
the production of the cash flows after end of the investment and also disregard the time worth of
money. It affects the excess power of investment for the short time period.
The discounted payback period
It aids an organization to take decision regarding investment in a particular field or project. If the
time period of any projection is higher or longer than their consumption life then the business
should change or decline that project (Meleshenko and et al., 2019). It helps to recover the
company's initial investment. It helps to forecasting the actual risk that has included in the project
work.
There are several disadvantages such as it fails to predict the information about investment i.e.
it's value would be increase or not. It can be complexed when there exist number of negative cash
⊘ This is a preview!⊘
Do you want full access?
Subscribe today to unlock all pages.
Trusted by 1+ million students worldwide
1 out of 17
Related Documents


Your All-in-One AI-Powered Toolkit for Academic Success.
+13062052269
info@desklib.com
Available 24*7 on WhatsApp / Email
![[object Object]](/_next/static/media/star-bottom.7253800d.svg)
Unlock your academic potential
Copyright © 2020–2026 A2Z Services. All Rights Reserved. Developed and managed by ZUCOL.