Financial Analysis of Kaiser Permanente - HA 520 West Coast Uni
VerifiedAdded on 2023/04/24
|7
|1181
|338
Report
AI Summary
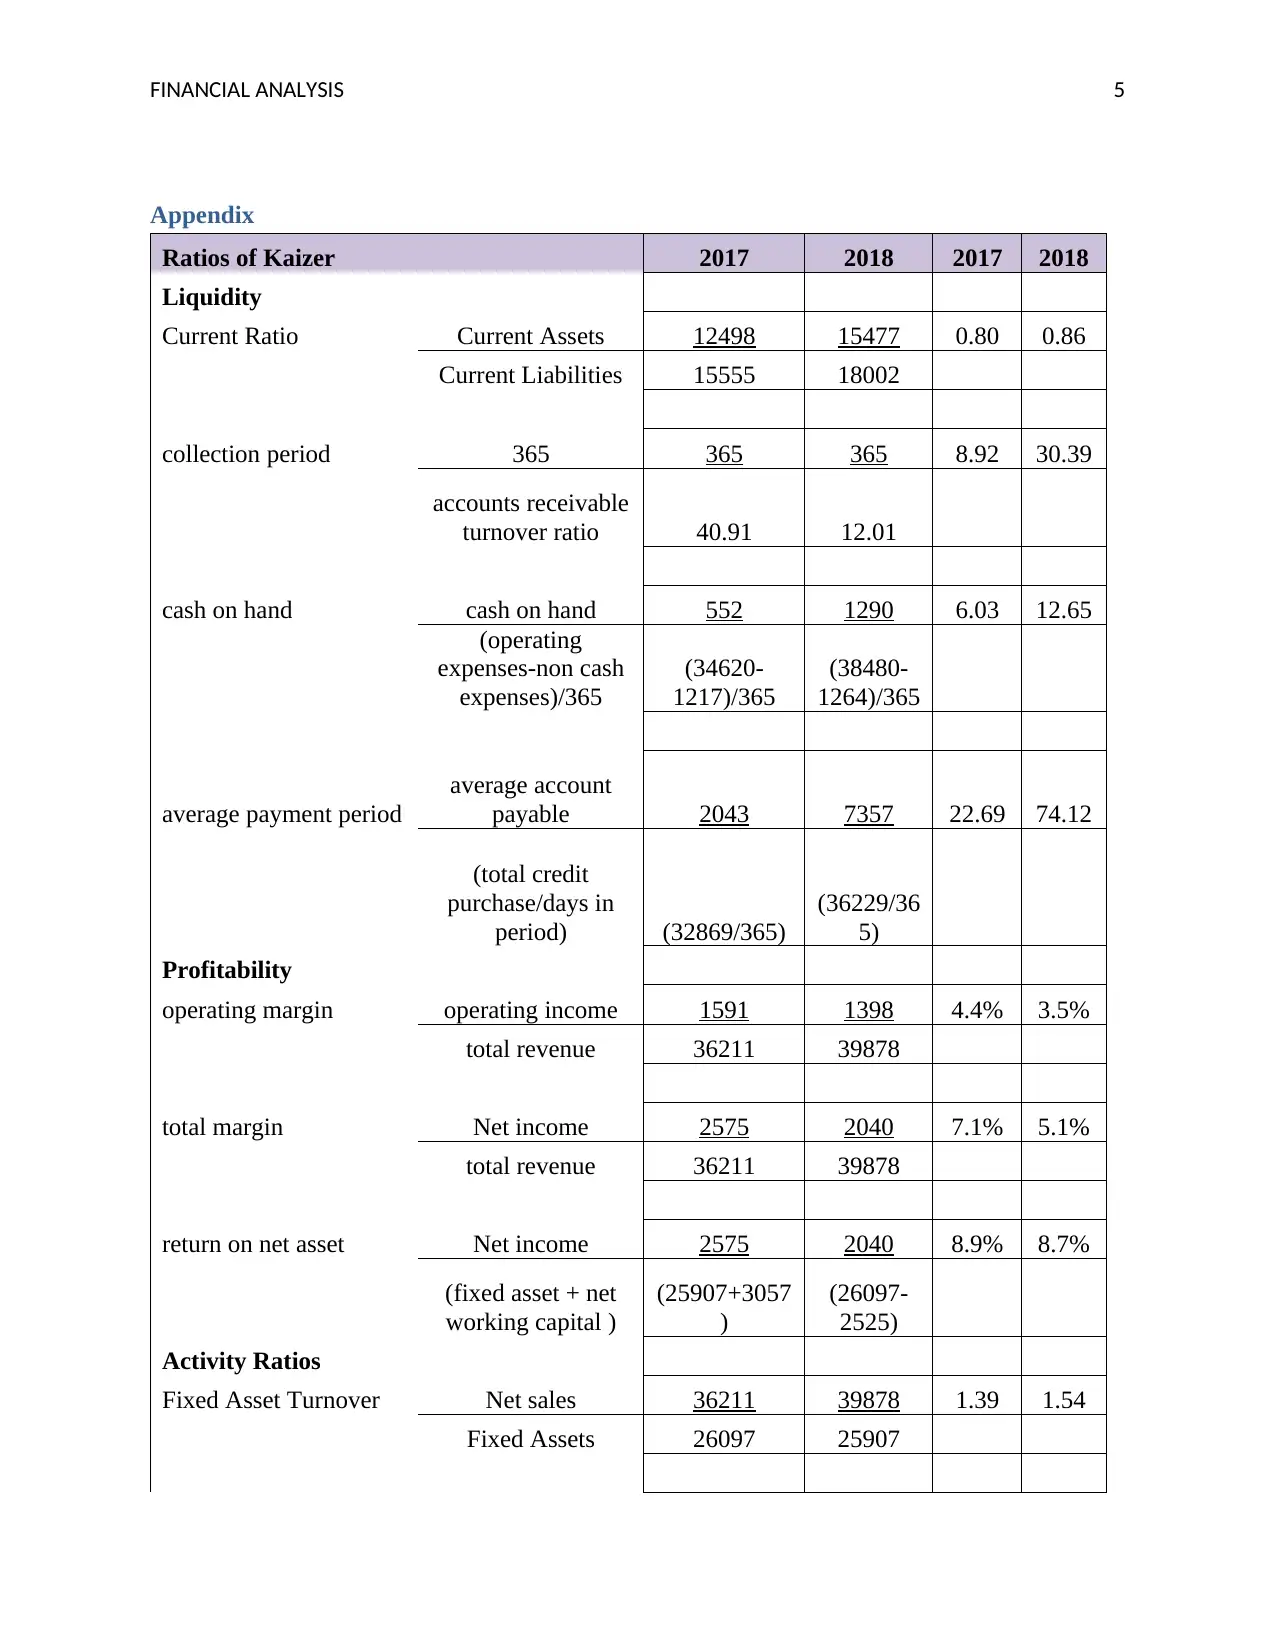
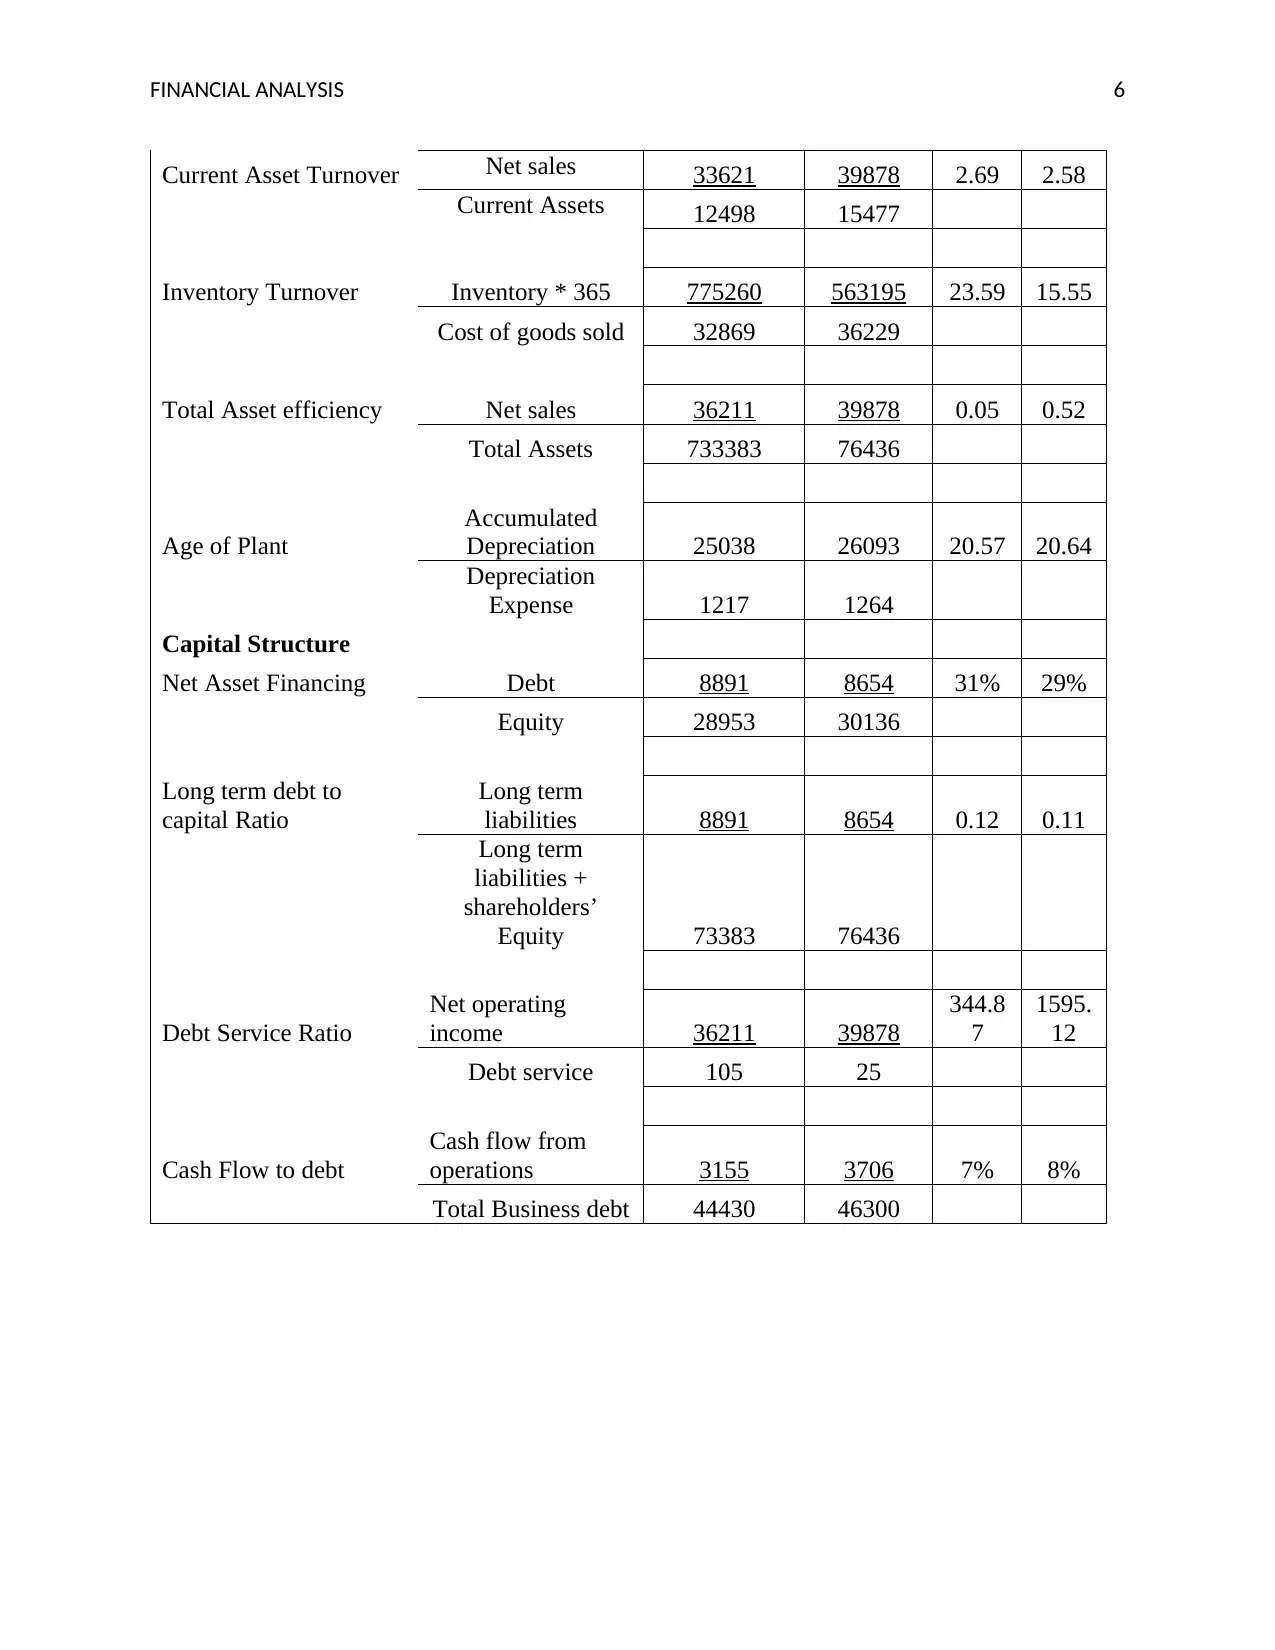
This report presents a financial analysis of Kaiser Permanente, evaluating its liquidity, profitability, activity, and capital structure ratios for the years 2017 and 2018. The analysis includes calculations and interpretations of key metrics such as current ratio, collection period, days cash on hand, operating margin, total margin, and return on net assets. Activity ratios like fixed asset turnover and current asset turnover are examined to assess the company's efficiency in converting assets into sales. The report also delves into capital structure ratios, including net asset financing and long-term debt to capital ratio. Recommendations are provided based on the analysis, focusing on maintaining profitability and improving the collection period. The report concludes that Kaiser Permanente has reduced its debt and increased its payment capacity, making it an attractive investment opportunity. Desklib offers a variety of solved assignments and study resources for students.

Running Head: FINANCIAL ANALYSIS 0
Financial Analysis
Financial Analysis
Paraphrase This Document
Need a fresh take? Get an instant paraphrase of this document with our AI Paraphraser

FINANCIAL ANALYSIS 1
Contents
Liquidity and profitability...........................................................................................................................2
Activity and Capital Structure Ratios..........................................................................................................2
Recommendations.......................................................................................................................................3
References...................................................................................................................................................4
Appendix.....................................................................................................................................................5

FINANCIAL ANALYSIS 2
Liquidity and profitability
The liquidity is the capability to change the current assets in cash. Liquidity of company
is calculated by current ratio, Days cash-on-hand, collection period and average payment period
(Al Nimer, Warrad & Al Omari, 2015). In year 2017, current ratio of company is .80. On the
other hand, in year 2018, current ratio of company is .86. A current ratio that is less than one,
shows that a health care organization is not in good financial health. In year 2017, the collection
period is 8.92 days. On the other hand, in year 2018, collection period is 30.39 days. Other
element of liquidity is Days cash on hand. In year 2017, Days cash on hand is 6.03 days.
Conversely, in year 2018, Days cash on hand 12.65 days. In 2017, average payment period is
74.12 days. On other hand, in 2018, it is 22.69 days.
Further, by assessing profitability of company, the financial performance of company can
be evaluated. The profitability can be measured by operating margin, total margin and return on
net asset (Borio, Gambacorta & Hofmann, 2017). In year 2018, operating margin of company is
4% as same as in year 2017. In year 2017, total margin of company is 5.12%. On the other hand,
in 2018, total margin is 7%. Furthermore, in 2017, return on net asset is 8%. Conversely, in
2018, return on asset is 9%.
Activity and Capital Structure Ratios
Activity ratios are calculated to understand the ability of the company on how well the
company can convert the cash into the sales. The fixed asset turnover ratio was 1.39 in the year
2017 and the ratio increased to 1.54 in the year 2018, thereby presenting how well the fixed
assets are utilized to generate the income. The current ratio of the company is 2.69 for the year
⊘ This is a preview!⊘
Do you want full access?
Subscribe today to unlock all pages.

Trusted by 1+ million students worldwide

FINANCIAL ANALYSIS 3
2017 and that fell down to 2.58 in the year 2018. The current ratio depicts the ability of the
company to pay back the current liabilities easily. The company is performing well in the activity
ratios however the capital structure includes the net financing of assets at 31% and 29% for the
respective years (Uechi, et al 2015). The age of plant is 20.7 years in 2017 and 20.64 years in
2018 and the plant is going to work till 20 years approximately.
The long term liabilities to capital ratio decreased from 0.12 to 0.11 reflecting the
payment of the debts. The debt service ratio of the company reflects the ability to produce cash
to cover the interest expenses. The ratio presents 344.87 times ability in previous year followed
by 1595.12 thereby indicating the positive impact and enhanced ability of the company. The cash
flow to debt ratio however determines the time taken by the company to pay all the debts and in
terms of percentage the company is able to pay 8% debts as compared to the previous year which
was 7% (Chadha & Sharma, 2015).
Recommendations
From the above analysis it can be concluded that debt has been reduced, the payment
capacity has increased and the cash is also converting at the greater speed and hence the
company is opportunist from the point of view of investors. As per evaluation of profitability of
company, operating margin, total margin and return on asset is increasing in year 2018. It means
that company is doing well and should maintain the same in upcoming periods. As per the
evaluation of liquidity, it is found that there are mixed results. The collection period of company
is not sound and shall be improved by reducing the debtors on credit.
Paraphrase This Document
Need a fresh take? Get an instant paraphrase of this document with our AI Paraphraser

FINANCIAL ANALYSIS 4
References
Al Nimer, M., Warrad, L., & Al Omari, R. (2015). The impact of liquidity on Jordanian banks
profitability through return on assets. European Journal of Business and
Management, 7(7), 229-232.
Borio, C., Gambacorta, L., & Hofmann, B. (2017). The influence of monetary policy on bank
profitability. International Finance, 20(1), 48-63.
Chadha, S., & Sharma, A. K. (2015). Capital structure and firm performance: Empirical evidence
from India. Vision, 19(4), 295-302.
Uechi, L., Akutsu, T., Stanley, H. E., Marcus, A. J., & Kenett, D. Y. (2015). Sector dominance
ratio analysis of financial markets. Physica A: Statistical Mechanics and its
Applications, 421, 488-509.

FINANCIAL ANALYSIS 5
Appendix
Ratios of Kaizer 2017 2018 2017 2018
Liquidity
Current Ratio Current Assets 12498 15477 0.80 0.86
Current Liabilities 15555 18002
collection period 365 365 365 8.92 30.39
accounts receivable
turnover ratio 40.91 12.01
cash on hand cash on hand 552 1290 6.03 12.65
(operating
expenses-non cash
expenses)/365
(34620-
1217)/365
(38480-
1264)/365
average payment period
average account
payable 2043 7357 22.69 74.12
(total credit
purchase/days in
period) (32869/365)
(36229/36
5)
Profitability
operating margin operating income 1591 1398 4.4% 3.5%
total revenue 36211 39878
total margin Net income 2575 2040 7.1% 5.1%
total revenue 36211 39878
return on net asset Net income 2575 2040 8.9% 8.7%
(fixed asset + net
working capital )
(25907+3057
)
(26097-
2525)
Activity Ratios
Fixed Asset Turnover Net sales 36211 39878 1.39 1.54
Fixed Assets 26097 25907
⊘ This is a preview!⊘
Do you want full access?
Subscribe today to unlock all pages.

Trusted by 1+ million students worldwide

FINANCIAL ANALYSIS 6
Current Asset Turnover Net sales 33621 39878 2.69 2.58
Current Assets 12498 15477
Inventory Turnover Inventory * 365 775260 563195 23.59 15.55
Cost of goods sold 32869 36229
Total Asset efficiency Net sales 36211 39878 0.05 0.52
Total Assets 733383 76436
Age of Plant
Accumulated
Depreciation 25038 26093 20.57 20.64
Depreciation
Expense 1217 1264
Capital Structure
Net Asset Financing Debt 8891 8654 31% 29%
Equity 28953 30136
Long term debt to
capital Ratio
Long term
liabilities 8891 8654 0.12 0.11
Long term
liabilities +
shareholders’
Equity 73383 76436
Debt Service Ratio
Net operating
income 36211 39878
344.8
7
1595.
12
Debt service 105 25
Cash Flow to debt
Cash flow from
operations 3155 3706 7% 8%
Total Business debt 44430 46300
1 out of 7
Related Documents

Your All-in-One AI-Powered Toolkit for Academic Success.
+13062052269
info@desklib.com
Available 24*7 on WhatsApp / Email
Unlock your academic potential
Copyright © 2020–2025 A2Z Services. All Rights Reserved. Developed and managed by ZUCOL.