MPA702 Financial Interpretation: Kathmandu Holding Ratio Analysis
VerifiedAdded on 2023/06/08
|19
|3994
|239
Report
AI Summary
This report provides a comprehensive financial analysis of Kathmandu Holding Limited over the past five years using ratio analysis. It assesses the company's liquidity, profitability, operating efficiency, and solvency positions. The liquidity analysis reveals a strong position until 2015, followed by a decline. Profitability, measured by ROE, ROA, and net profit margin, decreased from 2013 to 2015 but showed improvement in subsequent years. Operating efficiency, evaluated through inventory, receivables, and payables turnover, indicates efficient inventory management but challenges in collecting receivables and managing payables. Solvency analysis suggests a healthy capital structure with low financial risk. The report concludes that while Kathmandu faces some challenges, its overall financial health is stable, with recent improvements in key areas. Desklib offers similar solved assignments for students.
Running ead athmandu olding imitedH : K H L
RATIO ANALYSIS
RATIO ANALYSIS
Paraphrase This Document
Need a fresh take? Get an instant paraphrase of this document with our AI Paraphraser
athmandu olding imitedK H L 1
Introduction:
Kathmandu holding Limited is a company that is listed on New Zealand Stock Exchange
however it operates its business from three major segments: New Zealand, Australia and
United Kingdoms. The company was established in the year 1987 and is located in
Christchurch, New Zealand. The business in which Kathmandu group is engaged is of
designing, marketing as well as retailing the wide range of clothing and equipment that are
required for the tour and travel purpose. The product range of the company covers variety of
apparels such as waterproof jackets, fleece jackets, thermals, merino thermals and jackets. It
also manufactures shoes and shocks for the travelling purposes. The travelling and touring
equipment includes bag-backs, sleeping bags, tents and various other travelling accessories
that are used for camping and trekking. In all Kathmandu Group has around, 160 stores out of
which 110 stores are located in Australia, over 46 stores are located in New Zealand and
around 4 stores are operated in United Kingdom. The subsidiaries of the company are
Milford Group Holdings Limited, Kathmandu Limited, Kathmandu Pty Limited and
Kathmandu (U.K.) Limited.
The purpose of this report is to carry out the evaluation of financial performance of
Kathmandu Holding Limited in last 5 years. To evaluate the company’s performance, the use
of Ratio analysis technique is made which is the key technique of financial management. As a
part of ratio analysis, various ratios in regards to various important components of the
financial statements of the company has been taken into account and their impact on the
overall financial position and performance of the business of Kathmandu Ltd. has been
analysed.
Application of Ratio Analysis
athmandu olding imitedK H L 2
In order to identify the overall financial health of the business, ratio analysis has been carried
in four major aspects of financial position i.e. the liquidity position, profitability position,
operating efficiency position and solvency position of the business. The use of different sorts
of ratio will allow the managers of the company to pay more attention to the areas where the
financial ratios are indicating irregularity or any sort of risk on the company (Gibson, 2011).
All the financial results of preceding 5 financial years have been represented through graphs
to allow the managers or users of this information, to understand each result in the convenient
and clear manner. Along with the analysis of results of each individual year, a comparative
study has been made to understand the changes in the financial performance of the business
so that any required changes or recommendations for the subsequent periods could be made
for the purpose of achieving better results (Godwin and Alderman, 2012).
Liquidity Position:
First of all, liquidity position of the business has been analysed using the two key liquidity
ratios i.e. the current ratio and the liquid ratio. Generally, in regards of current ratio, a ratio of
2:1 is considered as ideal. In the present case of Kathmandu Holdings, it has been identified
that the current ratio of the company in 2013, 2014 and 2015 was satisfactory as it has
already achieved the ideal standards in these standards (Kathmandu, 2014). Therefore, it can
be said that the company had sufficient amount of current assets to meet the short term
liabilities that were supposed to be due in next 12 months from the date on which such
liabilities were entered into. The results of current ratio of shows that the company had sound
liquidity position till the end of 2015. After, 2015, both the current and quick ratios of the
company started declining and the declining liquidity ratios of the company clearly indicates
that the liquidity position of the company has worsened in last two reporting years. The
declining liquidity position of the business is faced when the company is not able to
efficiently manage and utilise its current assets to pay off its current liabilities. Thus to meet
⊘ This is a preview!⊘
Do you want full access?
Subscribe today to unlock all pages.
Trusted by 1+ million students worldwide
athmandu olding imitedK H L 3
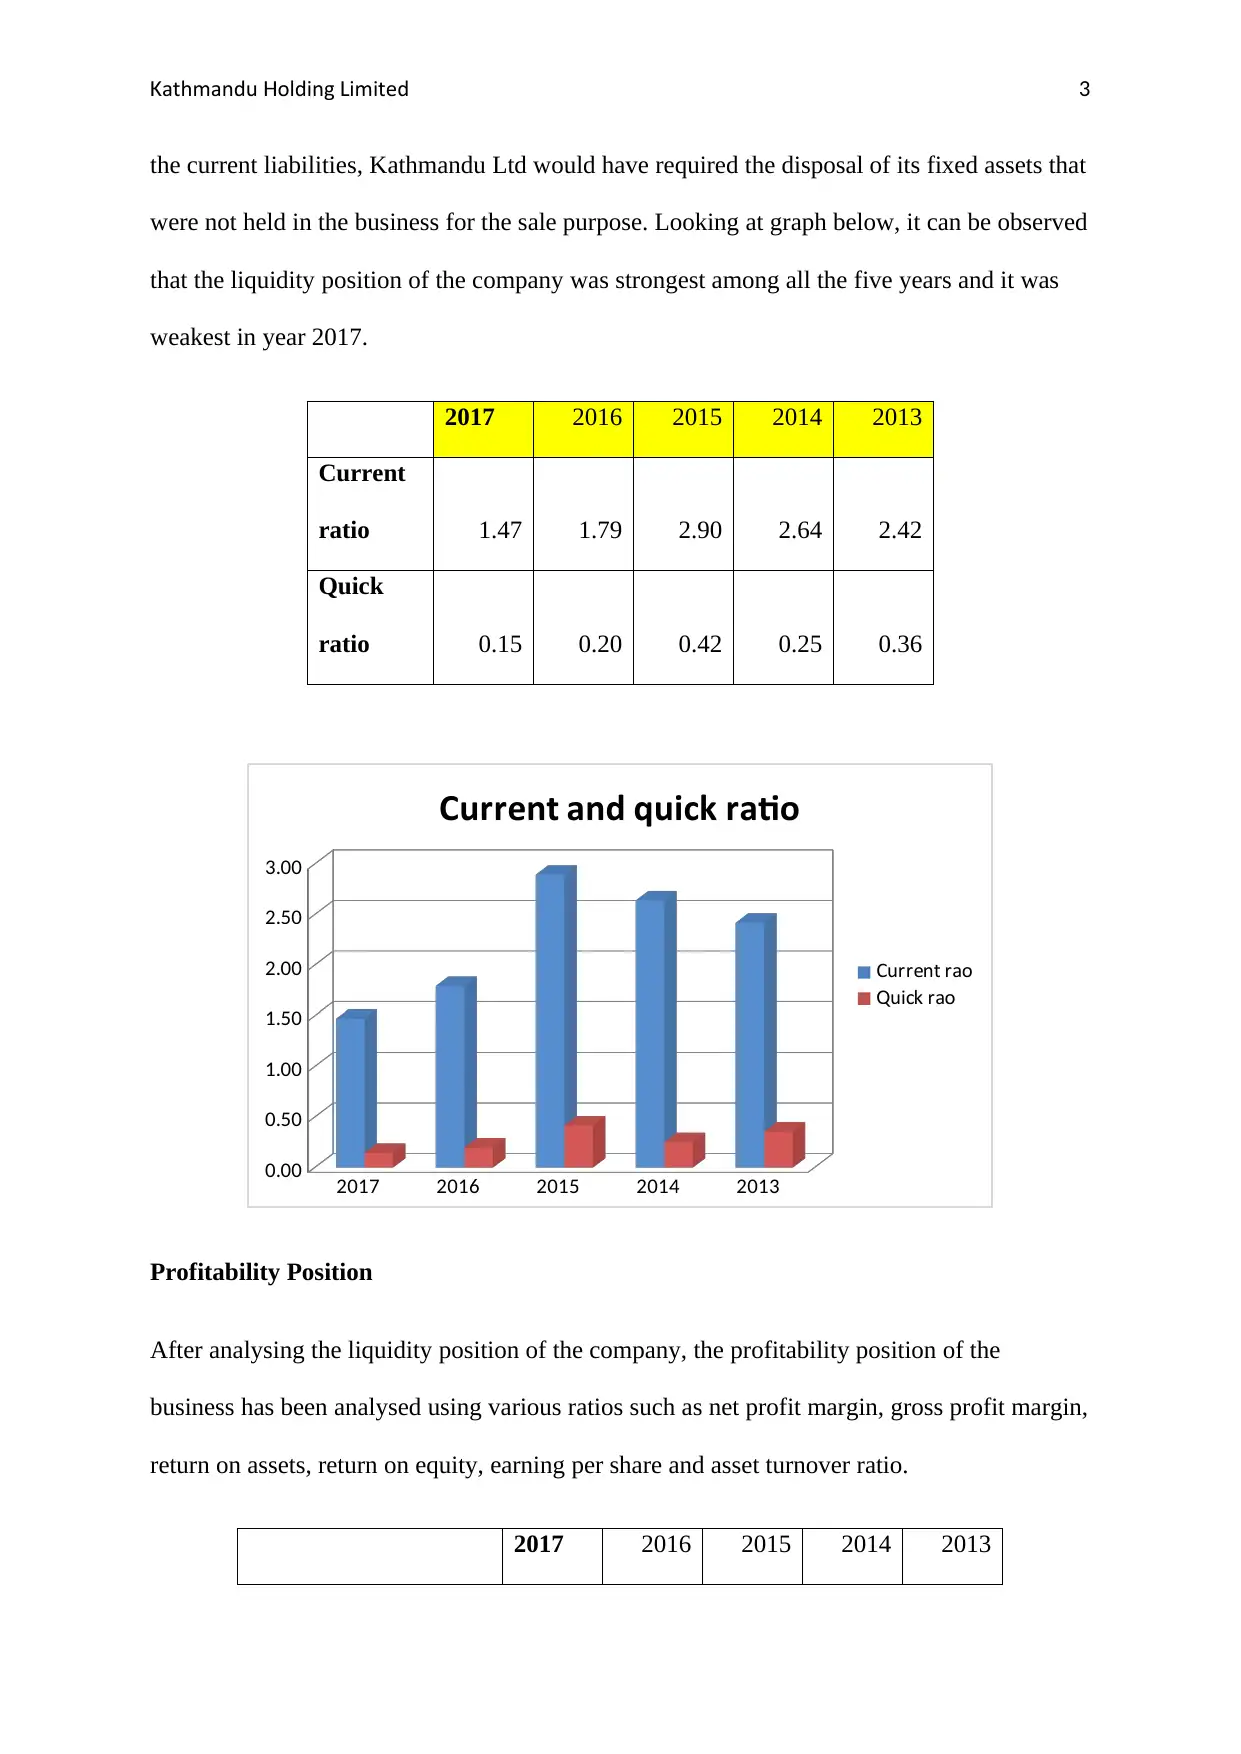
the current liabilities, Kathmandu Ltd would have required the disposal of its fixed assets that
were not held in the business for the sale purpose. Looking at graph below, it can be observed
that the liquidity position of the company was strongest among all the five years and it was
weakest in year 2017.
2017 2016 2015 2014 2013
Current
ratio 1.47 1.79 2.90 2.64 2.42
Quick
ratio 0.15 0.20 0.42 0.25 0.36
2017 2016 2015 2014 2013
0.00
0.50
1.00
1.50
2.00
2.50
3.00
Current and quick ratio
Current ratio
uick ratioQ
Profitability Position
After analysing the liquidity position of the company, the profitability position of the
business has been analysed using various ratios such as net profit margin, gross profit margin,
return on assets, return on equity, earning per share and asset turnover ratio.
2017 2016 2015 2014 2013
Paraphrase This Document
Need a fresh take? Get an instant paraphrase of this document with our AI Paraphraser
athmandu olding imitedK H L 4
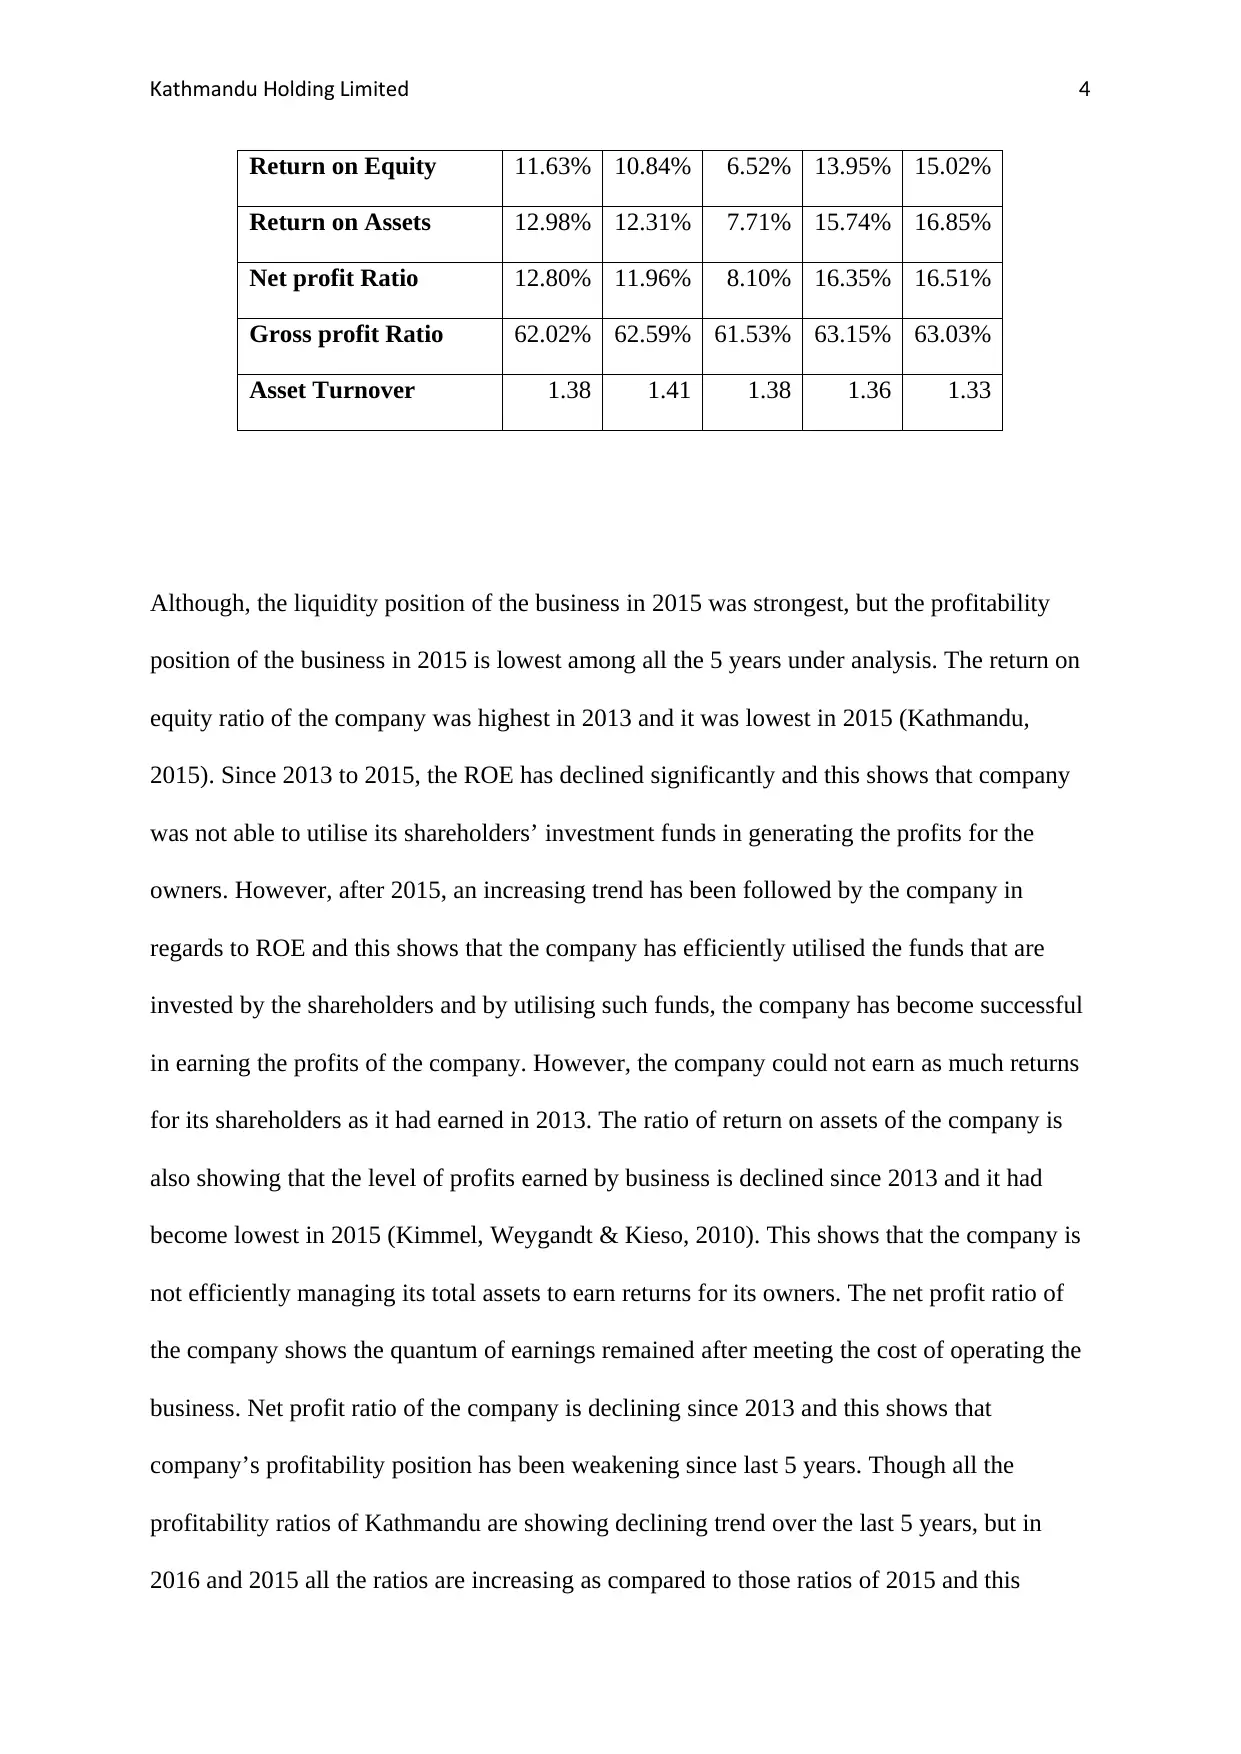
Return on Equity 11.63% 10.84% 6.52% 13.95% 15.02%
Return on Assets 12.98% 12.31% 7.71% 15.74% 16.85%
Net profit Ratio 12.80% 11.96% 8.10% 16.35% 16.51%
Gross profit Ratio 62.02% 62.59% 61.53% 63.15% 63.03%
Asset Turnover 1.38 1.41 1.38 1.36 1.33
Although, the liquidity position of the business in 2015 was strongest, but the profitability
position of the business in 2015 is lowest among all the 5 years under analysis. The return on
equity ratio of the company was highest in 2013 and it was lowest in 2015 (Kathmandu,
2015). Since 2013 to 2015, the ROE has declined significantly and this shows that company
was not able to utilise its shareholders’ investment funds in generating the profits for the
owners. However, after 2015, an increasing trend has been followed by the company in
regards to ROE and this shows that the company has efficiently utilised the funds that are
invested by the shareholders and by utilising such funds, the company has become successful
in earning the profits of the company. However, the company could not earn as much returns
for its shareholders as it had earned in 2013. The ratio of return on assets of the company is
also showing that the level of profits earned by business is declined since 2013 and it had
become lowest in 2015 (Kimmel, Weygandt & Kieso, 2010). This shows that the company is
not efficiently managing its total assets to earn returns for its owners. The net profit ratio of
the company shows the quantum of earnings remained after meeting the cost of operating the
business. Net profit ratio of the company is declining since 2013 and this shows that
company’s profitability position has been weakening since last 5 years. Though all the
profitability ratios of Kathmandu are showing declining trend over the last 5 years, but in
2016 and 2015 all the ratios are increasing as compared to those ratios of 2015 and this
athmandu olding imitedK H L 5
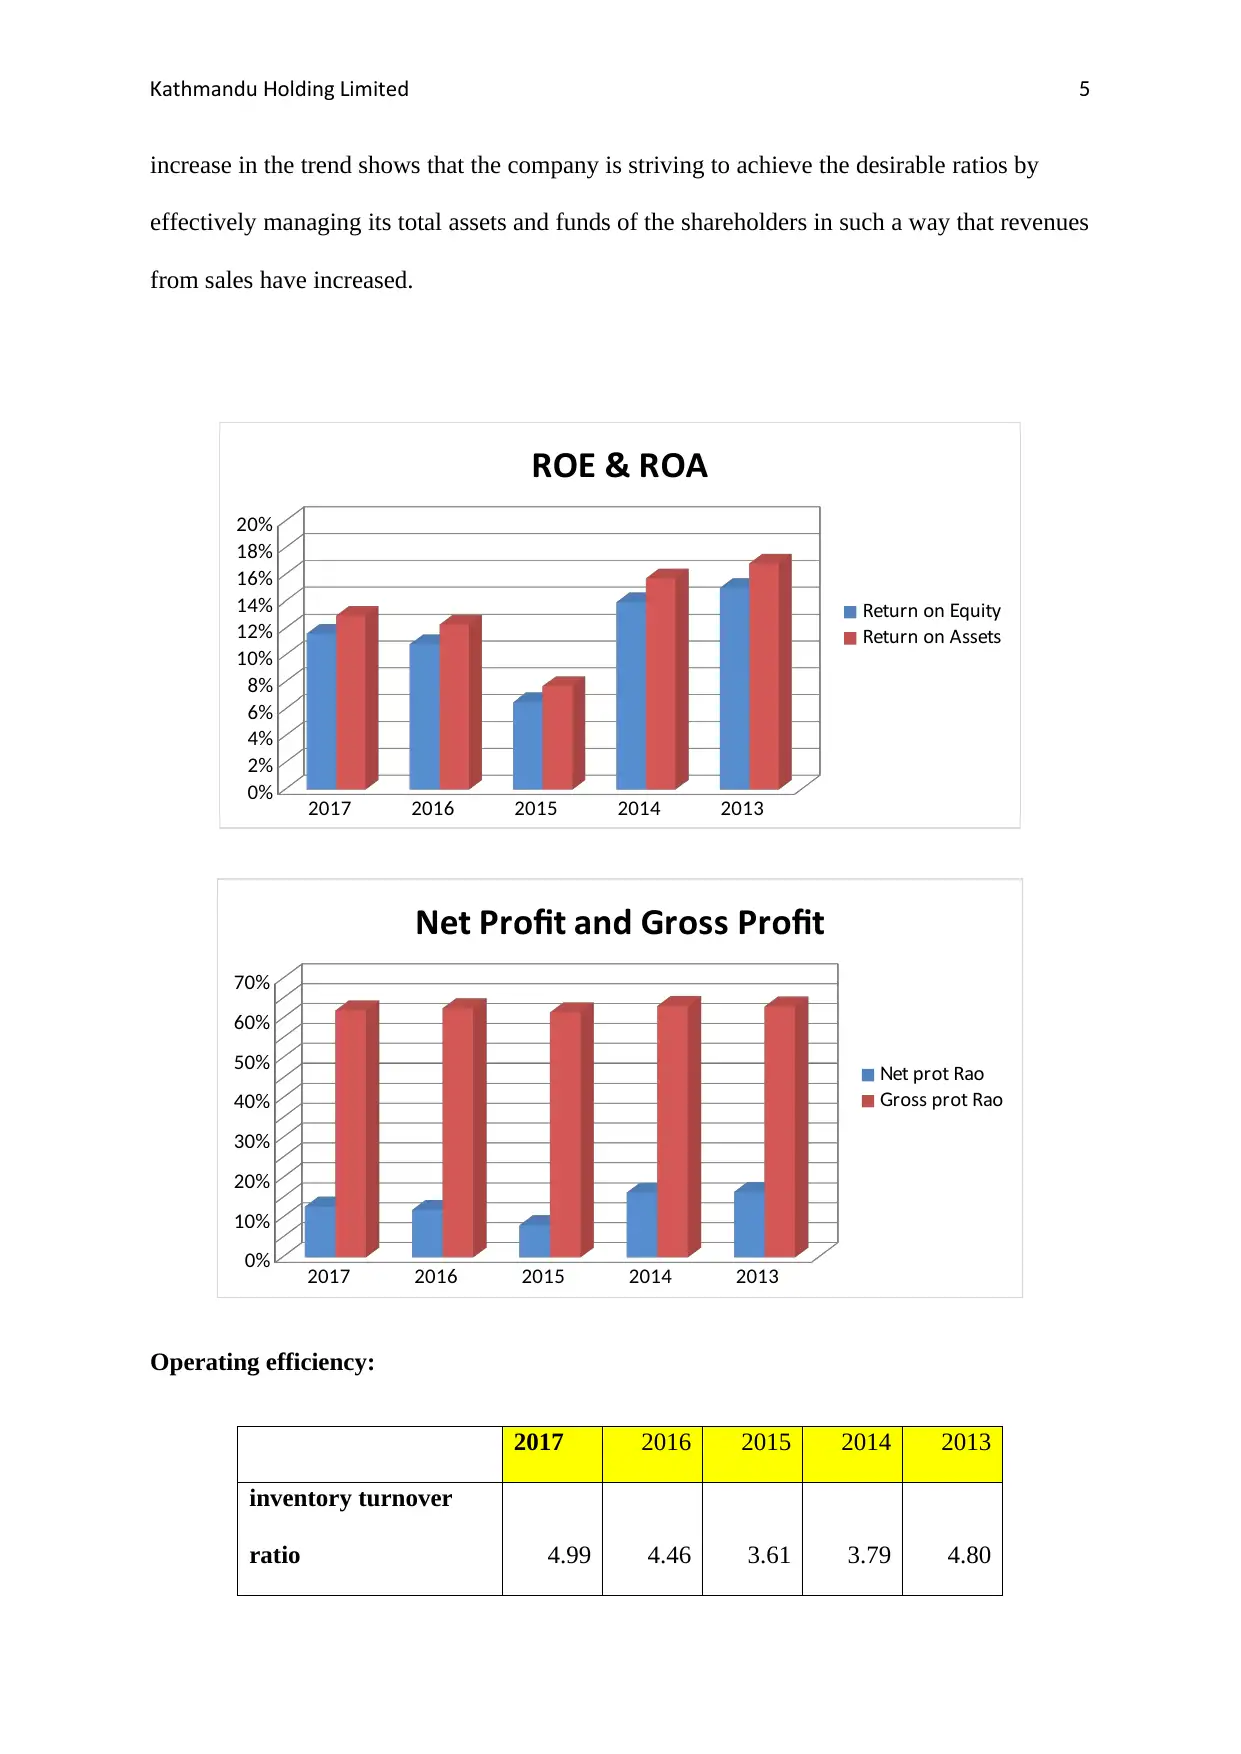
increase in the trend shows that the company is striving to achieve the desirable ratios by
effectively managing its total assets and funds of the shareholders in such a way that revenues
from sales have increased.
2017 2016 2015 2014 2013
0%
2%
4%
6%
8%
10%
12%
14%
16%
18%
20%
ROE & ROA
Return on quityE
Return on Assets
2017 2016 2015 2014 2013
0%
10%
20%
30%
40%
50%
60%
70%
Net Profit and Gross Profit
et profit RatioN
ross profit RatioG
Operating efficiency:
2017 2016 2015 2014 2013
inventory turnover
ratio 4.99 4.46 3.61 3.79 4.80
⊘ This is a preview!⊘
Do you want full access?
Subscribe today to unlock all pages.
Trusted by 1+ million students worldwide
athmandu olding imitedK H L 6
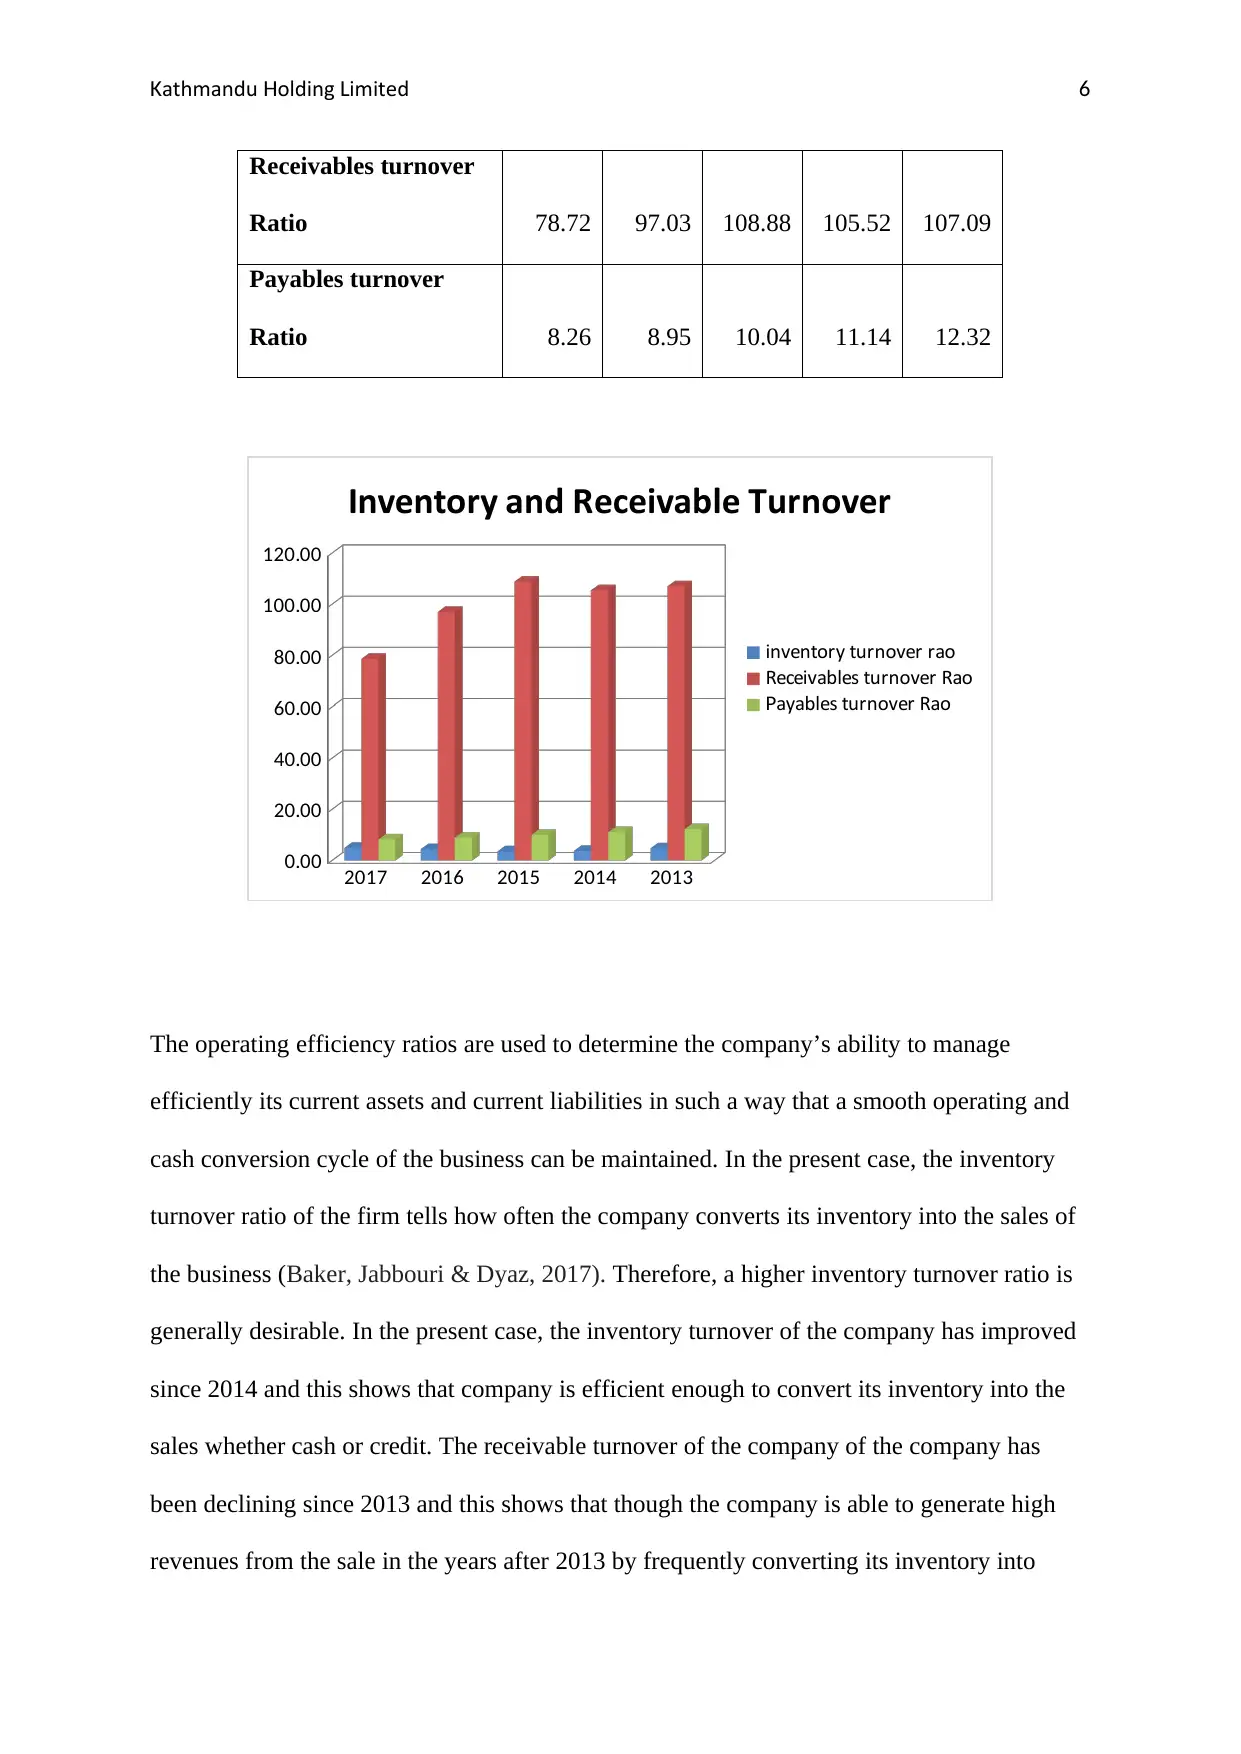
Receivables turnover
Ratio 78.72 97.03 108.88 105.52 107.09
Payables turnover
Ratio 8.26 8.95 10.04 11.14 12.32
2017 2016 2015 2014 2013
0.00
20.00
40.00
60.00
80.00
100.00
120.00
Inventory and Receivable Turnover
inventory turnover ratio
Receivables turnover Ratio
ayables turnover RatioP
The operating efficiency ratios are used to determine the company’s ability to manage
efficiently its current assets and current liabilities in such a way that a smooth operating and
cash conversion cycle of the business can be maintained. In the present case, the inventory
turnover ratio of the firm tells how often the company converts its inventory into the sales of
the business (Baker, Jabbouri & Dyaz, 2017). Therefore, a higher inventory turnover ratio is
generally desirable. In the present case, the inventory turnover of the company has improved
since 2014 and this shows that company is efficient enough to convert its inventory into the
sales whether cash or credit. The receivable turnover of the company of the company has
been declining since 2013 and this shows that though the company is able to generate high
revenues from the sale in the years after 2013 by frequently converting its inventory into
Paraphrase This Document
Need a fresh take? Get an instant paraphrase of this document with our AI Paraphraser
athmandu olding imitedK H L 7
sales but is it not able to collect sufficient cash from the sales made in the particular year
because of its lose trade credit policies. The declining receivable turnover ratio of the
company is a clear indicator of company’s inefficiency towards collecting the amount
receivables for the credit sales made in the year because company is not making required
efforts to convert its credit sales into cash. Due to this, the operating cash cycle of the
company is not maintained effectively and efficiently and leading to weak working capital
management of the company (Kathmandu, 2016). The payable turnover ratio of the company
gauges the speed with which a firm pays offs the amount that is due to its accounts payables
i.e. the suppliers and creditors of the business. In the present case, the accounts payable ratio
is continuously declining since 2013 till 2017 and this shows that the company is not paying
off its trade creditors on timely basis, all the amount due to them for the credit purchases
made from them (Kathmandu, 2017). The declining accounts payable ratio is an indication of
weakening financial position of the business. One of the major reason due to which the
company is unable to meet its trade credit obligations is the unavailability of sufficient
amount of funds with the company as a result of excessive blockage of funds in the trade
credits allowed to the customers of the business.
Solvency position (Gearing Ratios)
2017 2016 2015 2014 2013
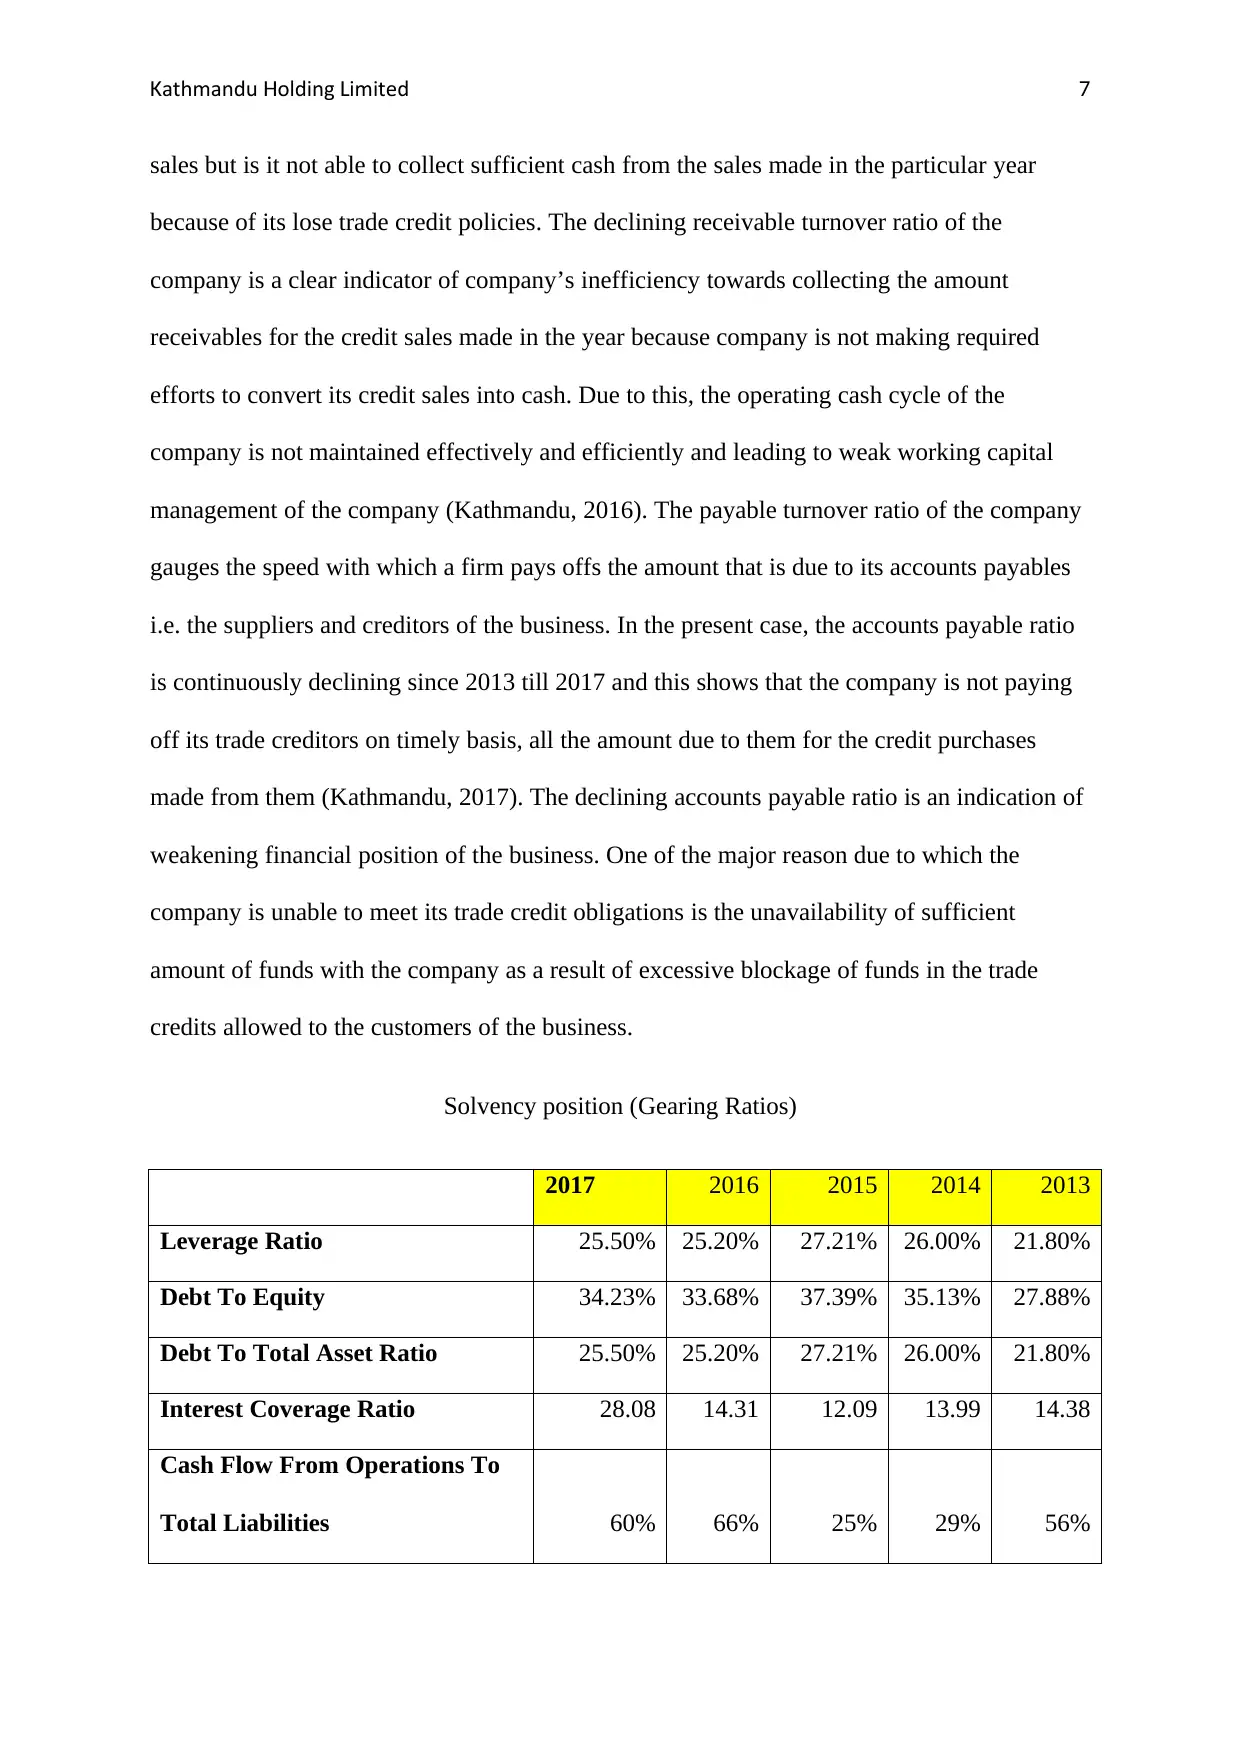
Leverage Ratio 25.50% 25.20% 27.21% 26.00% 21.80%
Debt To Equity 34.23% 33.68% 37.39% 35.13% 27.88%
Debt To Total Asset Ratio 25.50% 25.20% 27.21% 26.00% 21.80%
Interest Coverage Ratio 28.08 14.31 12.09 13.99 14.38
Cash Flow From Operations To
Total Liabilities 60% 66% 25% 29% 56%
sales but is it not able to collect sufficient cash from the sales made in the particular year
because of its lose trade credit policies. The declining receivable turnover ratio of the
company is a clear indicator of company’s inefficiency towards collecting the amount
receivables for the credit sales made in the year because company is not making required
efforts to convert its credit sales into cash. Due to this, the operating cash cycle of the
company is not maintained effectively and efficiently and leading to weak working capital
management of the company (Kathmandu, 2016). The payable turnover ratio of the company
gauges the speed with which a firm pays offs the amount that is due to its accounts payables
i.e. the suppliers and creditors of the business. In the present case, the accounts payable ratio
is continuously declining since 2013 till 2017 and this shows that the company is not paying
off its trade creditors on timely basis, all the amount due to them for the credit purchases
made from them (Kathmandu, 2017). The declining accounts payable ratio is an indication of
weakening financial position of the business. One of the major reason due to which the
company is unable to meet its trade credit obligations is the unavailability of sufficient
amount of funds with the company as a result of excessive blockage of funds in the trade
credits allowed to the customers of the business.
Solvency position (Gearing Ratios)
2017 2016 2015 2014 2013
Leverage Ratio 25.50% 25.20% 27.21% 26.00% 21.80%
Debt To Equity 34.23% 33.68% 37.39% 35.13% 27.88%
Debt To Total Asset Ratio 25.50% 25.20% 27.21% 26.00% 21.80%
Interest Coverage Ratio 28.08 14.31 12.09 13.99 14.38
Cash Flow From Operations To
Total Liabilities 60% 66% 25% 29% 56%
athmandu olding imitedK H L 8
2017 2016 2015 2014 2013
0.00
0.05
0.10
0.15
0.20
0.25
0.30
0.35
0.40
0.45
0.50
Debt to quityE
debt to total asset ratio
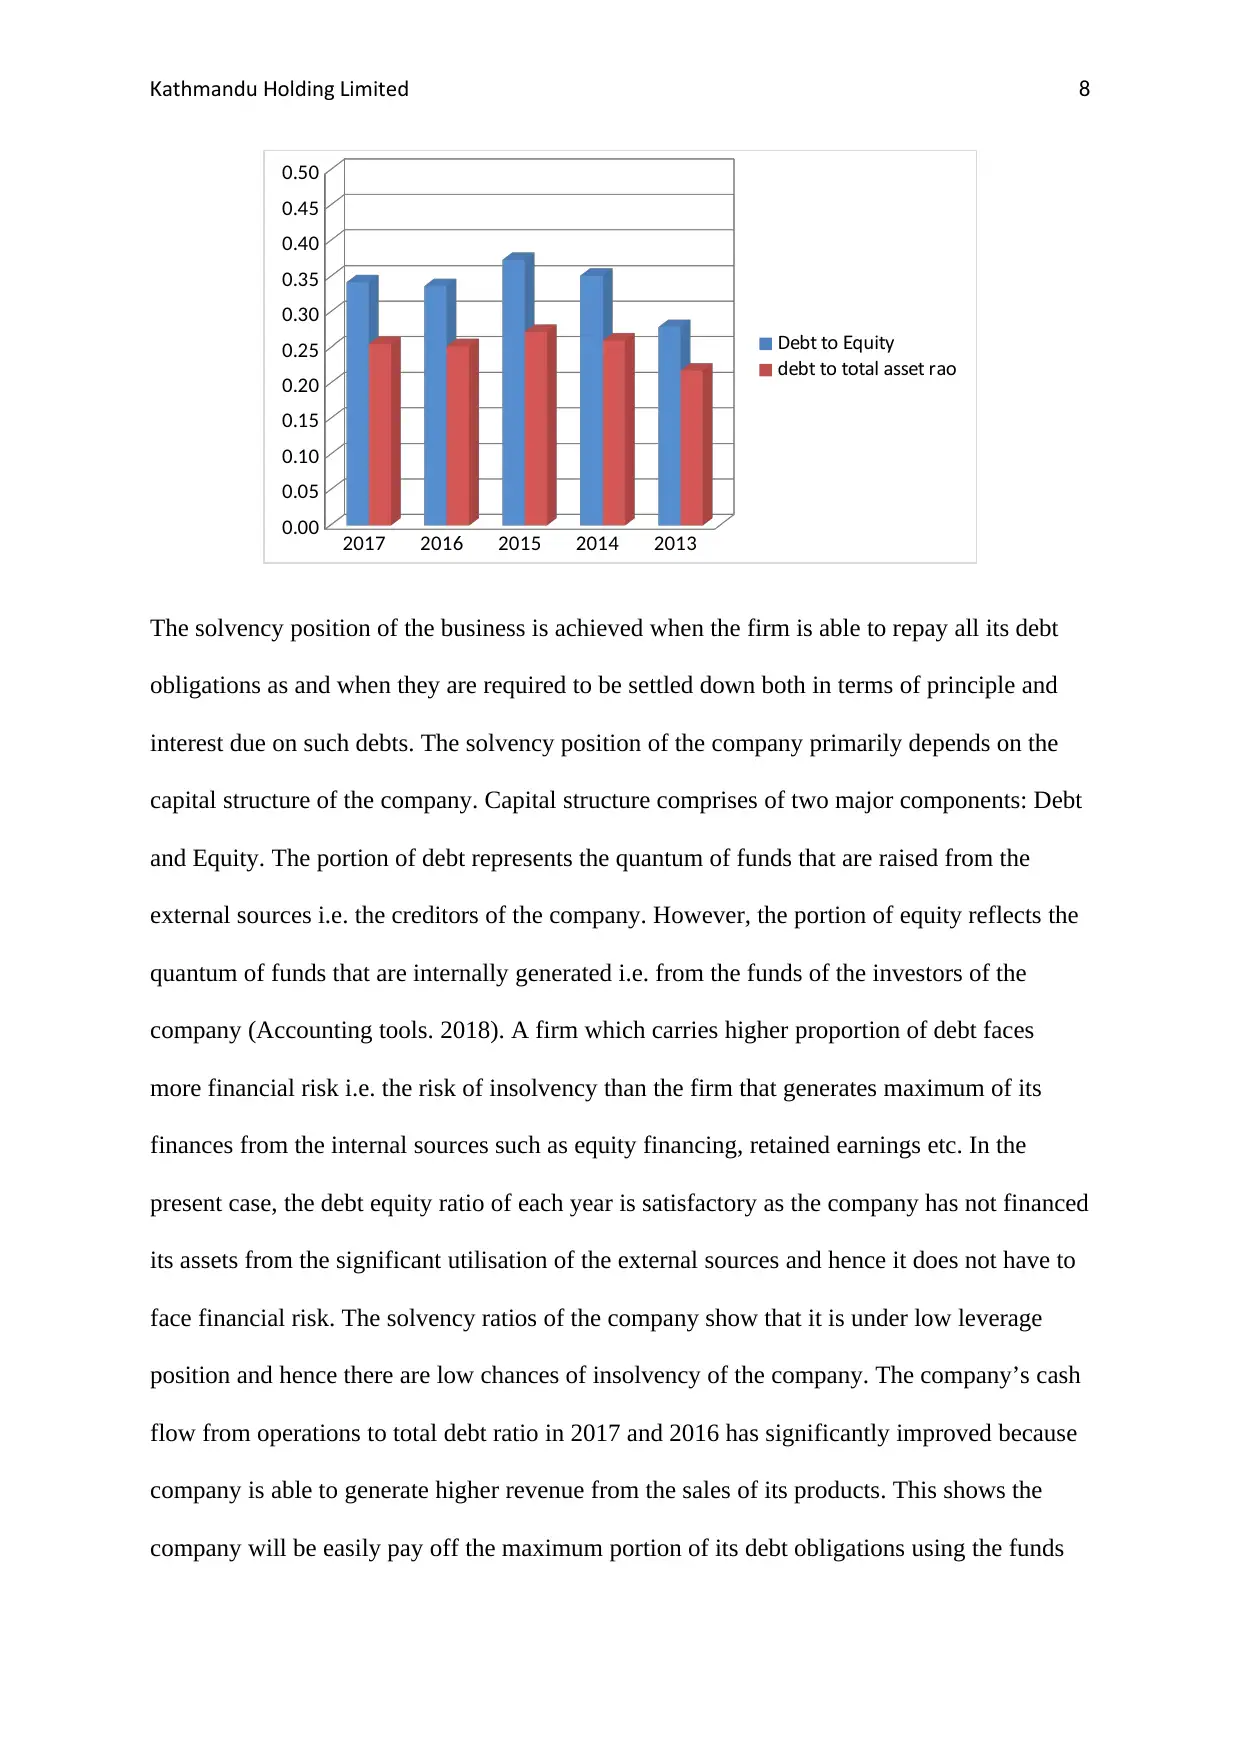
The solvency position of the business is achieved when the firm is able to repay all its debt
obligations as and when they are required to be settled down both in terms of principle and
interest due on such debts. The solvency position of the company primarily depends on the
capital structure of the company. Capital structure comprises of two major components: Debt
and Equity. The portion of debt represents the quantum of funds that are raised from the
external sources i.e. the creditors of the company. However, the portion of equity reflects the
quantum of funds that are internally generated i.e. from the funds of the investors of the
company (Accounting tools. 2018). A firm which carries higher proportion of debt faces
more financial risk i.e. the risk of insolvency than the firm that generates maximum of its
finances from the internal sources such as equity financing, retained earnings etc. In the
present case, the debt equity ratio of each year is satisfactory as the company has not financed
its assets from the significant utilisation of the external sources and hence it does not have to
face financial risk. The solvency ratios of the company show that it is under low leverage
position and hence there are low chances of insolvency of the company. The company’s cash
flow from operations to total debt ratio in 2017 and 2016 has significantly improved because
company is able to generate higher revenue from the sales of its products. This shows the
company will be easily pay off the maximum portion of its debt obligations using the funds
2017 2016 2015 2014 2013
0.00
0.05
0.10
0.15
0.20
0.25
0.30
0.35
0.40
0.45
0.50
Debt to quityE
debt to total asset ratio
The solvency position of the business is achieved when the firm is able to repay all its debt
obligations as and when they are required to be settled down both in terms of principle and
interest due on such debts. The solvency position of the company primarily depends on the
capital structure of the company. Capital structure comprises of two major components: Debt
and Equity. The portion of debt represents the quantum of funds that are raised from the
external sources i.e. the creditors of the company. However, the portion of equity reflects the
quantum of funds that are internally generated i.e. from the funds of the investors of the
company (Accounting tools. 2018). A firm which carries higher proportion of debt faces
more financial risk i.e. the risk of insolvency than the firm that generates maximum of its
finances from the internal sources such as equity financing, retained earnings etc. In the
present case, the debt equity ratio of each year is satisfactory as the company has not financed
its assets from the significant utilisation of the external sources and hence it does not have to
face financial risk. The solvency ratios of the company show that it is under low leverage
position and hence there are low chances of insolvency of the company. The company’s cash
flow from operations to total debt ratio in 2017 and 2016 has significantly improved because
company is able to generate higher revenue from the sales of its products. This shows the
company will be easily pay off the maximum portion of its debt obligations using the funds
⊘ This is a preview!⊘
Do you want full access?
Subscribe today to unlock all pages.
Trusted by 1+ million students worldwide
athmandu olding imitedK H L 9
that have been generated from the operating activities of the company. The results of this
ratio show that the firm is able to generate more of the returns in 2017 and 2016 as compared
to the previously reported three financial years. The interest coverage ratio of the company
shows the portion of earnings that will be required to pay off the borrowing expenses i.e. the
interest cost of the debt funds. In 2017, the interest expense ratio is increased due to increased
proportion of debt in the entire capital structure of the company and this casts higher risk of
insolvency on the company.
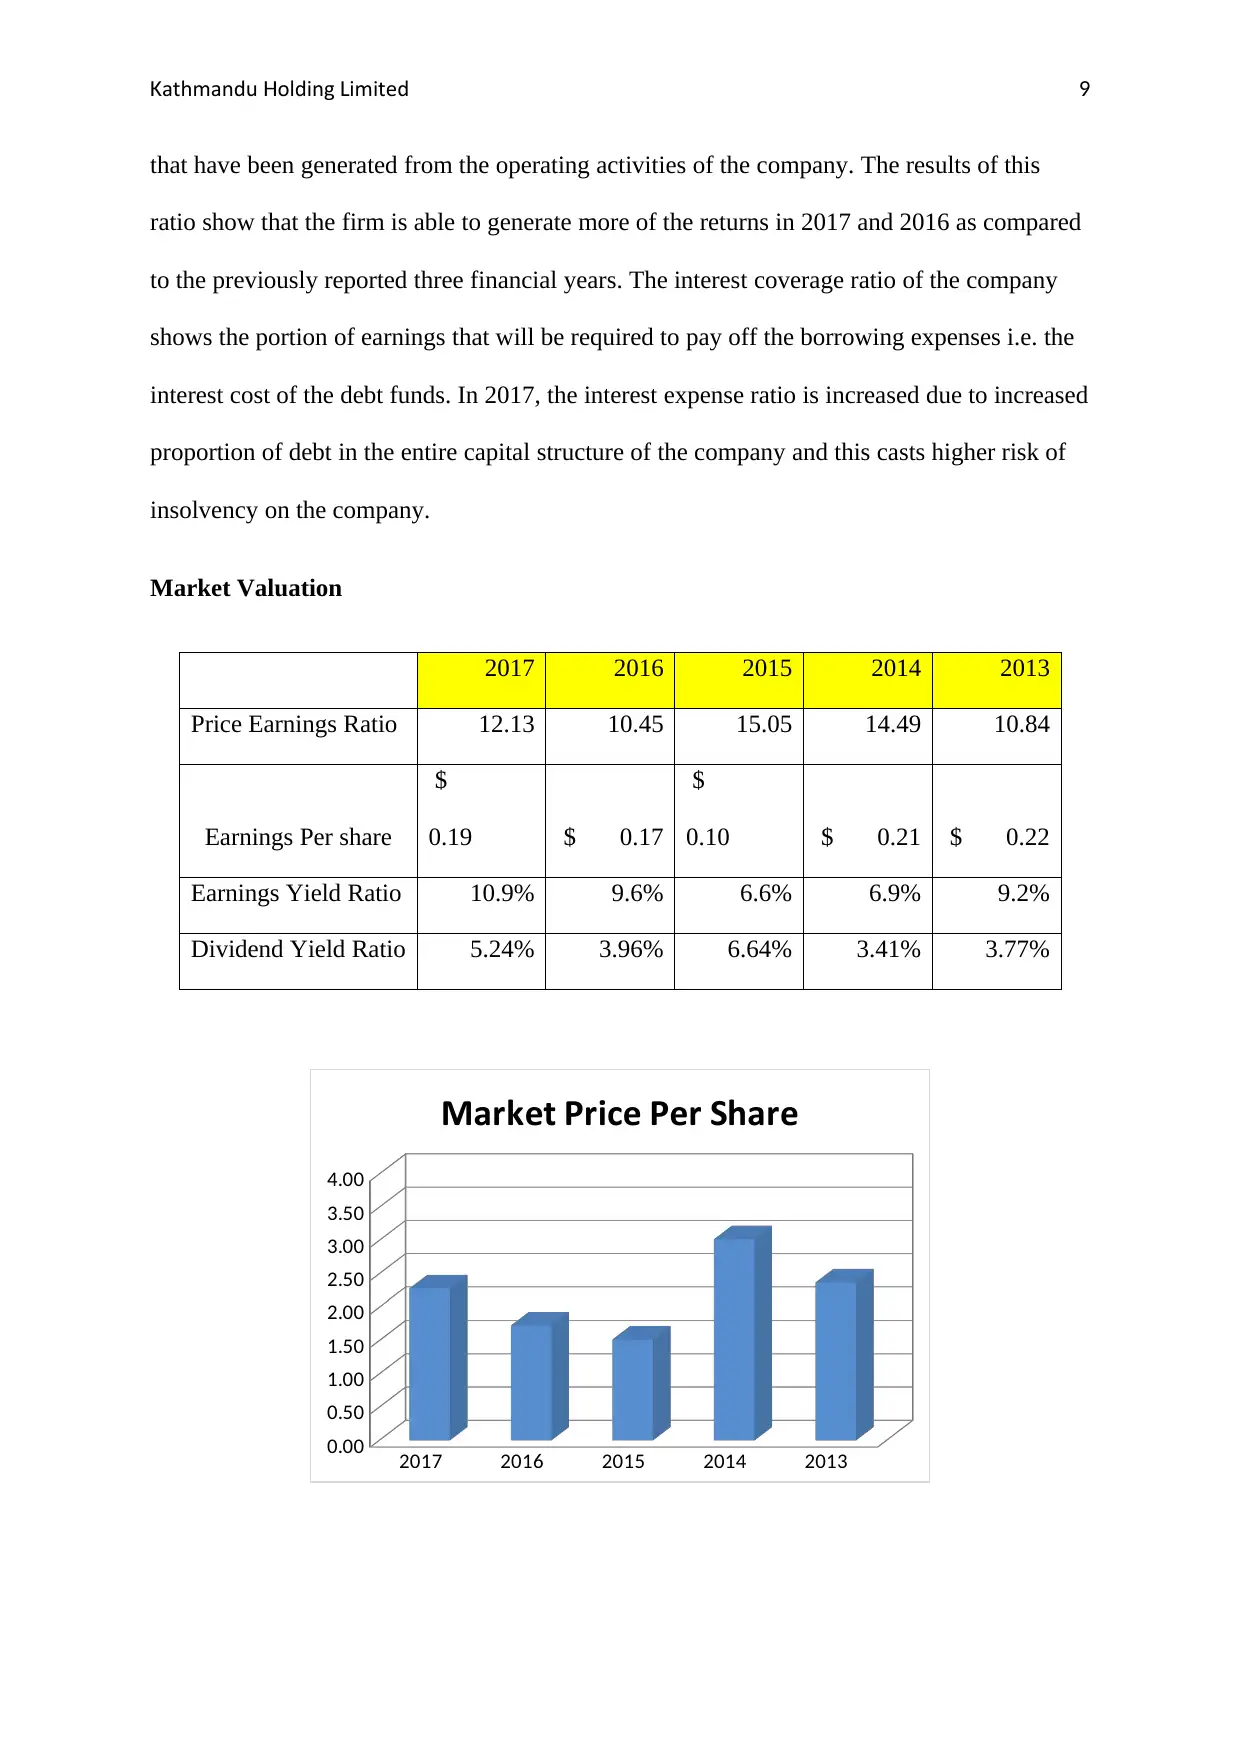
Market Valuation
2017 2016 2015 2014 2013
Price Earnings Ratio 12.13 10.45 15.05 14.49 10.84
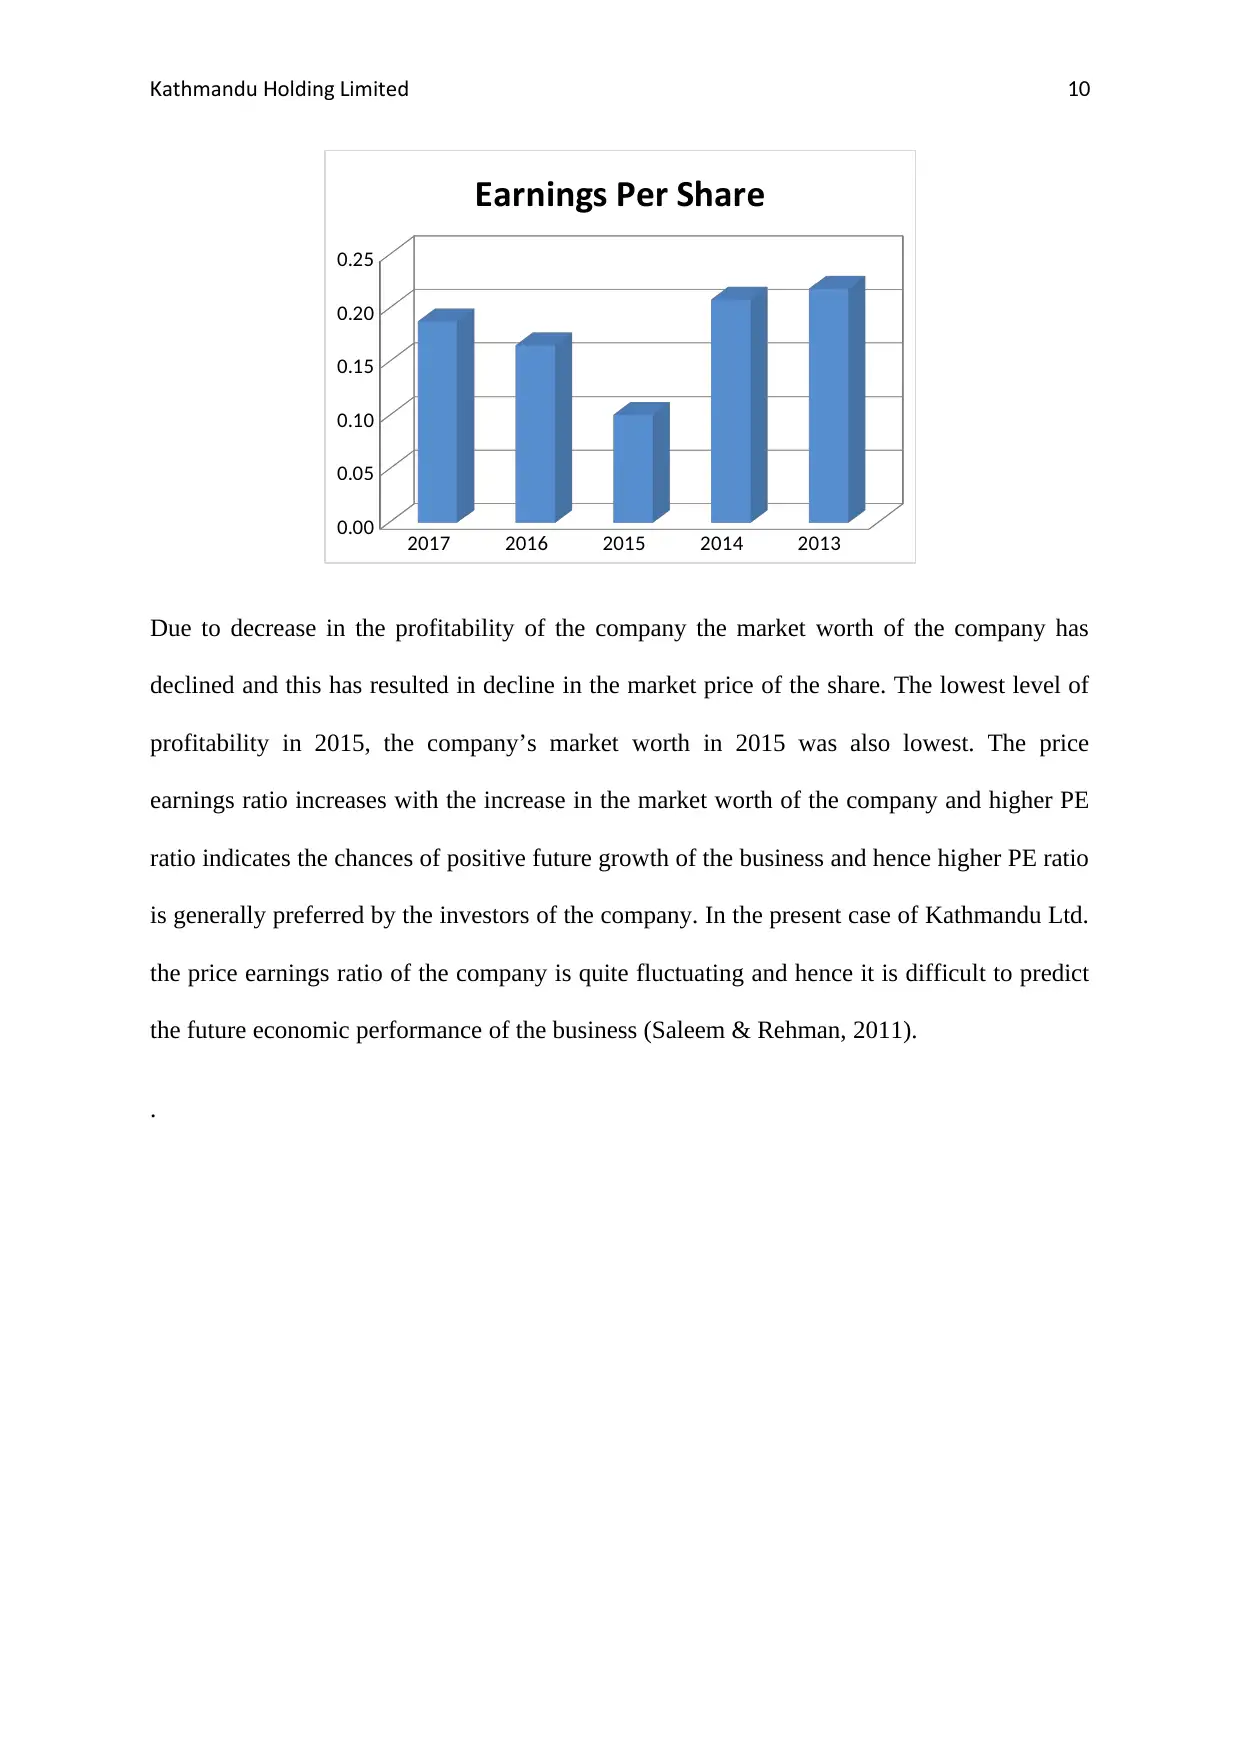
Earnings Per share
$
0.19 $ 0.17
$
0.10 $ 0.21 $ 0.22
Earnings Yield Ratio 10.9% 9.6% 6.6% 6.9% 9.2%
Dividend Yield Ratio 5.24% 3.96% 6.64% 3.41% 3.77%
2017 2016 2015 2014 2013
0.00
0.50
1.00
1.50
2.00
2.50
3.00
3.50
4.00
Market Price Per Share
that have been generated from the operating activities of the company. The results of this
ratio show that the firm is able to generate more of the returns in 2017 and 2016 as compared
to the previously reported three financial years. The interest coverage ratio of the company
shows the portion of earnings that will be required to pay off the borrowing expenses i.e. the
interest cost of the debt funds. In 2017, the interest expense ratio is increased due to increased
proportion of debt in the entire capital structure of the company and this casts higher risk of
insolvency on the company.
Market Valuation
2017 2016 2015 2014 2013
Price Earnings Ratio 12.13 10.45 15.05 14.49 10.84
Earnings Per share
$
0.19 $ 0.17
$
0.10 $ 0.21 $ 0.22
Earnings Yield Ratio 10.9% 9.6% 6.6% 6.9% 9.2%
Dividend Yield Ratio 5.24% 3.96% 6.64% 3.41% 3.77%
2017 2016 2015 2014 2013
0.00
0.50
1.00
1.50
2.00
2.50
3.00
3.50
4.00
Market Price Per Share
Paraphrase This Document
Need a fresh take? Get an instant paraphrase of this document with our AI Paraphraser
athmandu olding imitedK H L 10
2017 2016 2015 2014 2013
0.00
0.05
0.10
0.15
0.20
0.25
Earnings Per Share
Due to decrease in the profitability of the company the market worth of the company has
declined and this has resulted in decline in the market price of the share. The lowest level of
profitability in 2015, the company’s market worth in 2015 was also lowest. The price
earnings ratio increases with the increase in the market worth of the company and higher PE
ratio indicates the chances of positive future growth of the business and hence higher PE ratio
is generally preferred by the investors of the company. In the present case of Kathmandu Ltd.
the price earnings ratio of the company is quite fluctuating and hence it is difficult to predict
the future economic performance of the business (Saleem & Rehman, 2011).
.
athmandu olding imitedK H L 11
Conclusion and Recommendations:
From the above analysis, it can be said that ratio analysis helps significantly in measuring the
overall financial performance of the business from different possible parameters. Ratio
analysis covers almost every important aspect of the business on which the financial
performance of business depends and helps the company to identify the areas where
significant deficiencies are found. In the present case of Kathmandu Ltd, the company’s
liquidity position has worsened with each passing years subsequent to 2015. The company
must make efforts to manage its current assets in such a way that they are sufficiently
available to meet the short term debt obligations of the business as and when they become
due so as to promote its working capital management. If adequate amount of current account
balance is not available with the business, the company will have to face severe cash crises in
the subsequent years. So, in order to improve the liquidity position of the business,
Kathmandu Ltd. will have to ensure that its trade credit policy is stringent enough to collect
cash from all the trade debtors of the company so that timely payment of trade creditors i.e.
the supplier of the business can be made and also to avoid incurrence of high interest costs on
the credit purchases which amounts to considerable outflow of cash from the business.
Further, the profitability position of the company can be improved further to reach the desired
profitability level (Lee, Lee & Lee, 2009). In order to improve the overall profitability of the
business, the company must focus on the ways that could increase its revenue from sales and
also to those ways that could lead to ultimate cost cutting of the business. The company must
make use of its funds of the shareholders in the most efficient way that allows it to generate
more sales from the business. Further, the company must reduce further the level of its debt
obligations so as to cut down the interest cost which negatively affects the earnings capacity
of the business. The major reason of decline in the market worth of the company is its
declining earnings per share which is resulted from the low profitability position of the
⊘ This is a preview!⊘
Do you want full access?
Subscribe today to unlock all pages.
Trusted by 1+ million students worldwide
1 out of 19
Related Documents


Your All-in-One AI-Powered Toolkit for Academic Success.
+13062052269
info@desklib.com
Available 24*7 on WhatsApp / Email
![[object Object]](/_next/static/media/star-bottom.7253800d.svg)
Unlock your academic potential
Copyright © 2020–2026 A2Z Services. All Rights Reserved. Developed and managed by ZUCOL.