Comparative Ratio Analysis: Kathmandu Ltd and OrotonGroup
VerifiedAdded on Ā 2020/03/02
|7
|1772
|98
Report
AI Summary
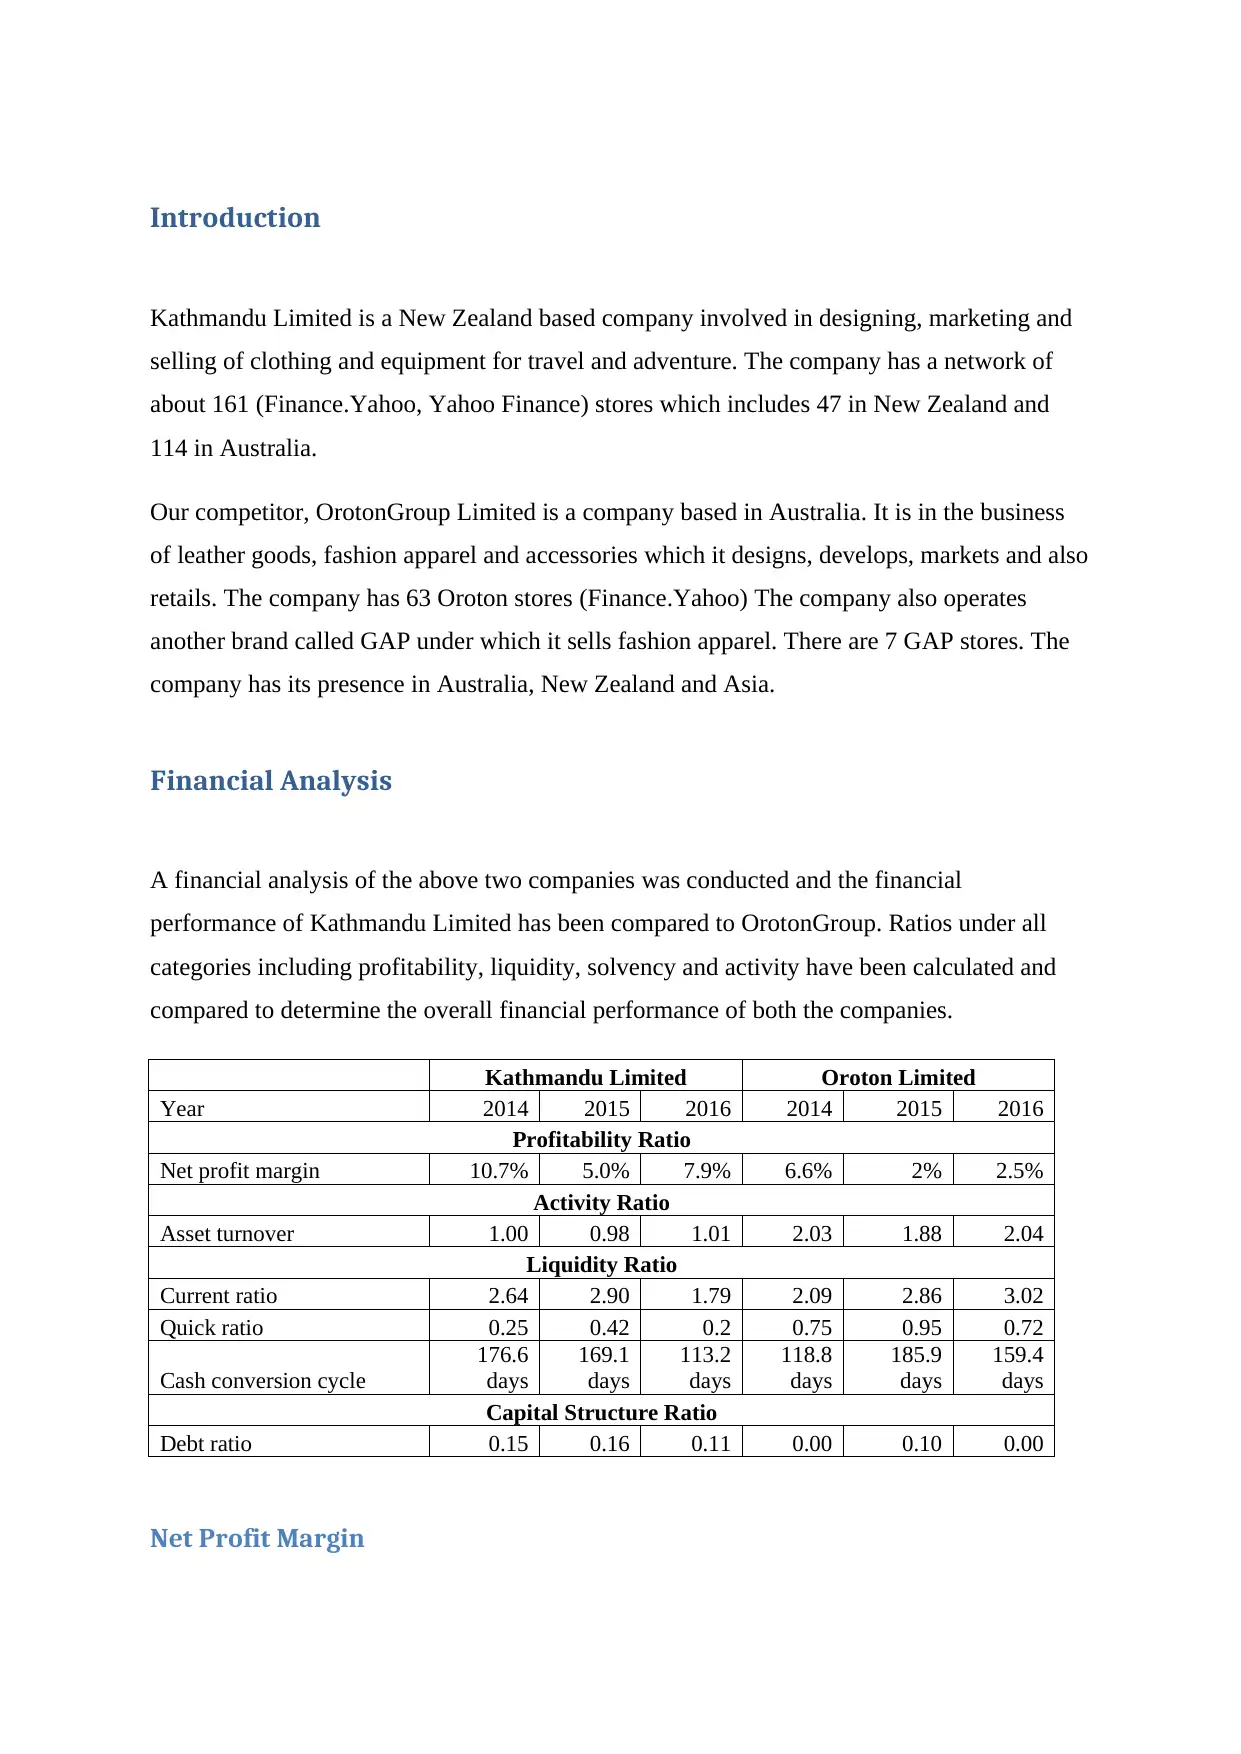
This report presents a comparative financial analysis of Kathmandu Limited and OrotonGroup, two companies operating in the retail and fashion industries. The analysis employs various financial ratios, including profitability (net profit margin), activity (asset turnover), liquidity (current and quick ratios), and capital structure (debt ratio), to assess and compare their financial performance over the period from 2014 to 2016. The report calculates and interprets these ratios, highlighting key trends and differences between the two companies. Kathmandu Limited demonstrates stronger profit margins, while OrotonGroup exhibits better asset utilization. The report also examines liquidity and solvency, revealing OrotonGroup's stronger position in these areas. Furthermore, the analysis includes a discussion of the cash conversion cycle and offers recommendations to potential investors, concluding that Kathmandu Limited is the more favorable investment due to its superior profit margins and potential for improved liquidity.

Ratio Analysis
Comparison between Kathmandu Limited and OrotonGroup
Paraphrase This Document
Need a fresh take? Get an instant paraphrase of this document with our AI Paraphraser

Introduction
Kathmandu Limited is a New Zealand based company involved in designing, marketing and
selling of clothing and equipment for travel and adventure. The company has a network of
about 161 (Finance.Yahoo, Yahoo Finance) stores which includes 47 in New Zealand and
114 in Australia.
Our competitor, OrotonGroup Limited is a company based in Australia. It is in the business
of leather goods, fashion apparel and accessories which it designs, develops, markets and also
retails. The company has 63 Oroton stores (Finance.Yahoo) The company also operates
another brand called GAP under which it sells fashion apparel. There are 7 GAP stores. The
company has its presence in Australia, New Zealand and Asia.
Financial Analysis
A financial analysis of the above two companies was conducted and the financial
performance of Kathmandu Limited has been compared to OrotonGroup. Ratios under all
categories including profitability, liquidity, solvency and activity have been calculated and
compared to determine the overall financial performance of both the companies.
Kathmandu Limited Oroton Limited
Year 2014 2015 2016 2014 2015 2016
Profitability Ratio
Net profit margin 10.7% 5.0% 7.9% 6.6% 2% 2.5%
Activity Ratio
Asset turnover 1.00 0.98 1.01 2.03 1.88 2.04
Liquidity Ratio
Current ratio 2.64 2.90 1.79 2.09 2.86 3.02
Quick ratio 0.25 0.42 0.2 0.75 0.95 0.72
Cash conversion cycle
176.6
days
169.1
days
113.2
days
118.8
days
185.9
days
159.4
days
Capital Structure Ratio
Debt ratio 0.15 0.16 0.11 0.00 0.10 0.00
Net Profit Margin

It is the profit which is left after deducting all business related expenses from sales. This
profit is available to shareholders.
The net profit margin has decreased from 2014 to 2016. This is because of huge costs
incurred in inventory clearance in 2015 (Limited, 2015) This led to lower margin sales and
also increased operating costs further declined the profits. However, the margin has improved
in 2016 with an increase in sales due to product newness and better promotional activity.
Also the operating costs decreased leading to a strong result.
Kathmandu Limited has far better margin as compared to OrotonGroup in all the three years.
The profits of Oroton have decreased significantly in 2015 owing to increased purchasing
costs due to weak Australian dollar and also opening of lower margins GAP stores
(OrotonGroup, OrotonGroup Annual Report 2015, 2015) In spite of weak Australian dollar,
Kathmandu Ltd has higher margins.
Asset Turnover
The ratio measures the efficiency with which the company is utilizing its assets to generate
sales.
The ratio has remained more or less constant in all the years for Kathmandu Limited. The
ratio is nearly 1 which means the company is generating 1 dollar revenue for every dollar
invested in assets.
Oroton has better asset turnover ratio of around 2 in all the three years. This means it is
utilizing its assets in a more efficient way to generate sales. The efficiency can be said to be
twice than that of Kathmandu.
Current Ratio
It is the ability of the company to pay for its short term obligations from its current assets. It
is a liquidity measure of the company.
The current ratio was higher than 2 in 2014 and 2015; however it has fallen below 2 in 2016
for Kathmandu. This is because of a decrease in current assets owing to a decrease in
inventory. The company has implemented a demand planning software due to which the
levels of inventory have reduced.
ā This is a preview!ā
Do you want full access?
Subscribe today to unlock all pages.

Trusted by 1+ million students worldwide

The current ratio of Kathmandu is lower as compared to Oroton and the ratio has increased
over the years for Oroton. Oroton has fewer liabilities as there is no short term borrowing and
also the inventory levels have decreased in 2016.
Quick Ratio
Quick ratio is the ability of the company to pay for its current liabilities from its quick assets
which can be converted into cash within 90 days.
Kathmandu limited has very low quick ratio and the ratio has reached its lowest in 2016 as
liabilities have increased more than assets. This is because inventory comprises of most of the
current assets. The quick assets are very low as compared to current liabilities and hence
render the company low on liquidity.
Oroton has a better quick ratio throughout which shows its stronger liquidity position.
Debt Ratio
The ratio measures the percentage of companyās assets that have been financed by debt.
The debt ratio of Kathmandu has decreased over the three years. The debt levels of the
company reduced in 2016. Most of the companyās assets are financed through equity.
However, the debt ratio of Kathmandu is higher as compared to Oroton. Oroton has not debt
at all in 2014 and 2016. All assets are financed through equity. Though this makes the
company stable but as a result the company is not leveraged.
Cash Conversion Cycle
It is the time taken to convert purchase into sales and is comprised of dayās inventory
outstanding, dayās sales outstanding and dayās payables outstanding.
The cash conversion cycle of Kathmandu has decreased over the period. This is because of
decrease in inventory levels owing to the demand planning software. Also the dayās payables
have increased leading to a lower cash cycle. The company has low sales outstanding which
means it recovers its debts very quickly.
Paraphrase This Document
Need a fresh take? Get an instant paraphrase of this document with our AI Paraphraser

In comparison to Kathmandu, Oroton has a longer cash conversion cycle basically because of
higher dayās sales outstanding. Also the dayās payables outstanding have decreased.
Recommendations
Based on the above ratios, we see that Kathmandu has higher profitability. In terms of
liquidity and capital structure, Oroton has better solvency both short term and long term. Also
Oroton has better asset utilization capacities. However, Kathmandu has a better working
capital management as it has a lower cash conversion cycle and its implementation of the
demand planning software will further improve the working capital.
It is recommended that a potential investor should go for Kathmandu Limited because of
better profit margins and also it is expected that the company will improve its liquidity with
low inventory. The debt ratio of Oroton looks better but no debt deprives the company of tax
benefits related to interest. Thus, Kathmandu is highly recommended.
Bibliography
Finance.Yahoo. (n.d.). Retrieved August 24, 2017, from
https://finance.yahoo.com/quote/ORL.AX/profile/
Finance.Yahoo. (n.d.). Yahoo Finance. Retrieved August 22, 2017, from
https://finance.yahoo.com/quote/KMD.NZ/profile?p=KMD.NZ
Kathmandu. (2016). Kathmandu 2016 Annual Report. New Zealand.
Limited, K. (2015). Kathmandu Annual Report 2015. New Zealand: Kathmandu Limited.
OrotonGroup. (2015). OrotonGroup Annual Report 2015. Australia.
OrotonGroup. (2016). OrotonGroup Annual Report 2016. Australia.
Appendix

Kathmandu Limited
Ratio Formula 2014 2015 2016
Net Profit
margin
Net profit /
sales
= 42152 / 392918
= 10.7%
= 20419 / 409372
= 5%
= 33521/ 425593
= 7.9%
Asset
Turnover
Sales /
Average total
assets
= 392918 / 392257
= 1
409372/ 419374
= 0.98
= 425593/ 421852
= 1.01
Current ratio Current assets/
current liab.
114748 / 43458
= 2.64
= 132348 / 45700
= 2.9
= 107358 / 59825
= 1.79
Quick ratio (Current
assets ā
inventory) /
Current liab.
(114748 ā 103767) /
43458
= 0.25
= (132348- 113270) /
45700
= 0.42
= (107358- 95436) /
59825
= 0.2
Debt ratio Total debt /
total assets
62715 / 408297
= 0.15
= 71015 / 430451
= 0.16
43691/ 413253
= 0.11
Cash
conversion
cycle
Days
inventory
outstanding +
days sales
outstanding +
days payables
outstanding
Days
inventory
outstanding
(Inventory /
cost of
sales)*365
=(103767 /
144777)*365
= 261.6 days
= (113270/
157482)*365
= 262.5 days
= (95436 /
159232)*365
= 218.8 days
Days sales
outstanding
(debtors / cost
of sales)*365
=(3779/144777)*365
= 9.5 days
=(3741/157482)*365
= 8.7 days
=(5031/159232)*365
= 11.5 days
Days
payables
outstanding
(creditors /
cost of
sales)*365
=(37489/144777)*365
= 94.5 days
=(44048/144777)*365
= 102 days
=(51084/144777)*365
= 117.1 days
Cash
conversion
176.6 days 169.1 days 113.2 days
ā This is a preview!ā
Do you want full access?
Subscribe today to unlock all pages.

Trusted by 1+ million students worldwide

cycle
OrotonGroup Limited
Ratio Formula 2014 2015 2016
Net Profit
margin
Net profit / sales = 8258 / 124889
= 6.6%
= 2620 / 132017
= 2%
= 3443/ 136439
= 2.5%
Asset
Turnover
Sales / Average
total assets
= 124889 / 61496
= 2.03
=132017/ 70346
= 1.88
= 136439/ 66932
= 2.04
Current ratio Current assets/
current liab.
43031 / 20634
= 2.09
= 56393 / 19693
= 2.86
= 40288 / 13341
= 3.02
Quick ratio (Current assets
ā inventory) /
Current liab.
(43031 ā 27598) /
20634
= 0.75
= (56393- 37713 /
19693
= 0.95
= (40288-30656 /
13341
= 0.72
Debt ratio Total debt / total
assets
0 / 62541
= 0
= 8000 / 78150
= 0.10
0/ 55714
= 0
Cash
conversion
cycle
Days inventory
outstanding +
days sales
outstanding +
days payables
outstanding
Days
inventory
outstanding
(Inventory / cost
of sales)*365
=(27598 /
46875)*365
= 214.9 days
= (37713/
51909)*365
= 265.2 days
= (30656 /
54408)*365
= 205.7 days
Days sales
outstanding
(debtors / cost
of sales)*365
=(5287/46875)*365
= 41.2 days
=(7482/51909)*365
= 52.6 days
=(5446/54408)*365
= 36.5 days
Days payables
outstanding
(creditors / cost
of sales)*365
=(17625/46875)*365
= 137.2 days
=(18750/51909)*36
5
= 131.8 days
=(12334/54408)*365
=82.7 days
Cash
conversion
cycle
118.8 days 185.9 days 159.4 days
1 out of 7
Related Documents

Your All-in-One AI-Powered Toolkit for Academic Success.
Ā +13062052269
info@desklib.com
Available 24*7 on WhatsApp / Email
Unlock your academic potential
Copyright Ā© 2020ā2025 A2Z Services. All Rights Reserved. Developed and managed by ZUCOL.