Statistical Data Analysis of KBS Supermarket Performance
VerifiedAdded on 2020/01/07
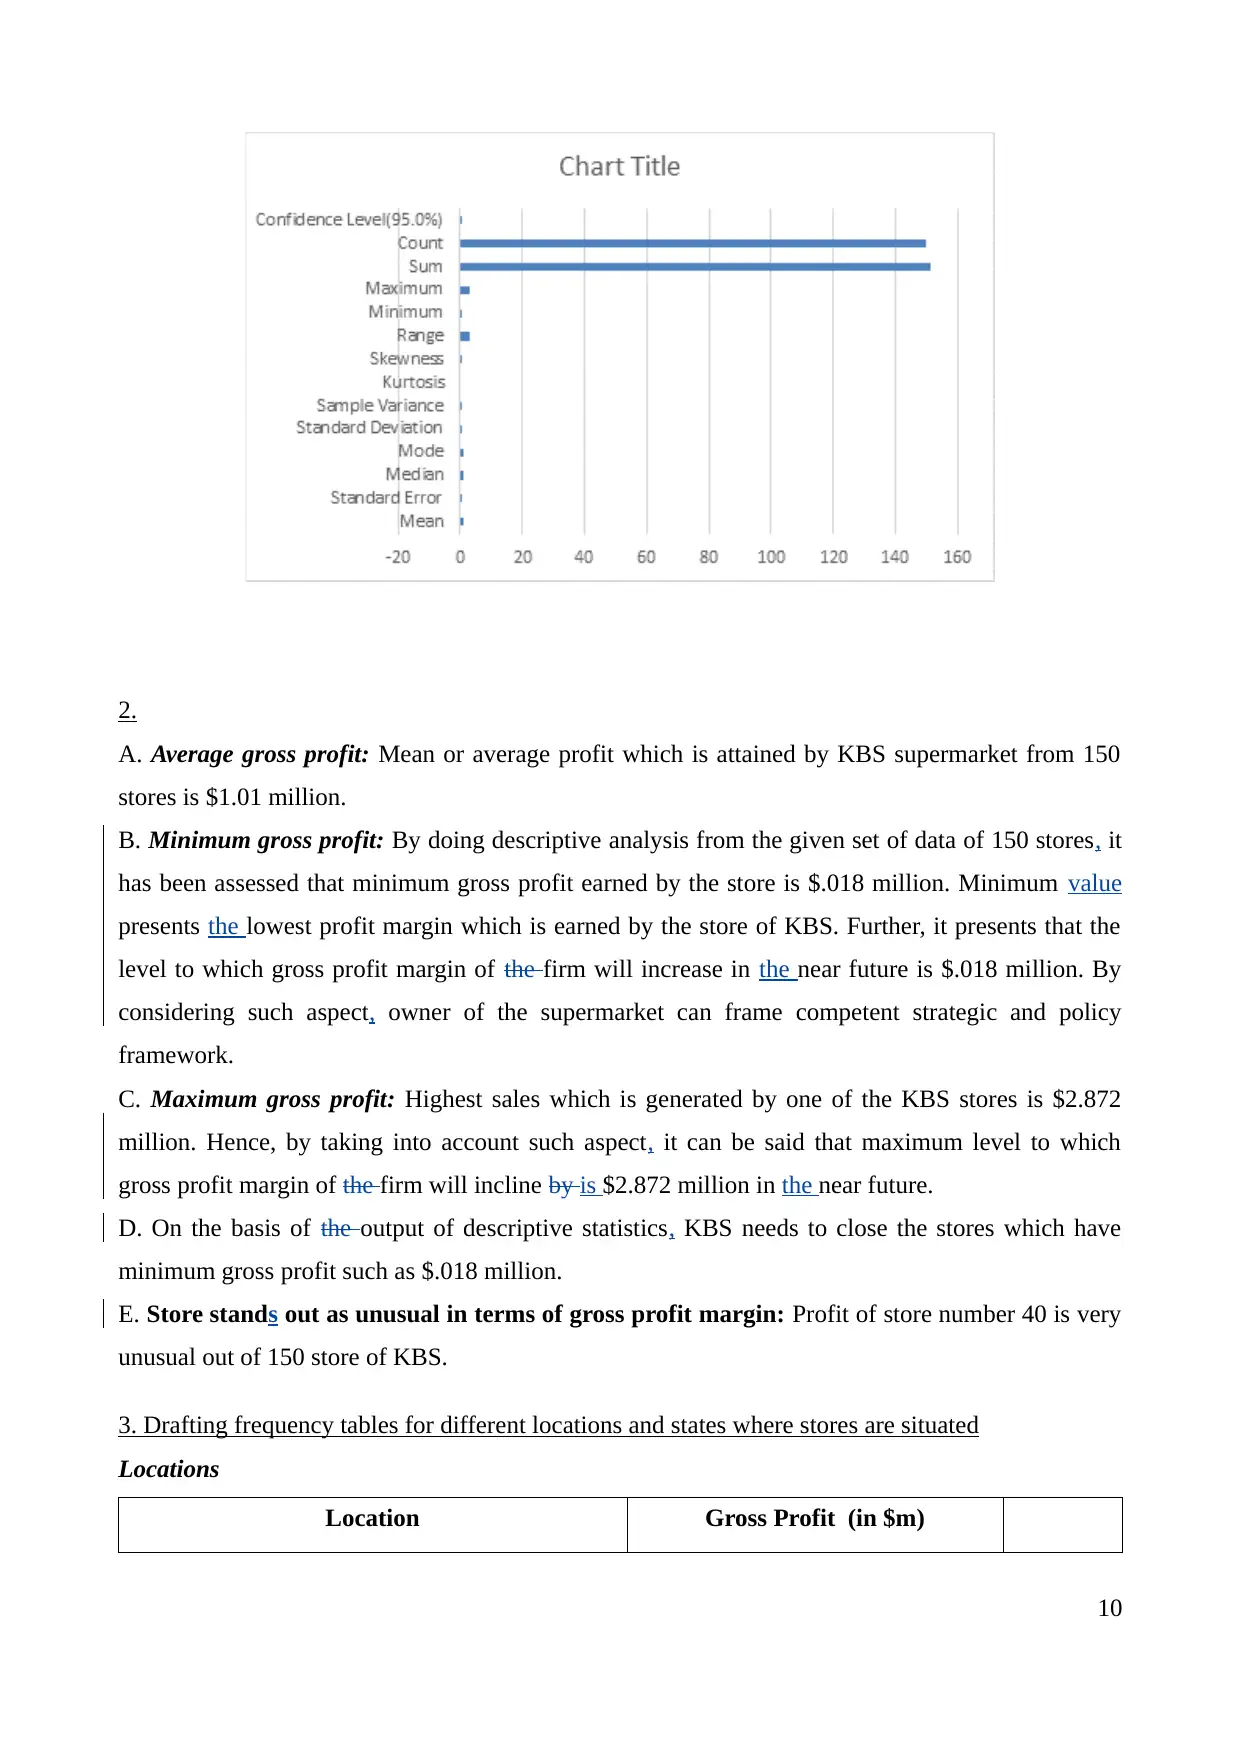
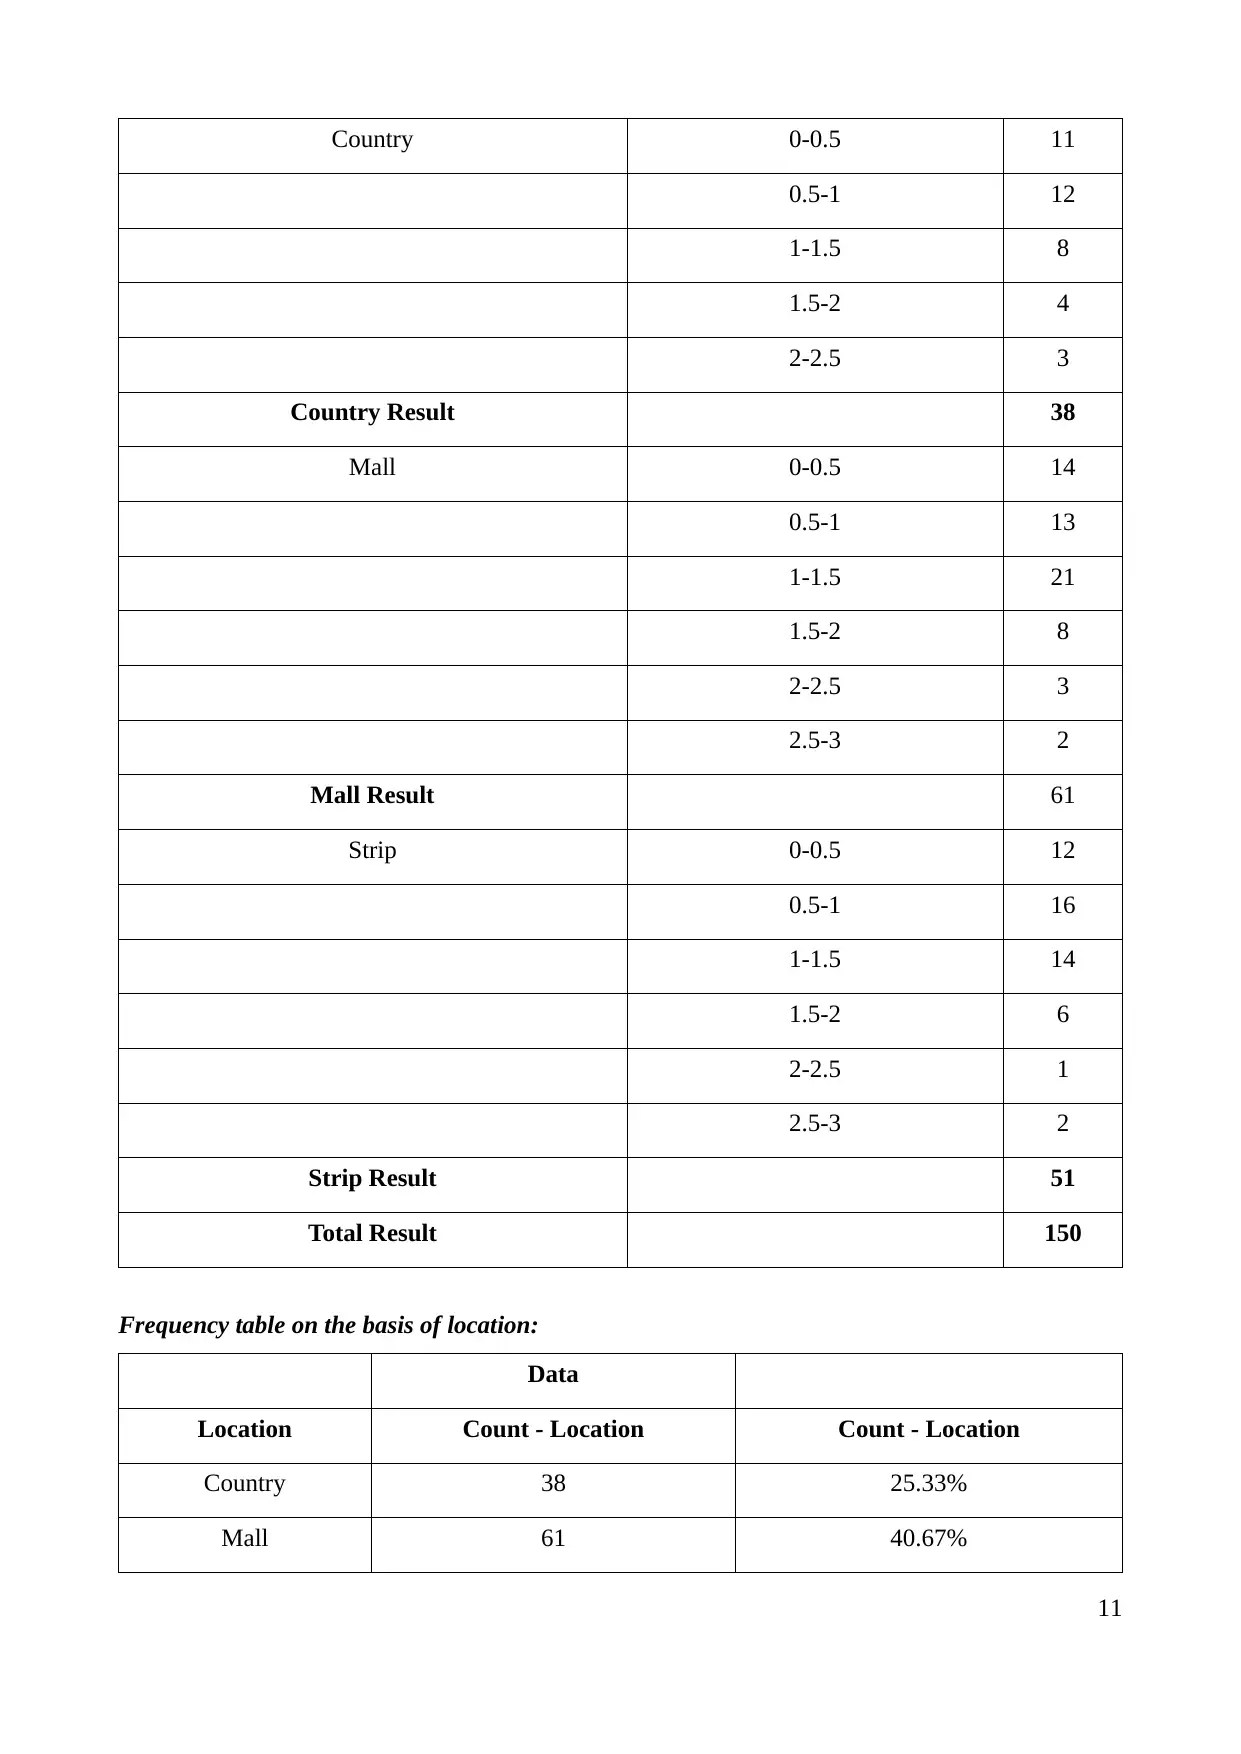
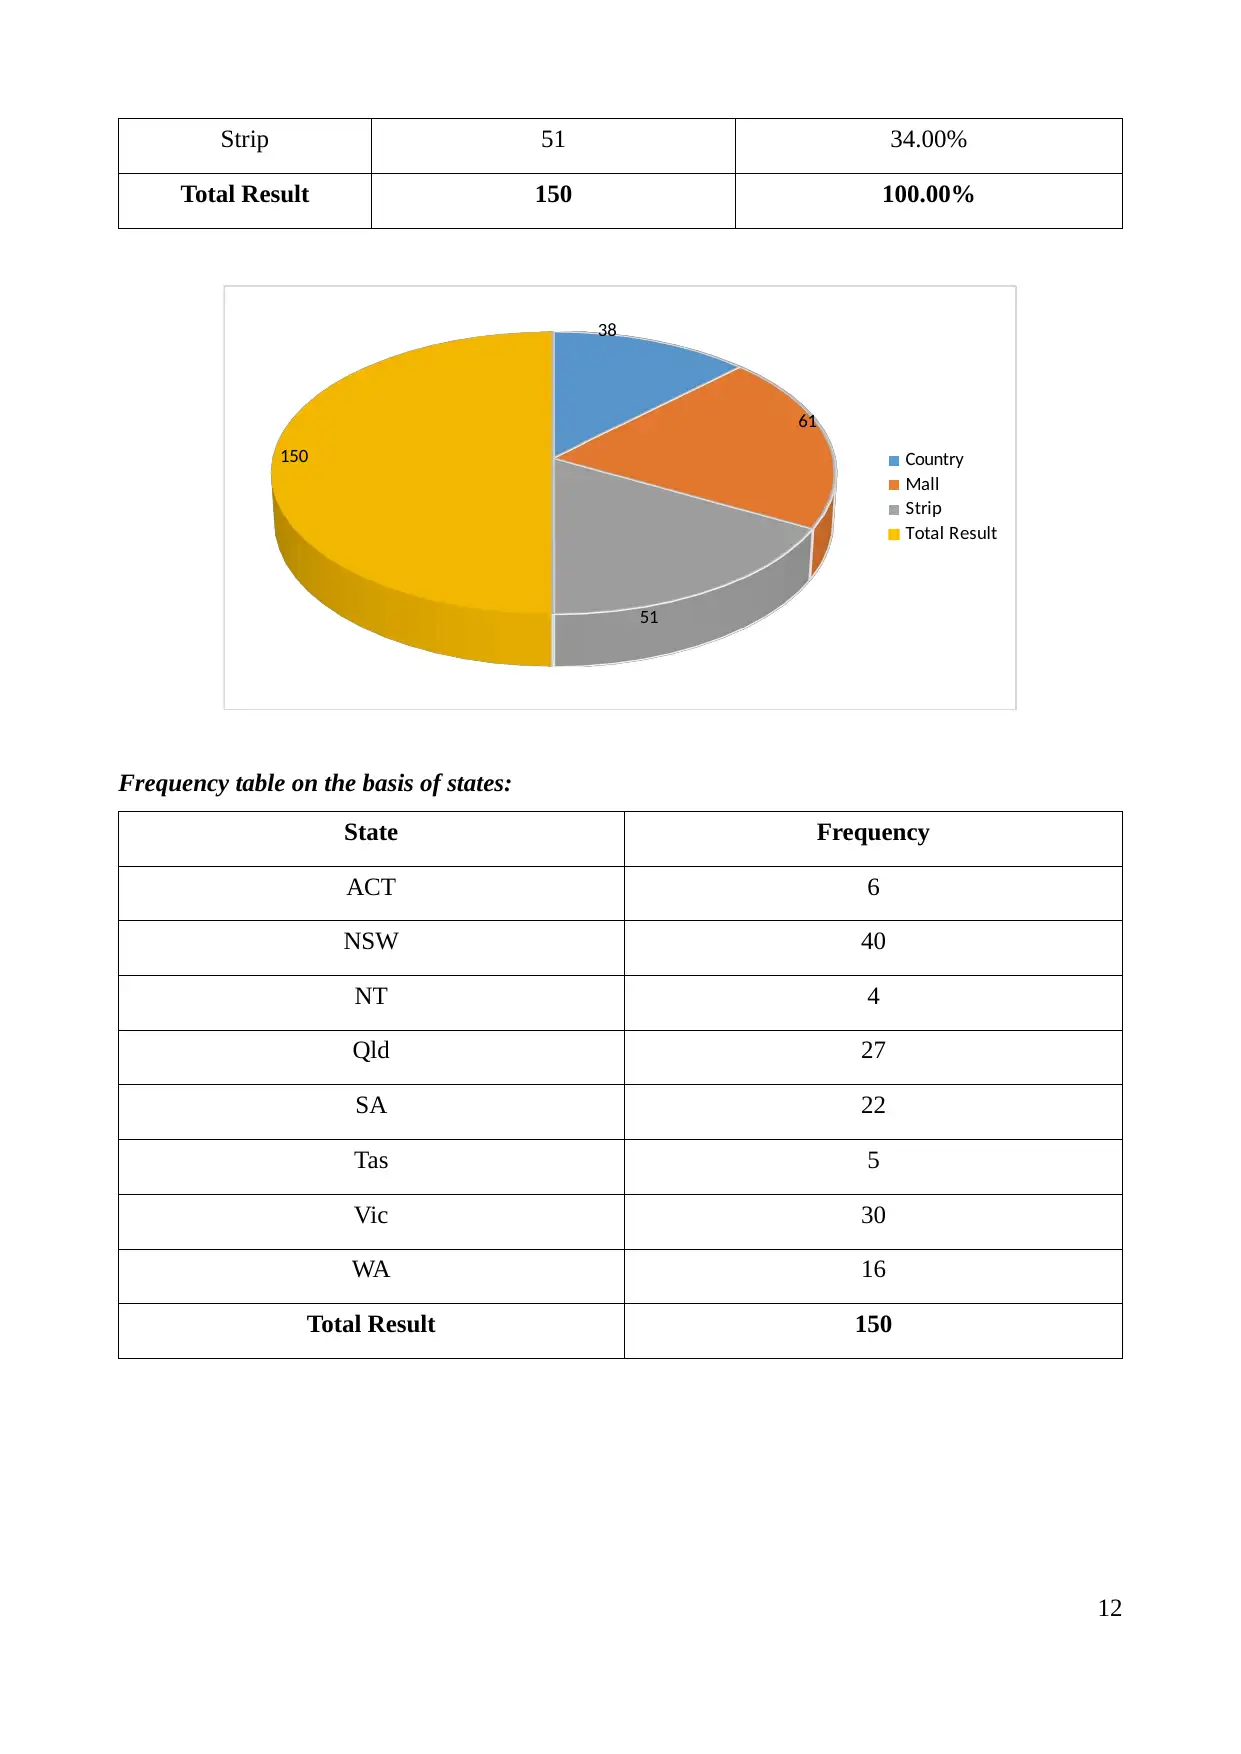
|18
|3322
|241
Homework Assignment
AI Summary
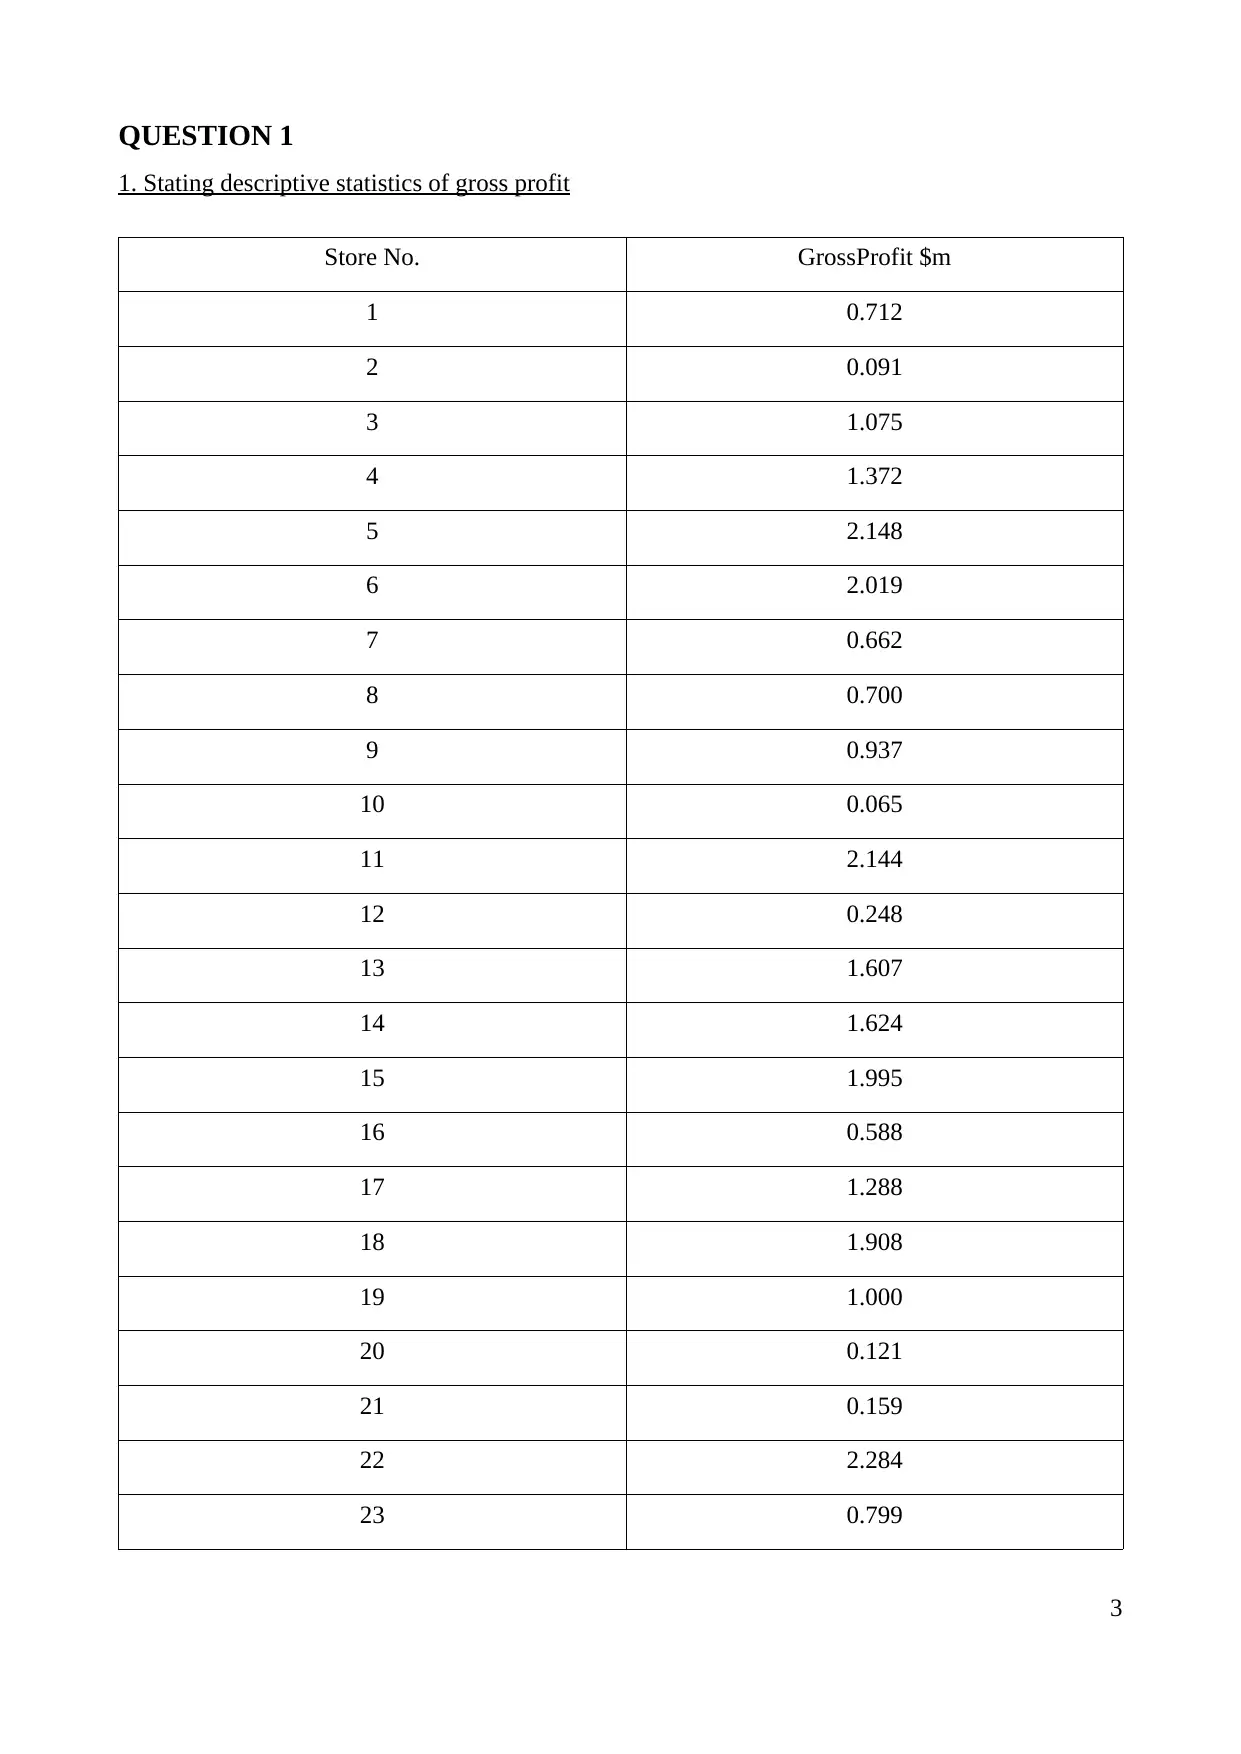
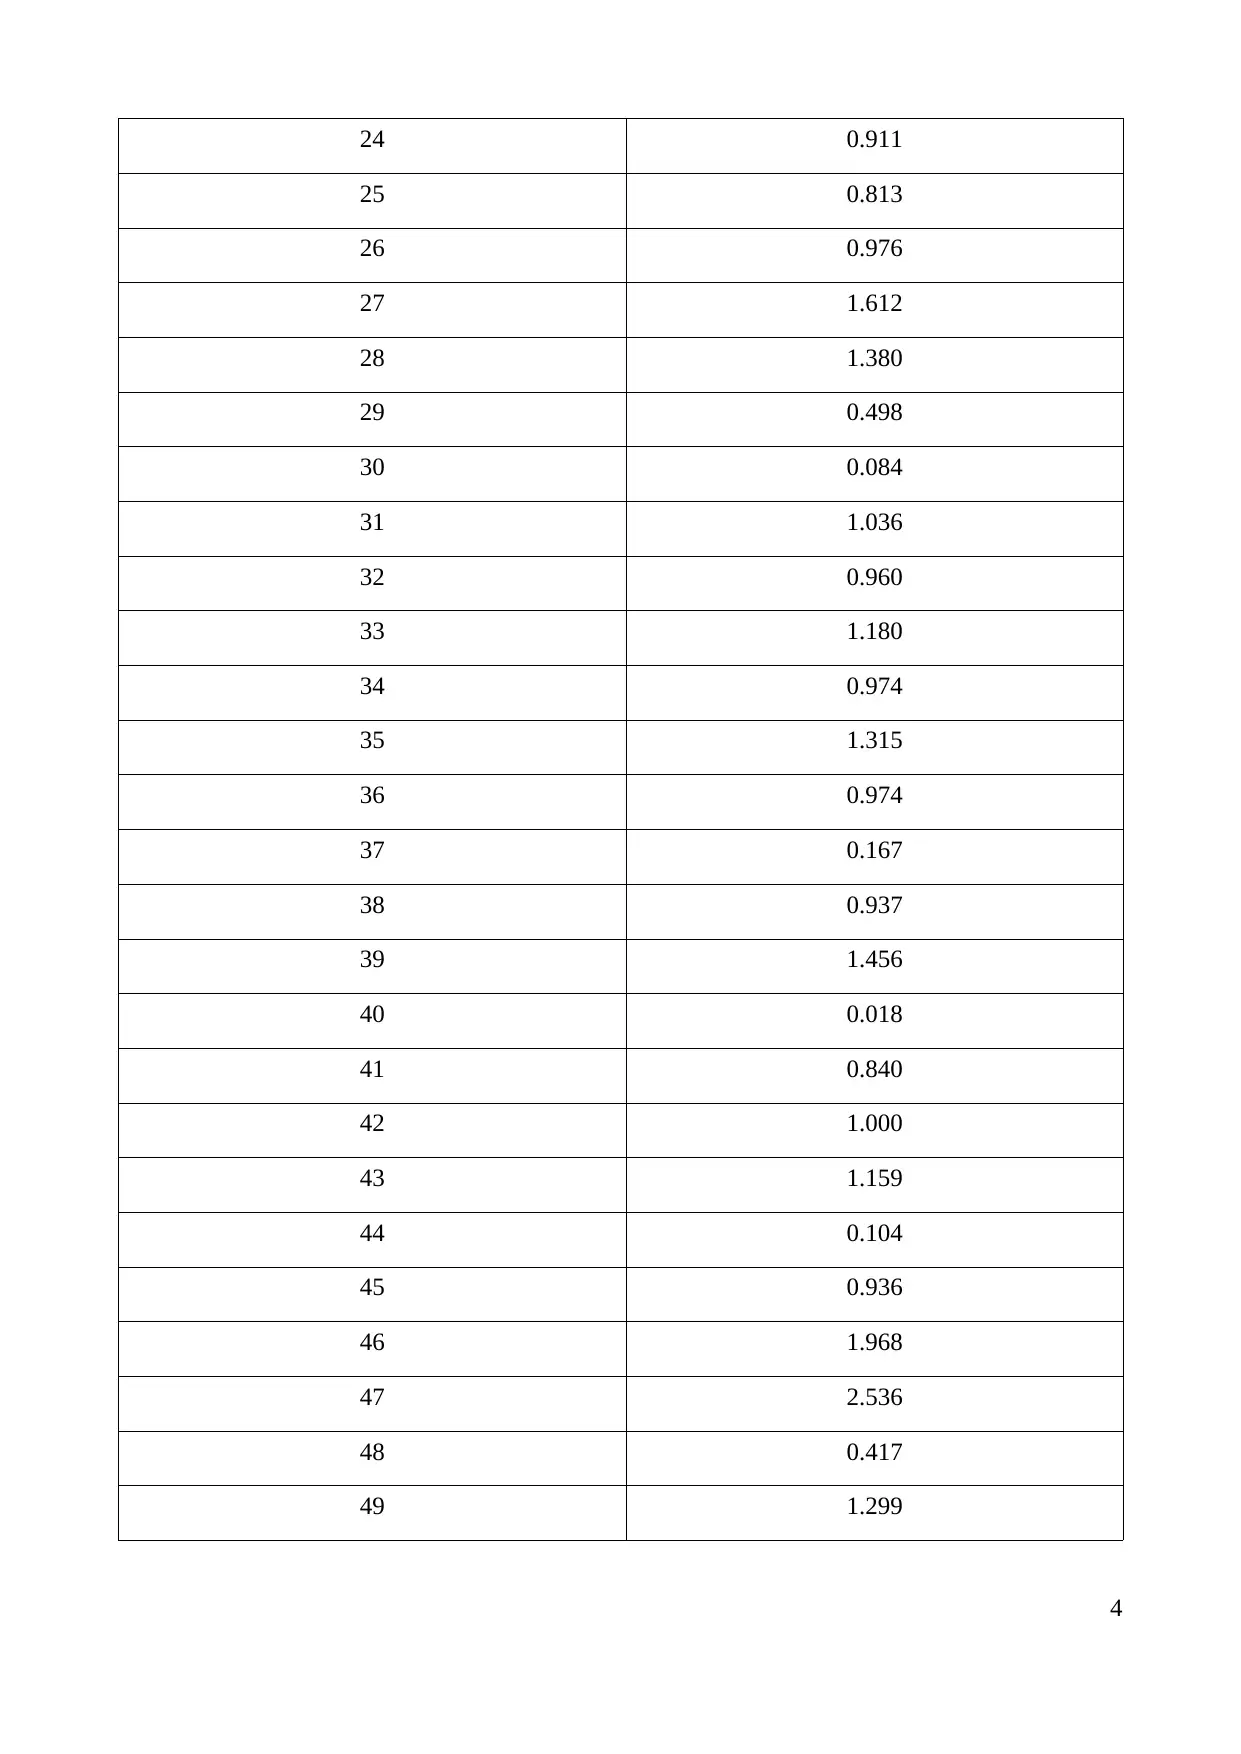
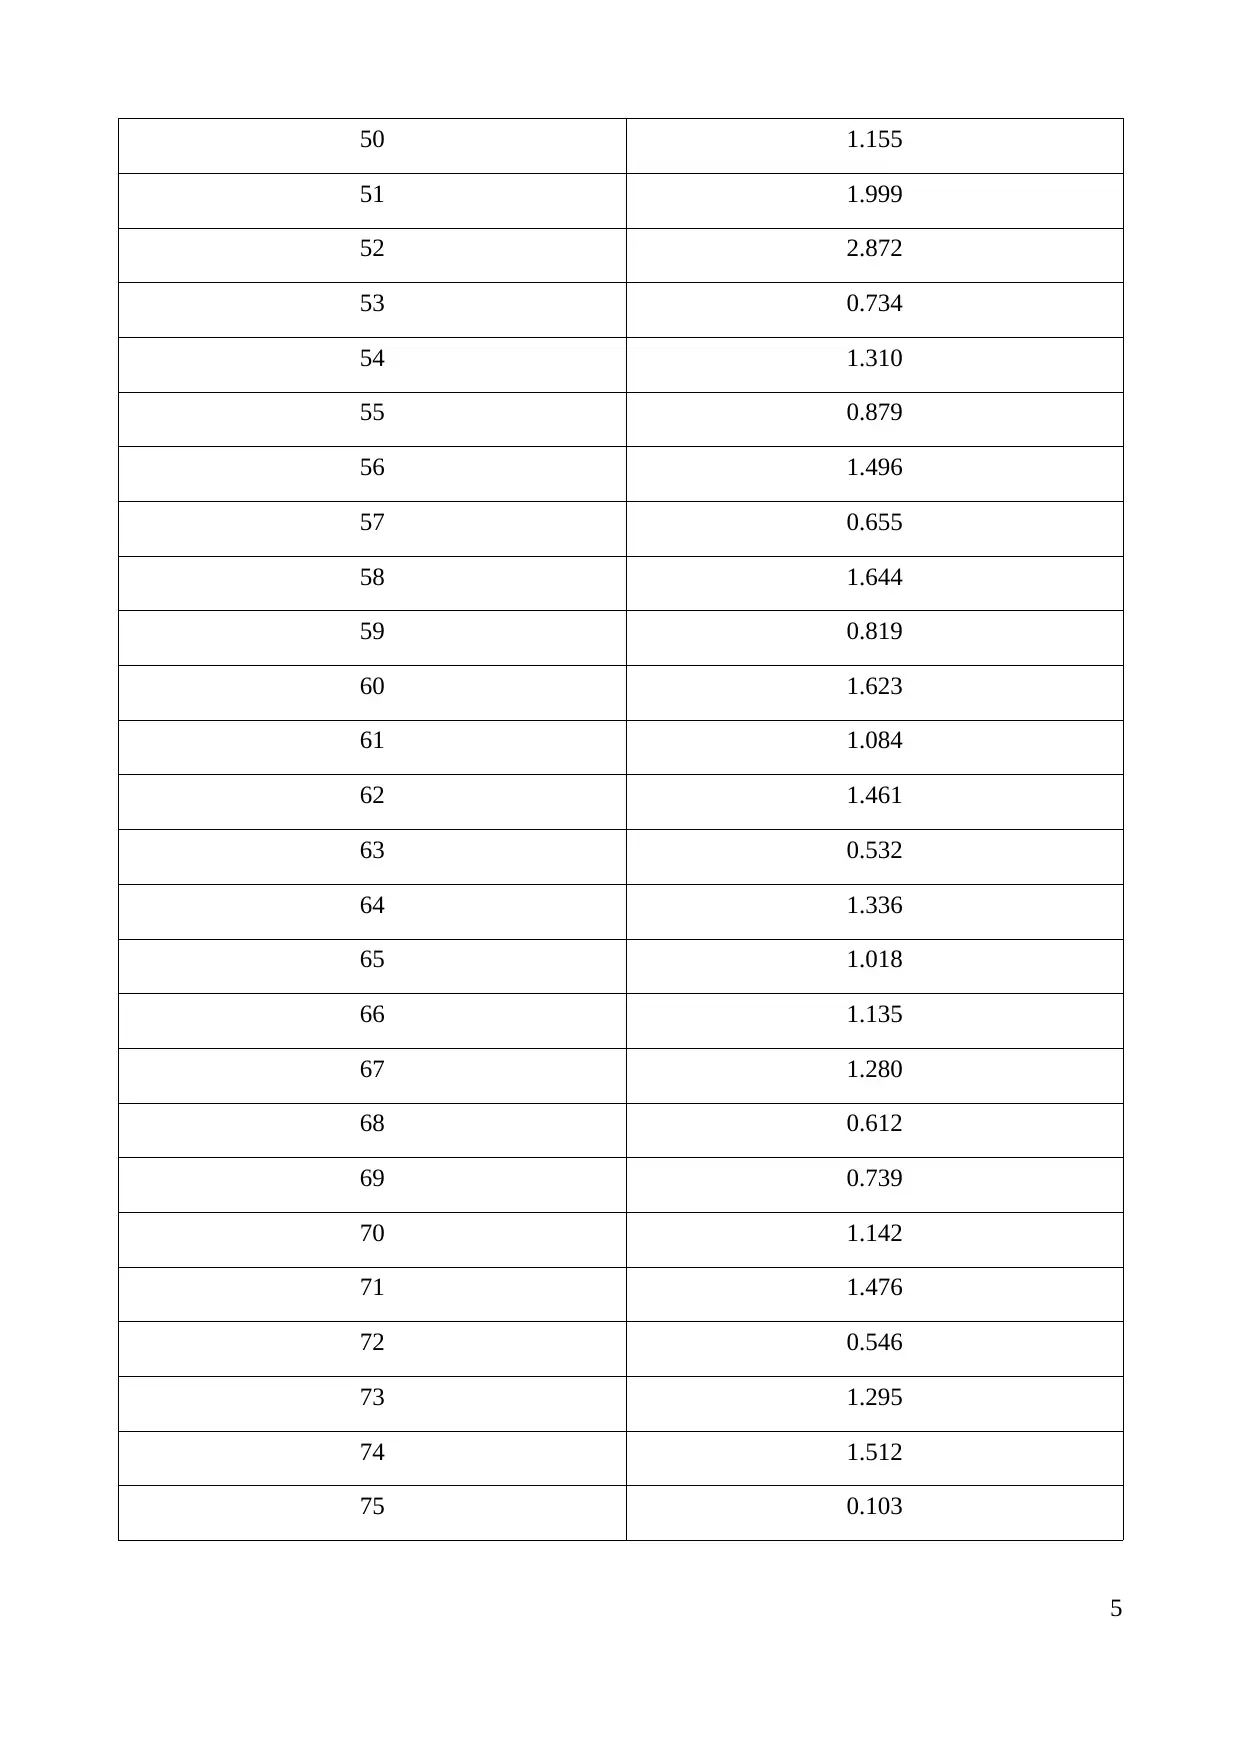
This assignment presents a comprehensive data analysis of KBS supermarket's performance. It begins with descriptive statistics of gross profit, including mean, median, standard deviation, and identifies unusual stores. The analysis extends to drafting frequency tables based on location (Country, Mall, Strip) and state, alongside a frequency table of online stores by state. Furthermore, the assignment delves into descriptive analysis of gross profit based on gender, comparing male and female-operated stores. The solution also tackles probability questions, including assessing proportions, calculating probabilities of events, and determining independence between income and political affiliation. Finally, it explores binomial distribution problems, calculating mean, standard deviation, and various probabilities related to advertisement recall. The assignment provides detailed calculations and interpretations to understand the supermarket's financial performance and customer behavior.

1 out of 18
Your All-in-One AI-Powered Toolkit for Academic Success.
+13062052269
info@desklib.com
Available 24*7 on WhatsApp / Email
![[object Object]](/_next/static/media/star-bottom.7253800d.svg)
Copyright © 2020–2026 A2Z Services. All Rights Reserved. Developed and managed by ZUCOL.