Kedison Plc & Chocco Plc: A Comprehensive Financial Analysis Report
VerifiedAdded on 2023/06/14
|11
|1668
|353
Homework Assignment
AI Summary
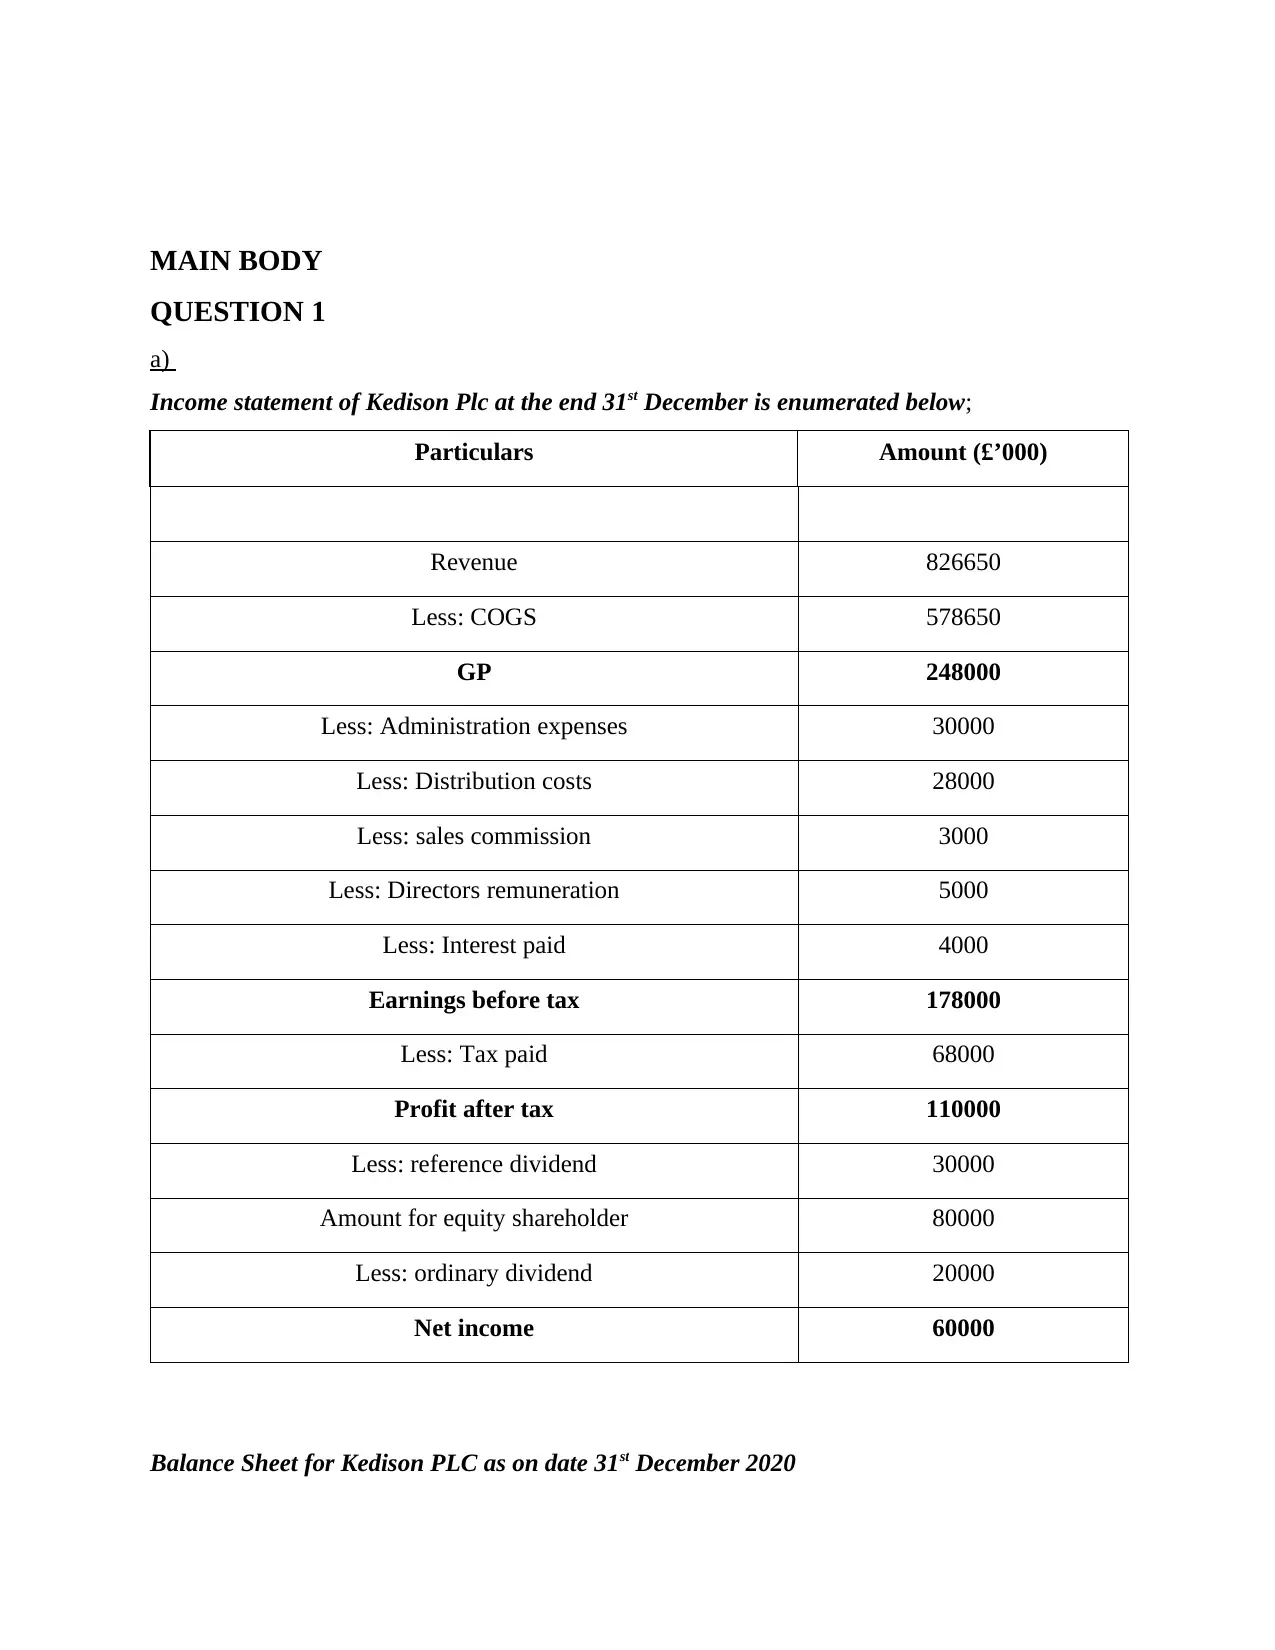
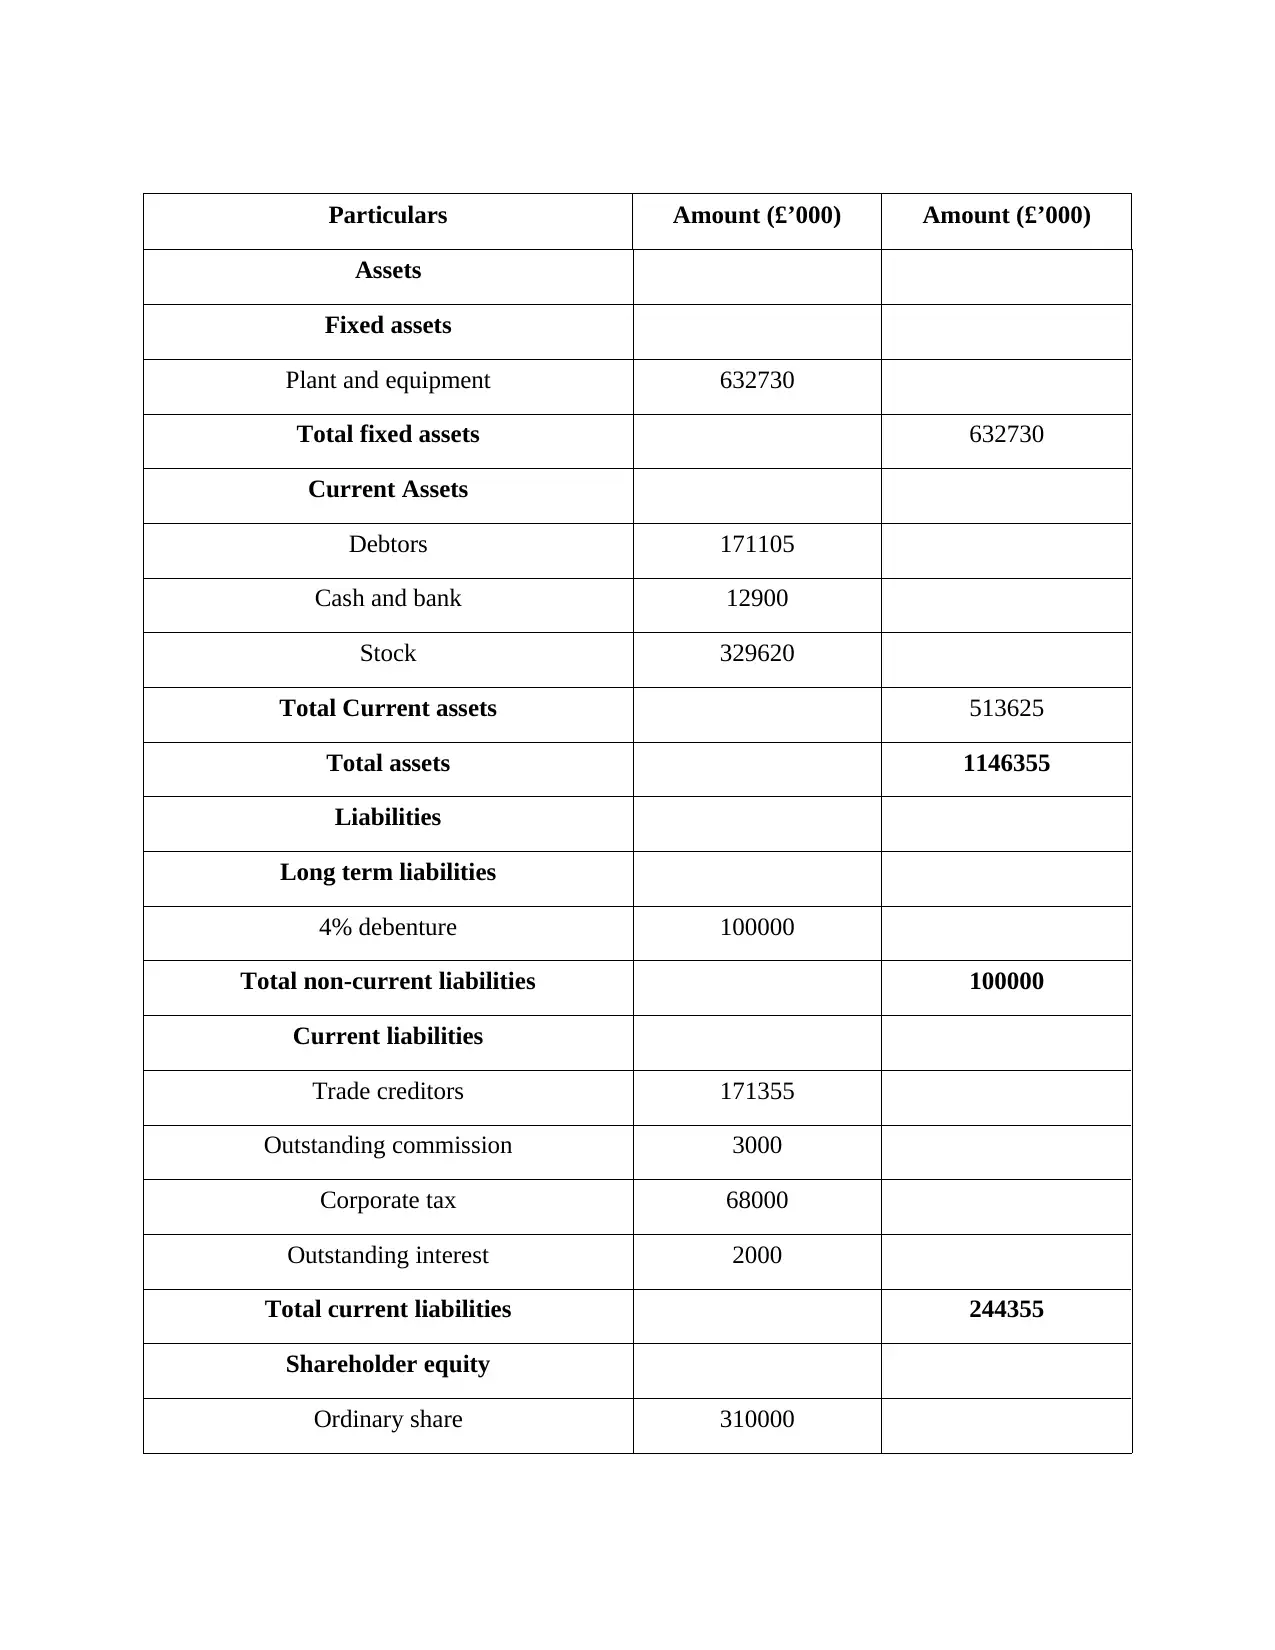
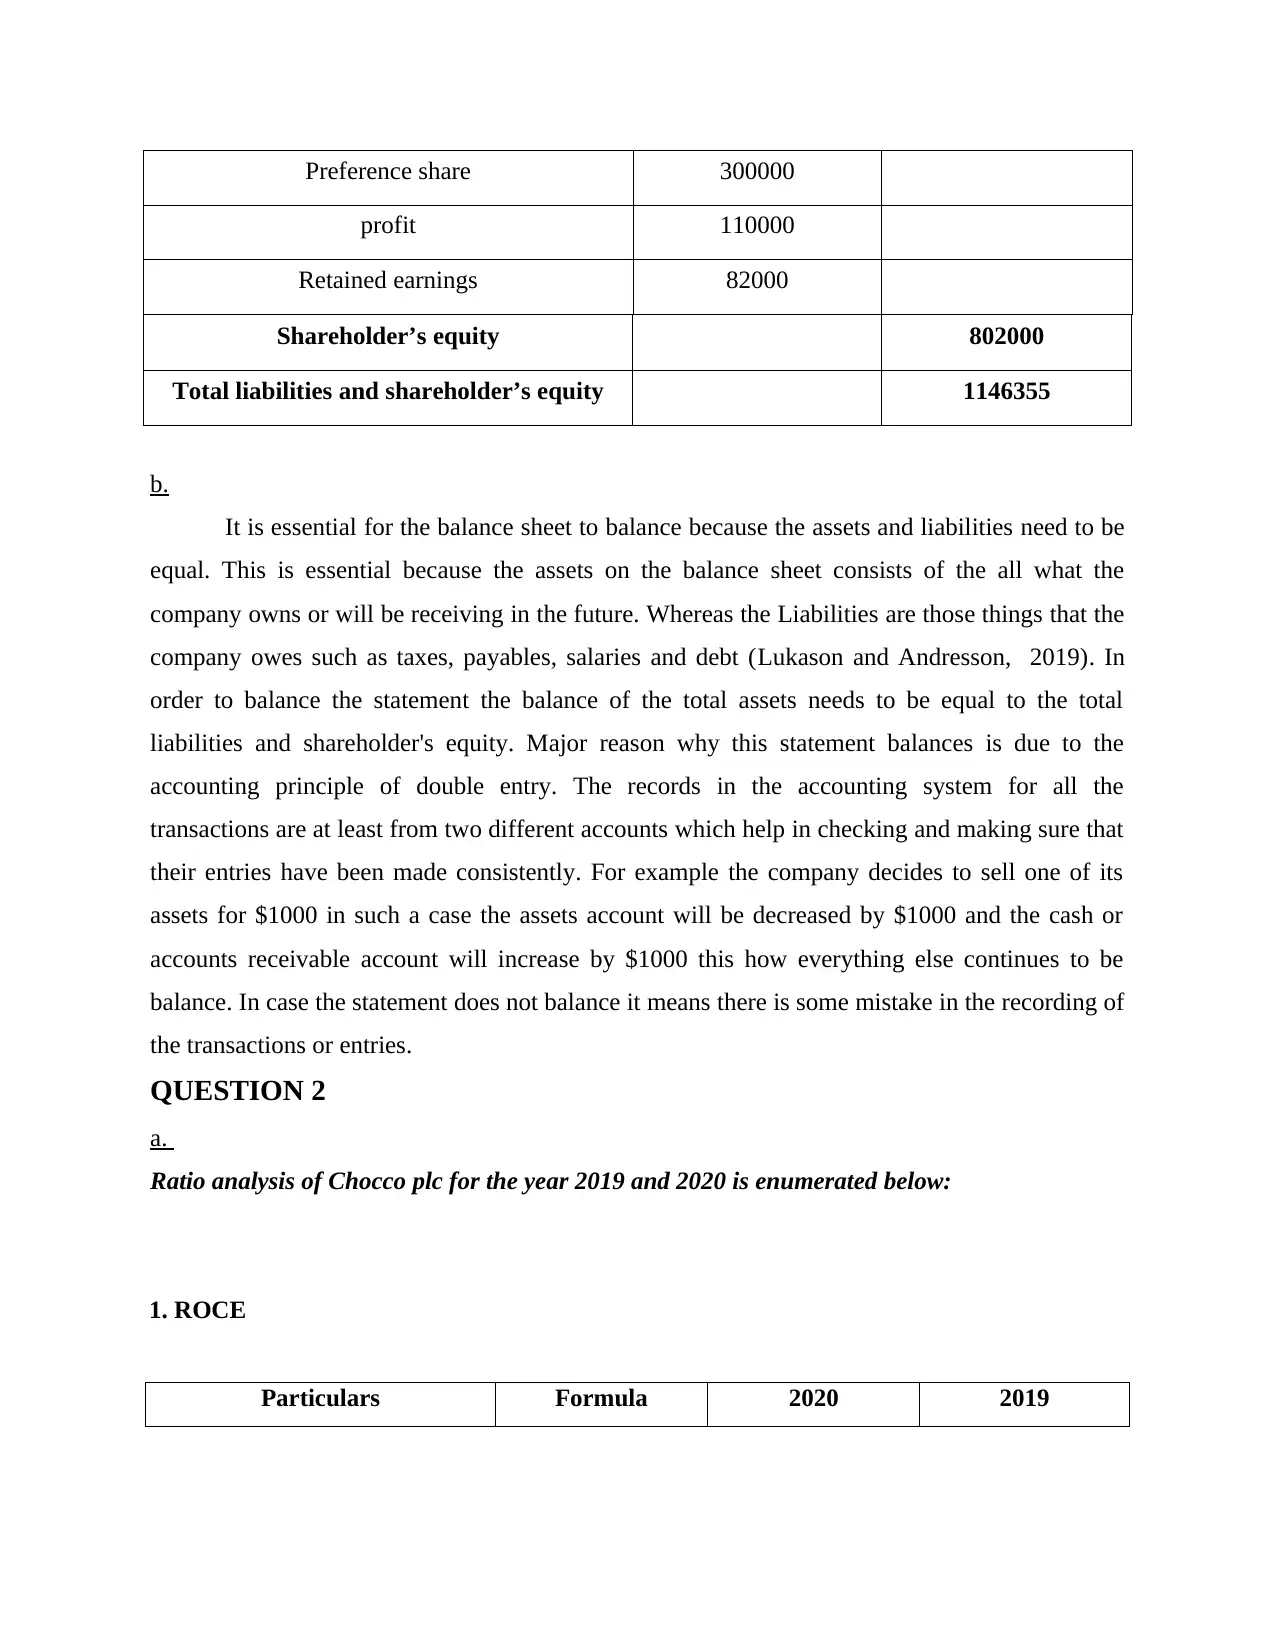
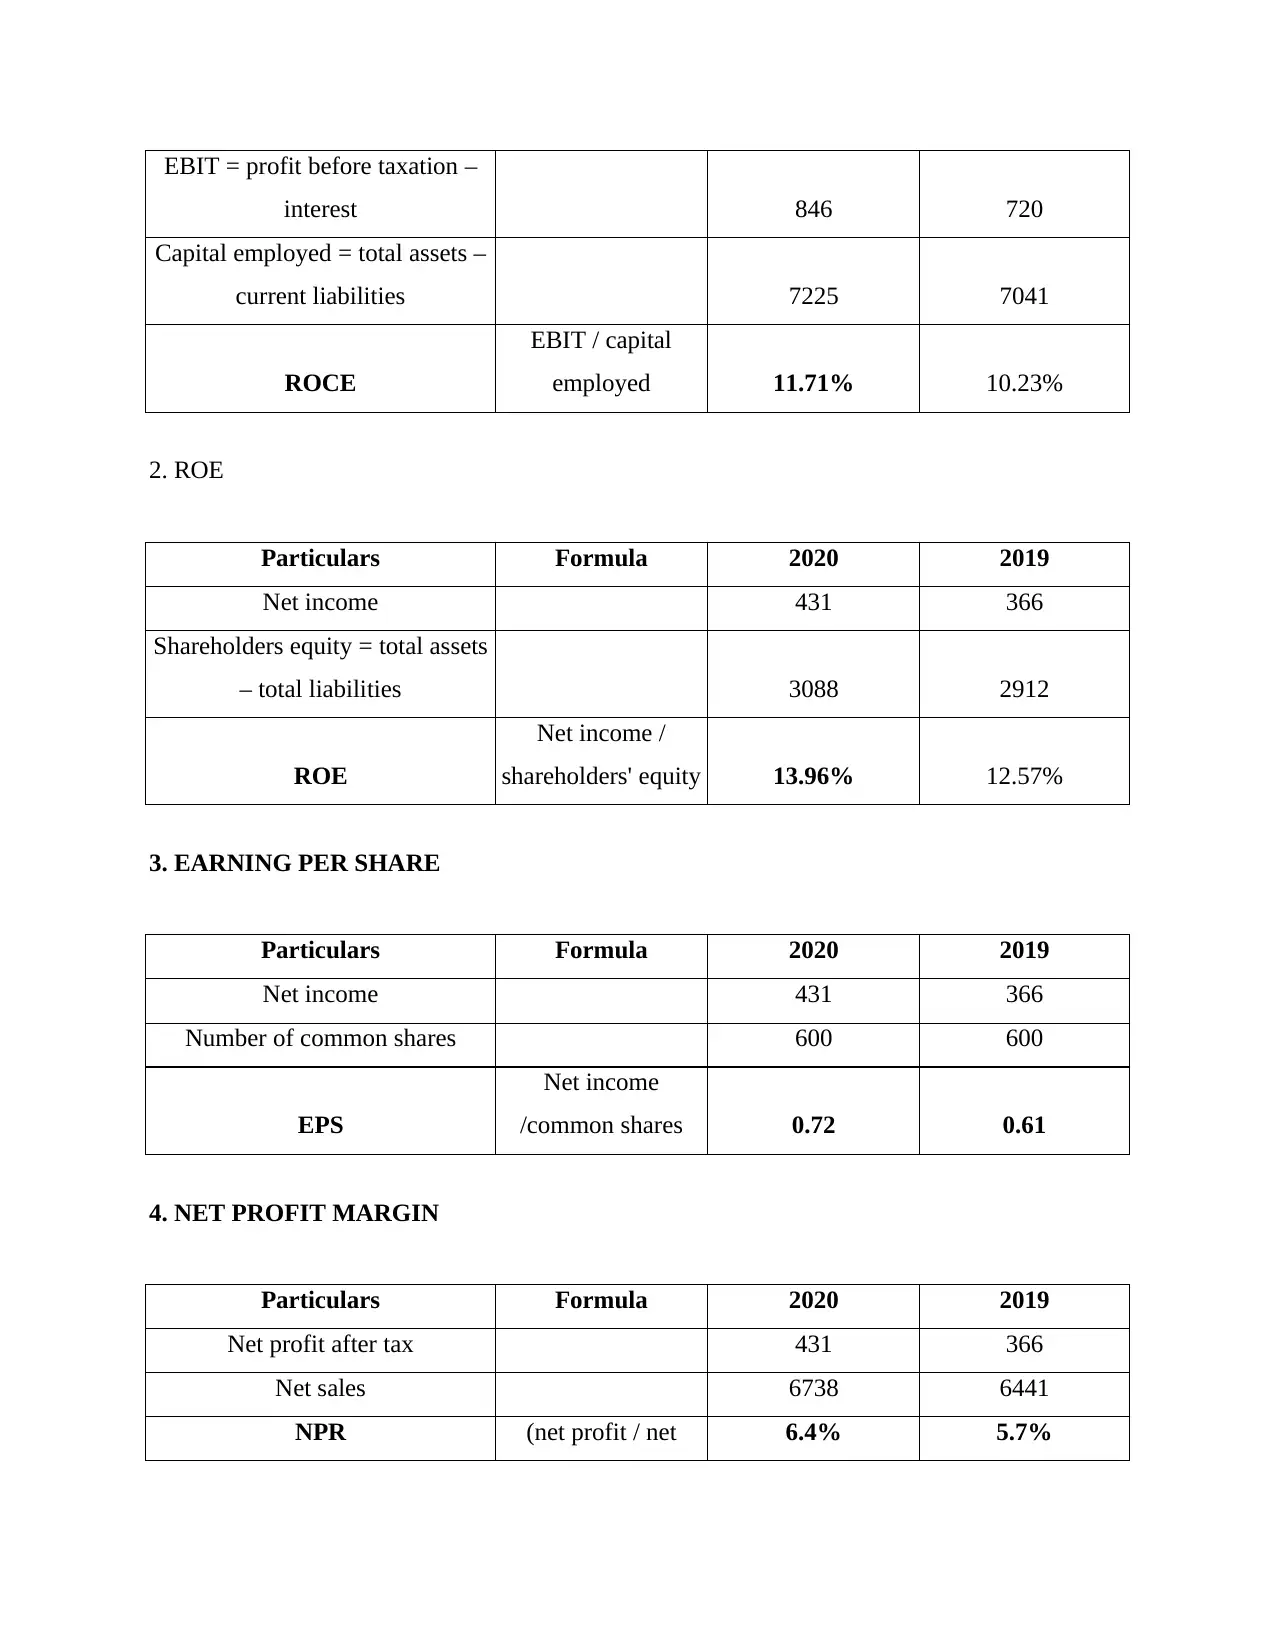
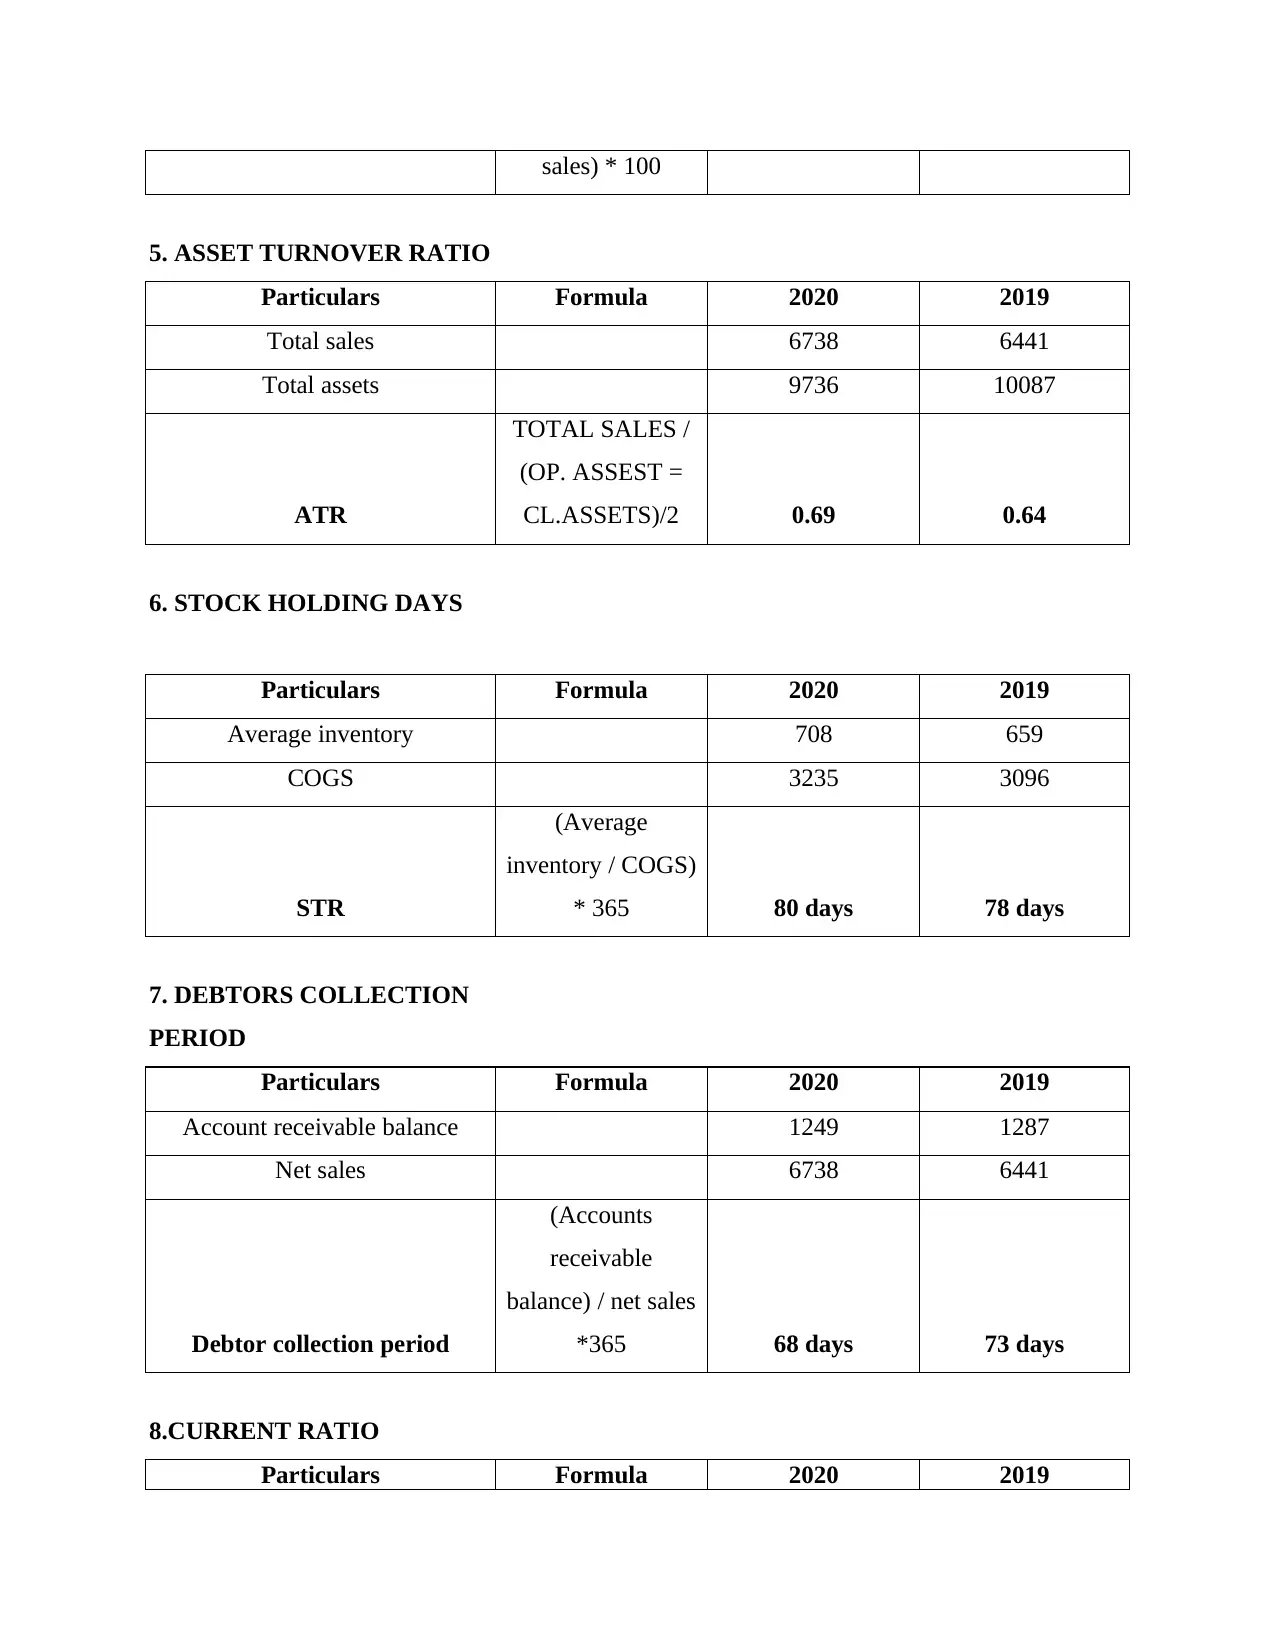
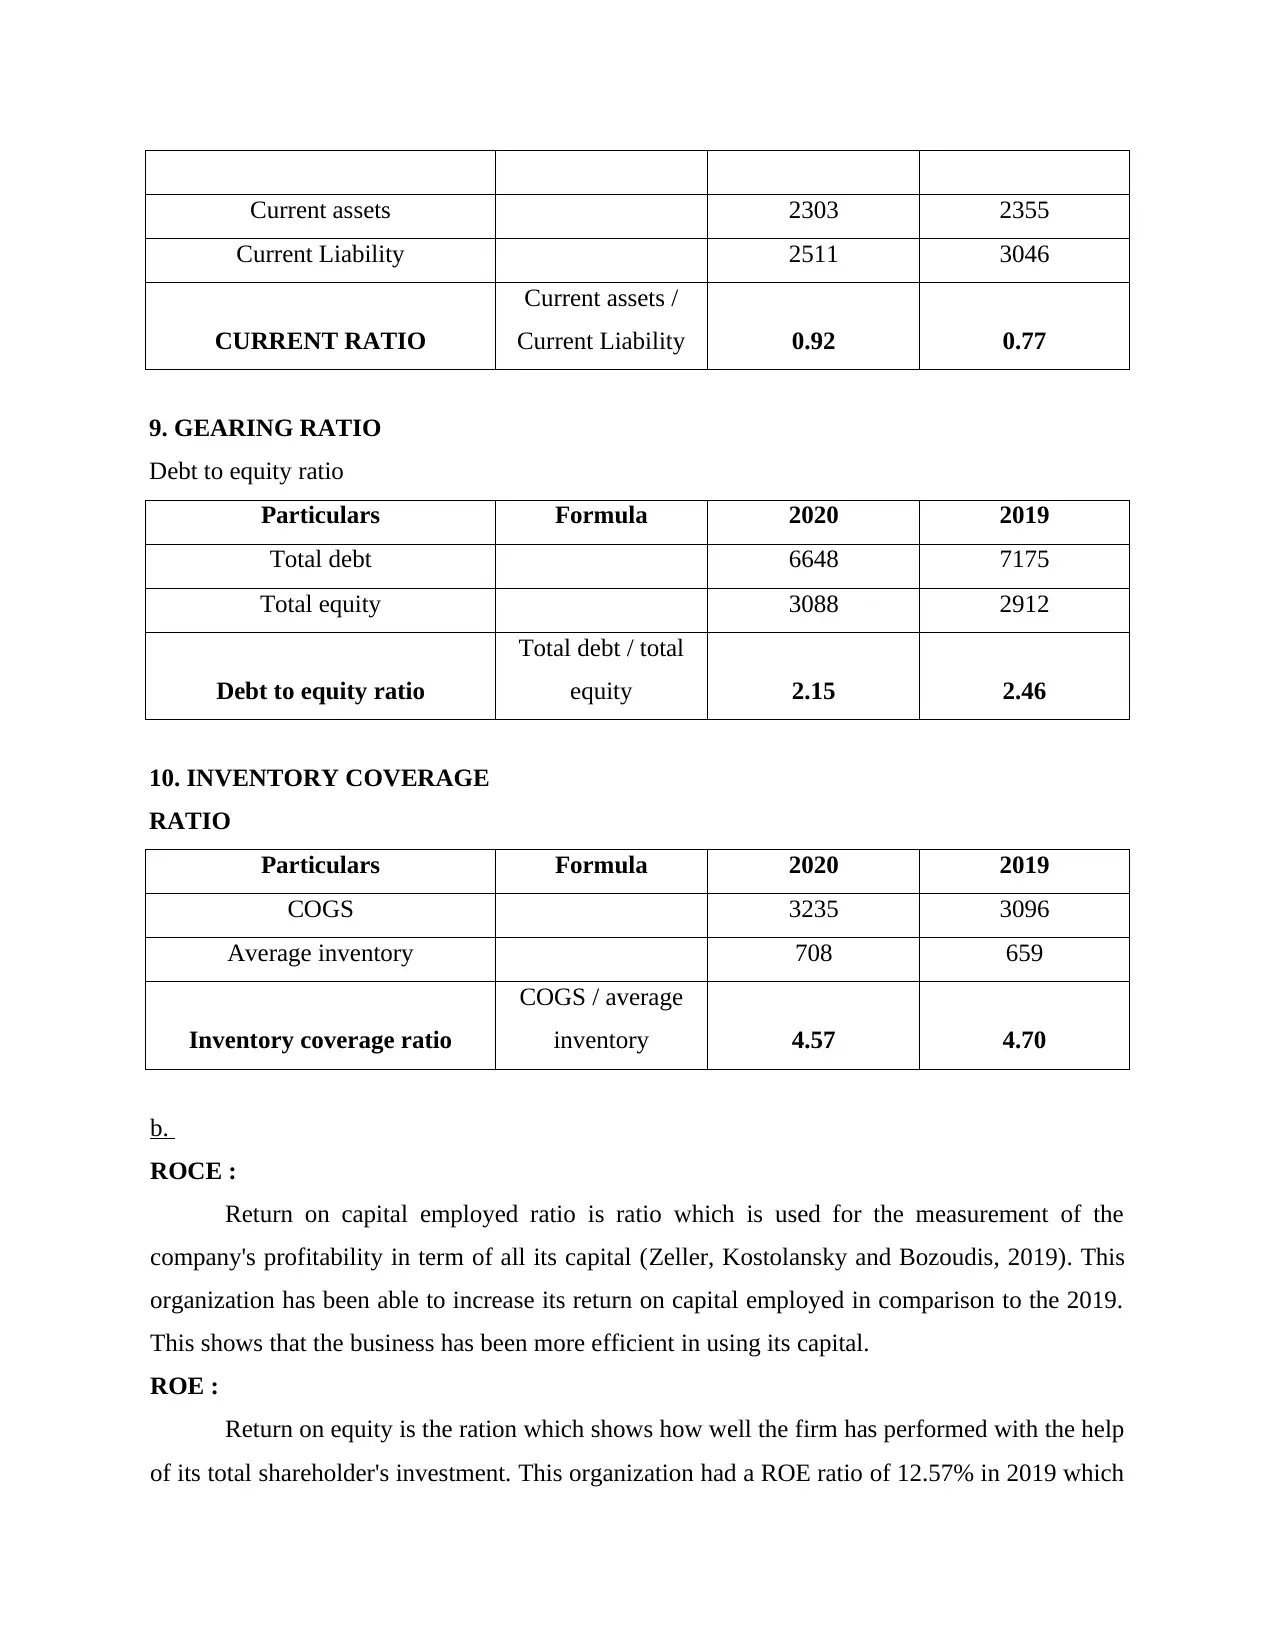
This assignment provides a comprehensive financial analysis of Kedison Plc and Chocco Plc. It includes the preparation of an income statement and balance sheet for Kedison Plc, along with an explanation of the importance of a balanced balance sheet. Furthermore, it conducts a detailed ratio analysis for Chocco Plc, covering key metrics such as ROCE, ROE, EPS, net profit margin, asset turnover ratio, stock holding days, debtors' collection period, current ratio, gearing ratio, and inventory coverage ratio. The analysis interprets these ratios to assess Chocco Plc's financial performance, highlighting areas of improvement and strengths. The assignment concludes with recommendations for enhancing the company's financial health, particularly focusing on inventory management to improve profitability and liquidity. Desklib provides access to similar solved assignments and past papers for students.
Contribute Materials
Your contribution can guide someone’s learning journey. Share your
documents today.

Fundamentals
Secure Best Marks with AI Grader
Need help grading? Try our AI Grader for instant feedback on your assignments.

TABLE OF CONTENTS
MAIN BODY...................................................................................................................................3
QUESTION 1...................................................................................................................................3
a) .................................................................................................................................................3
b....................................................................................................................................................4
QUESTION 2...................................................................................................................................5
a. ..................................................................................................................................................5
b. ..................................................................................................................................................7
CONCLUSION................................................................................................................................9
REFERENCES................................................................................................................................1

MAIN BODY
QUESTION 1
a)
Income statement of Kedison Plc at the end 31st December is enumerated below;
Particulars Amount (£’000)
Revenue 826650
Less: COGS 578650
GP 248000
Less: Administration expenses 30000
Less: Distribution costs 28000
Less: sales commission 3000
Less: Directors remuneration 5000
Less: Interest paid 4000
Earnings before tax 178000
Less: Tax paid 68000
Profit after tax 110000
Less: reference dividend 30000
Amount for equity shareholder 80000
Less: ordinary dividend 20000
Net income 60000
Balance Sheet for Kedison PLC as on date 31st December 2020

Particulars Amount (£’000) Amount (£’000)
Assets
Fixed assets
Plant and equipment 632730
Total fixed assets 632730
Current Assets
Debtors 171105
Cash and bank 12900
Stock 329620
Total Current assets 513625
Total assets 1146355
Liabilities
Long term liabilities
4% debenture 100000
Total non-current liabilities 100000
Current liabilities
Trade creditors 171355
Outstanding commission 3000
Corporate tax 68000
Outstanding interest 2000
Total current liabilities 244355
Shareholder equity
Ordinary share 310000
Secure Best Marks with AI Grader
Need help grading? Try our AI Grader for instant feedback on your assignments.

Preference share 300000
profit 110000
Retained earnings 82000
Shareholder’s equity 802000
Total liabilities and shareholder’s equity 1146355
b.
It is essential for the balance sheet to balance because the assets and liabilities need to be
equal. This is essential because the assets on the balance sheet consists of the all what the
company owns or will be receiving in the future. Whereas the Liabilities are those things that the
company owes such as taxes, payables, salaries and debt (Lukason and Andresson, 2019). In
order to balance the statement the balance of the total assets needs to be equal to the total
liabilities and shareholder's equity. Major reason why this statement balances is due to the
accounting principle of double entry. The records in the accounting system for all the
transactions are at least from two different accounts which help in checking and making sure that
their entries have been made consistently. For example the company decides to sell one of its
assets for $1000 in such a case the assets account will be decreased by $1000 and the cash or
accounts receivable account will increase by $1000 this how everything else continues to be
balance. In case the statement does not balance it means there is some mistake in the recording of
the transactions or entries.
QUESTION 2
a.
Ratio analysis of Chocco plc for the year 2019 and 2020 is enumerated below:
1. ROCE
Particulars Formula 2020 2019

EBIT = profit before taxation –
interest 846 720
Capital employed = total assets –
current liabilities 7225 7041
ROCE
EBIT / capital
employed 11.71% 10.23%
2. ROE
Particulars Formula 2020 2019
Net income 431 366
Shareholders equity = total assets
– total liabilities 3088 2912
ROE
Net income /
shareholders' equity 13.96% 12.57%
3. EARNING PER SHARE
Particulars Formula 2020 2019
Net income 431 366
Number of common shares 600 600
EPS
Net income
/common shares 0.72 0.61
4. NET PROFIT MARGIN
Particulars Formula 2020 2019
Net profit after tax 431 366
Net sales 6738 6441
NPR (net profit / net 6.4% 5.7%

sales) * 100
5. ASSET TURNOVER RATIO
Particulars Formula 2020 2019
Total sales 6738 6441
Total assets 9736 10087
ATR
TOTAL SALES /
(OP. ASSEST =
CL.ASSETS)/2 0.69 0.64
6. STOCK HOLDING DAYS
Particulars Formula 2020 2019
Average inventory 708 659
COGS 3235 3096
STR
(Average
inventory / COGS)
* 365 80 days 78 days
7. DEBTORS COLLECTION
PERIOD
Particulars Formula 2020 2019
Account receivable balance 1249 1287
Net sales 6738 6441
Debtor collection period
(Accounts
receivable
balance) / net sales
*365 68 days 73 days
8.CURRENT RATIO
Particulars Formula 2020 2019
Paraphrase This Document
Need a fresh take? Get an instant paraphrase of this document with our AI Paraphraser

Current assets 2303 2355
Current Liability 2511 3046
CURRENT RATIO
Current assets /
Current Liability 0.92 0.77
9. GEARING RATIO
Debt to equity ratio
Particulars Formula 2020 2019
Total debt 6648 7175
Total equity 3088 2912
Debt to equity ratio
Total debt / total
equity 2.15 2.46
10. INVENTORY COVERAGE
RATIO
Particulars Formula 2020 2019
COGS 3235 3096
Average inventory 708 659
Inventory coverage ratio
COGS / average
inventory 4.57 4.70
b.
ROCE :
Return on capital employed ratio is ratio which is used for the measurement of the
company's profitability in term of all its capital (Zeller, Kostolansky and Bozoudis, 2019). This
organization has been able to increase its return on capital employed in comparison to the 2019.
This shows that the business has been more efficient in using its capital.
ROE :
Return on equity is the ration which shows how well the firm has performed with the help
of its total shareholder's investment. This organization had a ROE ratio of 12.57% in 2019 which

now has increased to 13.96% this growth shows the increase in the performance that is
considered by the shareholders during investment.
EPS :
Earning per share is the ratio which indicates the profit which will be divided into each
share that the company has issued. The earning per share of Chocco plc has also increased which
shows an increase in the financial performance of the organization. This also indicates that the
business has been profitable.
Net profit margin :
This ratio is the measurement of how much profit the company has generated as a
percentage of revenue. This ratio shows the revenue of the company, which for this organization
has been higher than its previous performance. Showing the increase in the productivity and
performance.
Asset Turnover ratio :
This is the ratio which measures the efficiency of the company's assets that are generating
revenue and sales. Its comparison in shown as the annualized percentage which helps in the
calculation of efficiency of the organization in management of its assets. This ratio for Chocco
Plc is 0.69 in 2020 which has slightly increased from the past year. Therefore, it shows some
improvement however the organization needs to improve on its performance.
Stock Holding days :
This is the number of days that an organization takes for its inventory to turn into sales
(González and et.al., 2022). This shows how well the organization has managed its inventory
along with its sales. In comparison to 2019 the organization has been able to increase the stock
holding days with 2 days means that organization takes longer for the inventory to get sold. It is
bad for the company and it shows work on it.
Debtors Collection Period :
The average time taken for collecting the trade debts are considered to be the indicator to
the increase in efficiency. Having less debtor's collection period is good for the organization and
in comparison to 2019 the debtors collection period has fallen to 68 days.
Current Ratio :
Current ratio is the ratio which helps in the measurement of the company's ability to pay
short term debts which are due within that one year (Bordeianu and Radu, 2020). The idea

current ratio that a company can have is 2:1. However, this organization has very low current
ratio at 0.92 even though it is showing signs of increasing its still very low.
Gearing ratio :
The debt to equity ratio is the financial ratio which shows the comparison between the
owner's equity and debt. This helps in the measurement of financial leverage. The fact that the
gearing ratio has fallen for this organization from 2.46 to 2.15 is good as the gearing ration is
considered to be good if its is low.
Inventory coverage ratio :
This ratio is helpful for the determination of the excessive inventory levels in comparison
to the sales. This ratio has decreased showing fall in the performance of management of
inventory.
It can be said that this organization has been able to improve its performance in
comparison to its performance in 2019. This show increase in productivity and efficiency of the
organization. In order to improve its performance more the organization needs to focus on
management of the inventory as its stock turn over ratio has increased which is not a positive
sign. Management of the inventory will help the organization to improve its current ratio and be
able to decrease the cost of production. This will result in increase in profit of the organization.
Secure Best Marks with AI Grader
Need help grading? Try our AI Grader for instant feedback on your assignments.

REFERENCES
Books and journals
Bawa, J.K., and et.al., 2019. An analysis of NPAs of Indian banks: Using a comprehensive
framework of 31 financial ratios. IIMB Management Review. 31(1). pp.51-62.
Bordeianu, G.D. and Radu, F., 2020. Basic Types of Financial Ratios Used to Measure a
Company's Performance. Economy Transdisciplinarity Cognition. 23(2).
González, F.F., and et.al., 2022. Local energy businesses in the United Kingdom: Clusters and
localism determinants based on financial ratios. Energy. 239. p.122119.
Lukason, O. and Andresson, A., 2019. Tax arrears versus financial ratios in bankruptcy
prediction. Journal of Risk and Financial Management. 12(4). p.187.
Zeller, T., Kostolansky, J. and Bozoudis, M., 2019. An IFRS-based taxonomy of financial ratios.
Accounting Research Journal.
1
1 out of 11
Related Documents

Your All-in-One AI-Powered Toolkit for Academic Success.
+13062052269
info@desklib.com
Available 24*7 on WhatsApp / Email
Unlock your academic potential
© 2024 | Zucol Services PVT LTD | All rights reserved.