Kellogg's Business Analysis: Financial and Strategic Review
VerifiedAdded on 2021/02/20
|31
|6696
|43
Report
AI Summary
This business analysis report provides a comprehensive evaluation of Kellogg's, a major player in the consumer food manufacturing industry. The report begins with an introduction outlining the objectives and an overview of the organization, including comparisons with competitors like Post Holdings and General Mills. A detailed financial analysis is presented, including profitability, liquidity, leverage, and investor ratios, benchmarked against industry peers. Strategic analysis incorporates macro and micro environmental factors, key performance indicators, and the application of PESTEL, Porter's Five Forces, and Ansoff Matrix frameworks. The report proposes strategic recommendations for market penetration and development, and concludes with a discussion of limitations and overall findings. The report aims to assess Kellogg's market value and future prospects, providing insights into its financial status and strategic positioning.
Business Analysis Project
A study of Kelloggs in consumer food manufacture
A study of Kelloggs in consumer food manufacture
Paraphrase This Document
Need a fresh take? Get an instant paraphrase of this document with our AI Paraphraser

Table of Contents
INTRODUCTION...........................................................................................................................4
1.1 Report objective................................................................................................................4
1.2 Overview of Organisations...............................................................................................5
1.3 Current key issues and rationale for choosing the organisation.......................................5
2. Financial analysis including bench-marking...............................................................................6
2.1 Profitability Ratio.............................................................................................................6
2.2 Liquidity Ratio..................................................................................................................7
................................................................................................................................................9
2.3 Leverage Ratio..................................................................................................................9
2.4 Investors Ratio................................................................................................................10
3. Strategic analysis.......................................................................................................................14
3.1 Macro environmental analysis........................................................................................14
3.2 Micro environmental analysis........................................................................................16
3.3 Key performance indicator.............................................................................................19
4. Proposed strategy (2 for Kellogg)..............................................................................................21
4.1 Market penetration..........................................................................................................21
4.2 Market development.......................................................................................................22
5.1 Limitations of Strategic Analysis...................................................................................23
5.2 Limitations of PESTEL model.......................................................................................23
5.3 Limitations of Porter’s five forces..................................................................................24
6. Conclusions................................................................................................................................24
7.0 Recommendations modelling...................................................................................................25
REFERENCES..............................................................................................................................28
APPENDIX....................................................................................................................................29
Post Holdings Inc...........................................................................................................................31
⊘ This is a preview!⊘
Do you want full access?
Subscribe today to unlock all pages.
Trusted by 1+ million students worldwide
INTRODUCTION
In present business scenario, business analysis is consider to be a series of task, understanding
knowledge and techniques that are essentially needed to determine the complete need of business
and figure out the solution to number of problem faced during its functioning ( Business analysis,
2019). It might also be performance to understand the actual efficiency of business or can be
meaningful to serve as the basis for determining business needs. In recent time, the technology is
modifying day by day which enables companies to adopt the best suitable and gain competition
advantage.
In this report, loading consumer food manufacture company Kellogg's have been selected in
order to analyse the performance of business operation by considering, competition, market
value, position etc. In addition to complete financial analysis various ratio have been calculated
and presented with help of graph. Report also discuss using PESTEL, Porter 5 forces and Ansoff
Matrix to determine the issue of business in context to company. Limitation and interpretation of
financial analyses have been performed.
1.1 Report objective.
The major objective of this particular assignment is to examine the performance Kellogg's and
ascertain its actual market value with respect to possible changes in nearby future. The report
prepared to identify the financial status of Kellogg's by evaluating financial ratios.
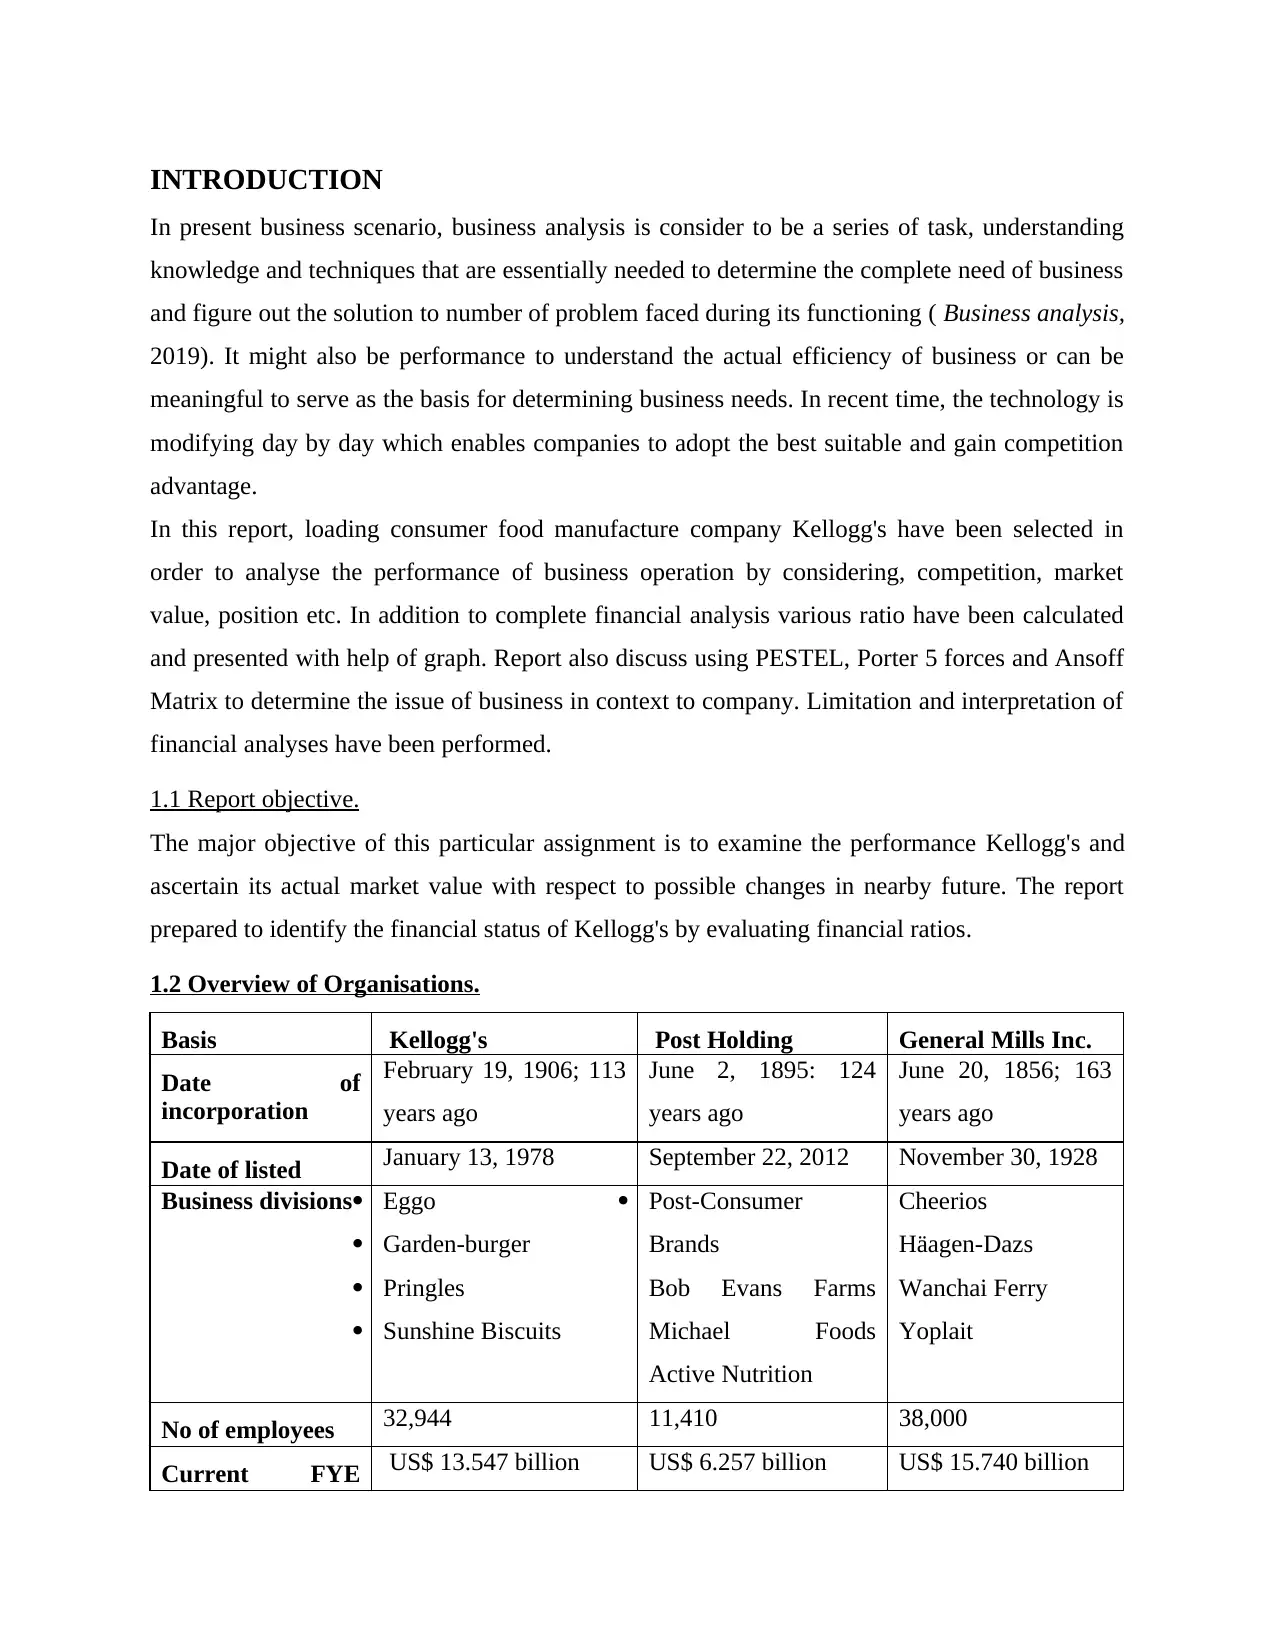
1.2 Overview of Organisations.
Basis Kellogg's Post Holding General Mills Inc.
Date of
incorporation
February 19, 1906; 113
years ago
June 2, 1895: 124
years ago
June 20, 1856; 163
years ago
Date of listed January 13, 1978 September 22, 2012 November 30, 1928
Business divisions Eggo
Garden-burger
Pringles
Sunshine Biscuits
Post-Consumer
Brands
Bob Evans Farms
Michael Foods
Active Nutrition
Cheerios
Häagen-Dazs
Wanchai Ferry
Yoplait
No of employees 32,944 11,410 38,000
Current FYE US$ 13.547 billion US$ 6.257 billion US$ 15.740 billion
In present business scenario, business analysis is consider to be a series of task, understanding
knowledge and techniques that are essentially needed to determine the complete need of business
and figure out the solution to number of problem faced during its functioning ( Business analysis,
2019). It might also be performance to understand the actual efficiency of business or can be
meaningful to serve as the basis for determining business needs. In recent time, the technology is
modifying day by day which enables companies to adopt the best suitable and gain competition
advantage.
In this report, loading consumer food manufacture company Kellogg's have been selected in
order to analyse the performance of business operation by considering, competition, market
value, position etc. In addition to complete financial analysis various ratio have been calculated
and presented with help of graph. Report also discuss using PESTEL, Porter 5 forces and Ansoff
Matrix to determine the issue of business in context to company. Limitation and interpretation of
financial analyses have been performed.
1.1 Report objective.
The major objective of this particular assignment is to examine the performance Kellogg's and
ascertain its actual market value with respect to possible changes in nearby future. The report
prepared to identify the financial status of Kellogg's by evaluating financial ratios.
1.2 Overview of Organisations.
Basis Kellogg's Post Holding General Mills Inc.
Date of
incorporation
February 19, 1906; 113
years ago
June 2, 1895: 124
years ago
June 20, 1856; 163
years ago
Date of listed January 13, 1978 September 22, 2012 November 30, 1928
Business divisions Eggo
Garden-burger
Pringles
Sunshine Biscuits
Post-Consumer
Brands
Bob Evans Farms
Michael Foods
Active Nutrition
Cheerios
Häagen-Dazs
Wanchai Ferry
Yoplait
No of employees 32,944 11,410 38,000
Current FYE US$ 13.547 billion US$ 6.257 billion US$ 15.740 billion
Paraphrase This Document
Need a fresh take? Get an instant paraphrase of this document with our AI Paraphraser
revenue
Current position
in the market
19.252B (Approx) 8.118B (Approx) 31.579B (Approx)
Logo
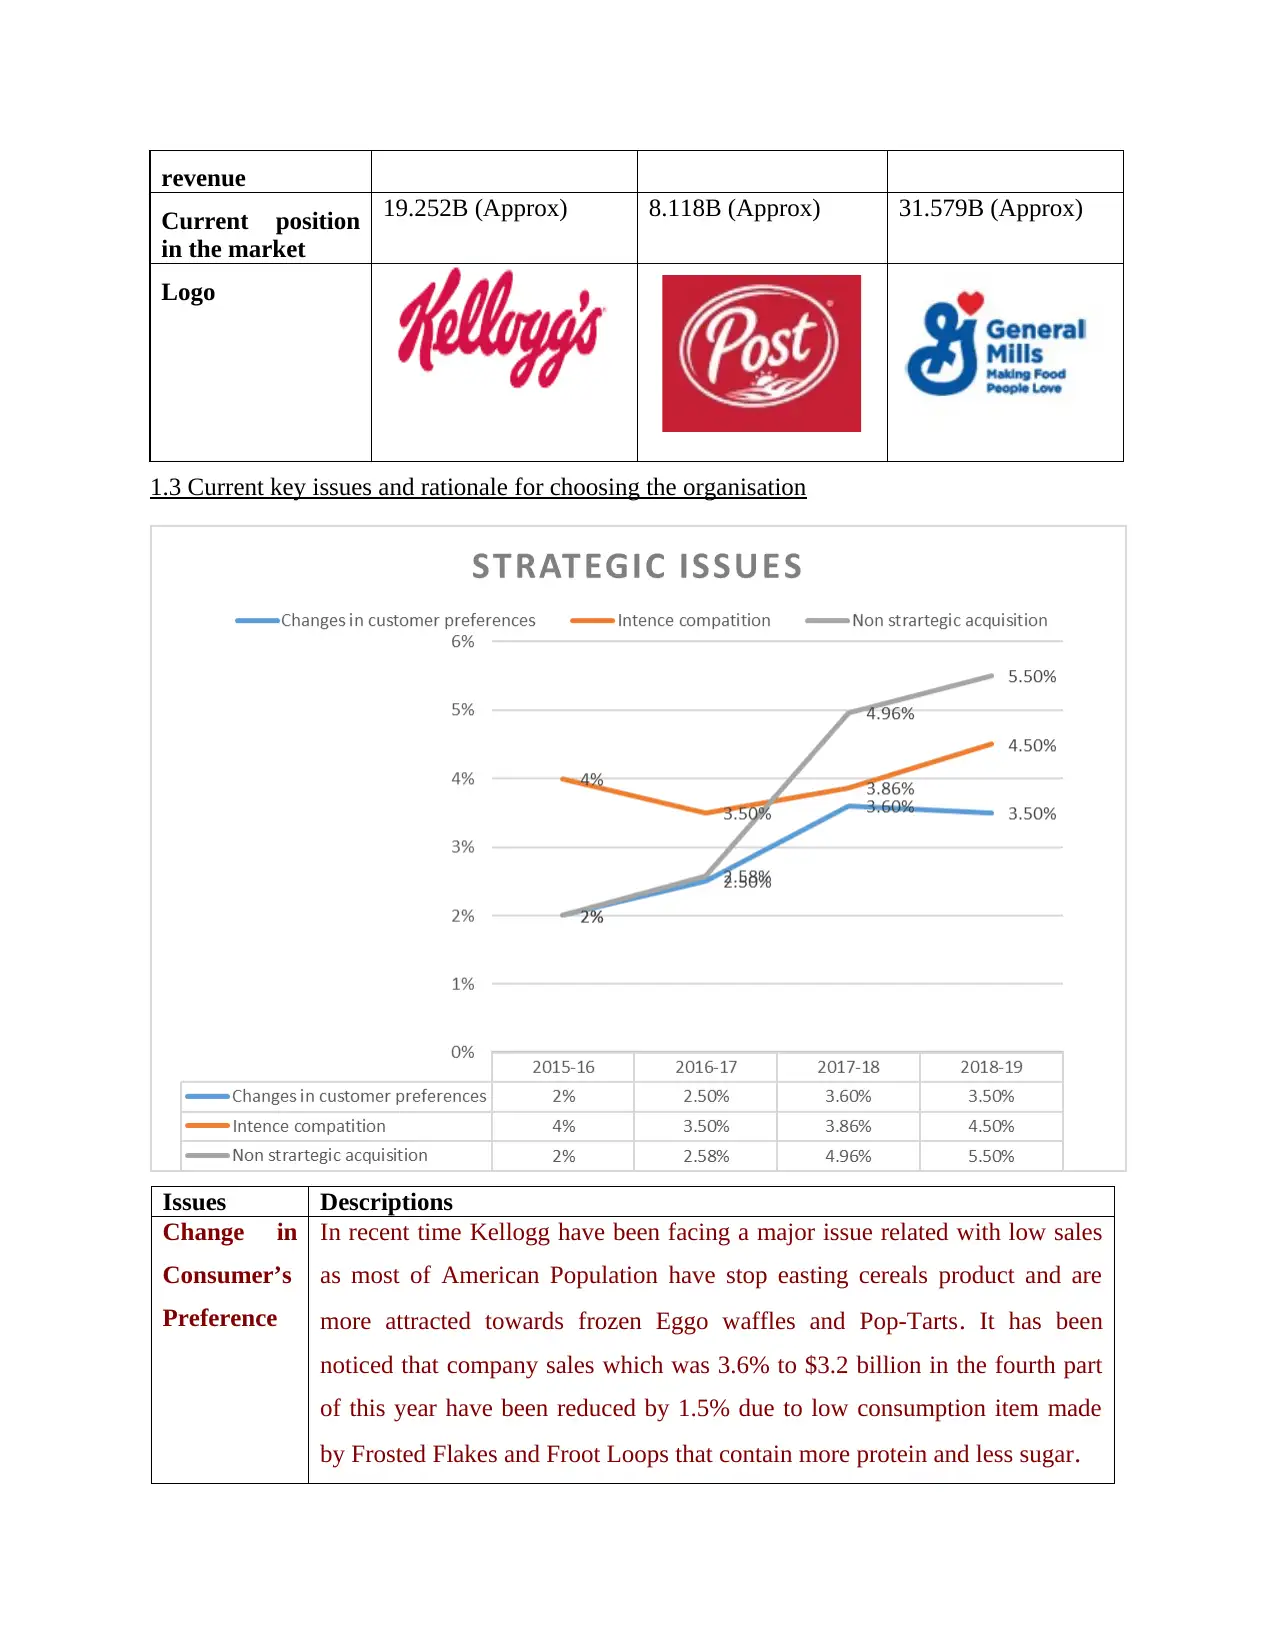
1.3 Current key issues and rationale for choosing the organisation
Issues Descriptions
Change in
Consumer’s
Preference
In recent time Kellogg have been facing a major issue related with low sales
as most of American Population have stop easting cereals product and are
more attracted towards frozen Eggo waffles and Pop-Tarts. It has been
noticed that company sales which was 3.6% to $3.2 billion in the fourth part
of this year have been reduced by 1.5% due to low consumption item made
by Frosted Flakes and Froot Loops that contain more protein and less sugar.
Current position
in the market
19.252B (Approx) 8.118B (Approx) 31.579B (Approx)
Logo
1.3 Current key issues and rationale for choosing the organisation
Issues Descriptions
Change in
Consumer’s
Preference
In recent time Kellogg have been facing a major issue related with low sales
as most of American Population have stop easting cereals product and are
more attracted towards frozen Eggo waffles and Pop-Tarts. It has been
noticed that company sales which was 3.6% to $3.2 billion in the fourth part
of this year have been reduced by 1.5% due to low consumption item made
by Frosted Flakes and Froot Loops that contain more protein and less sugar.
At the other side, customers who tend to consume at home are reinventing
warm food such as peanut butter and eggs, up 3.5% in revenues during the
first quarter of 2015 and 7% in revenues in 2016, alternately.
Intense
Competition
Kellogg had also faced huge competition from other companies such as Post
Holding and General Mills Inc. Despite customer desires for healthier snacks
and meal options, Kellogg's bought Pringles, which is renowned for
producing junk food, struggled to tackle customer trend and requirement. In
the meantime, General Mills took full advantage of enhanced yogurt demand
and bought Yoplait, the second biggest yogurt producer in the world.
Non-
strategic
acquisition
Kellogg struggled to tackle customer trend and request, amid customer
preferences for healthier meals and cereal options, Kellogg bought Pringles,
renowned for its unhealthy sweets manufacturing, while General Mills
grabbed benefit of enhanced yogurt supply and bought Yoplait, the market in
the world-largest yogurt producer.
Rationale for choosing the organisation
In business world companies faces number of problem due to which its performance gets
impacted and profit margin also reduces. The reasons behind selecting Kellogg is one of the most
trusted company in US that is consistently providing valuable goods to large number of
customers at domestic and international market. Company have effective plans and strategies
that enables to attain the competitive advantage (Bryman and Bell, 2015).
2. Financial analysis including bench-marking.
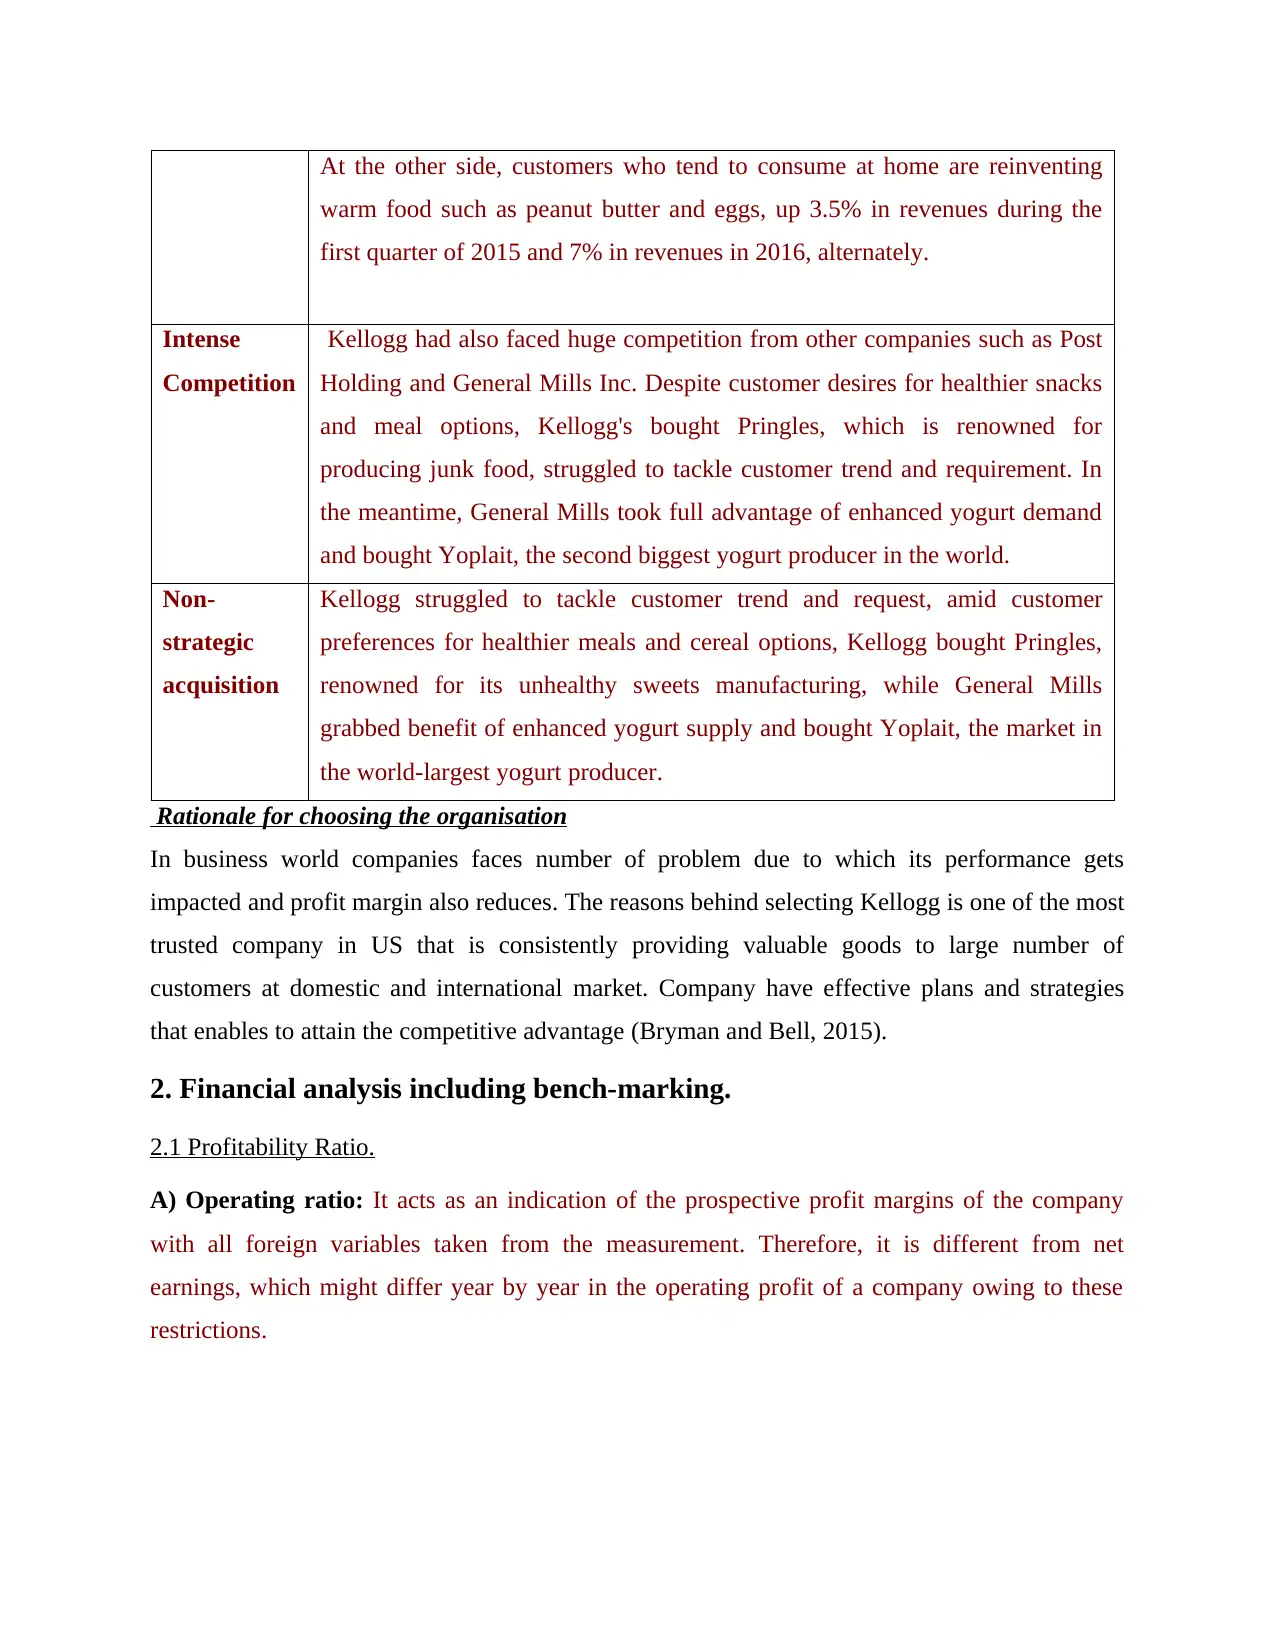
2.1 Profitability Ratio.
A) Operating ratio: It acts as an indication of the prospective profit margins of the company
with all foreign variables taken from the measurement. Therefore, it is different from net
earnings, which might differ year by year in the operating profit of a company owing to these
restrictions.
warm food such as peanut butter and eggs, up 3.5% in revenues during the
first quarter of 2015 and 7% in revenues in 2016, alternately.
Intense
Competition
Kellogg had also faced huge competition from other companies such as Post
Holding and General Mills Inc. Despite customer desires for healthier snacks
and meal options, Kellogg's bought Pringles, which is renowned for
producing junk food, struggled to tackle customer trend and requirement. In
the meantime, General Mills took full advantage of enhanced yogurt demand
and bought Yoplait, the second biggest yogurt producer in the world.
Non-
strategic
acquisition
Kellogg struggled to tackle customer trend and request, amid customer
preferences for healthier meals and cereal options, Kellogg bought Pringles,
renowned for its unhealthy sweets manufacturing, while General Mills
grabbed benefit of enhanced yogurt supply and bought Yoplait, the market in
the world-largest yogurt producer.
Rationale for choosing the organisation
In business world companies faces number of problem due to which its performance gets
impacted and profit margin also reduces. The reasons behind selecting Kellogg is one of the most
trusted company in US that is consistently providing valuable goods to large number of
customers at domestic and international market. Company have effective plans and strategies
that enables to attain the competitive advantage (Bryman and Bell, 2015).
2. Financial analysis including bench-marking.
2.1 Profitability Ratio.
A) Operating ratio: It acts as an indication of the prospective profit margins of the company
with all foreign variables taken from the measurement. Therefore, it is different from net
earnings, which might differ year by year in the operating profit of a company owing to these
restrictions.
⊘ This is a preview!⊘
Do you want full access?
Subscribe today to unlock all pages.
Trusted by 1+ million students worldwide
2 0 1 8 -1 2
2 0 1 7 -1 2
2 0 1 6 -1 2
051 01 52 0
1 2 .5 9 1 5 .0 6
1 0 .7 2
1 6 .9 9 1 7 .6 9 1 6 .3 7
1 1 .3 9 1 0 .4 6 1 0 .8 6
O p e r a ti n g m a r g i n
K ellog s G en eral Mills In c Pos t H old in g s In c
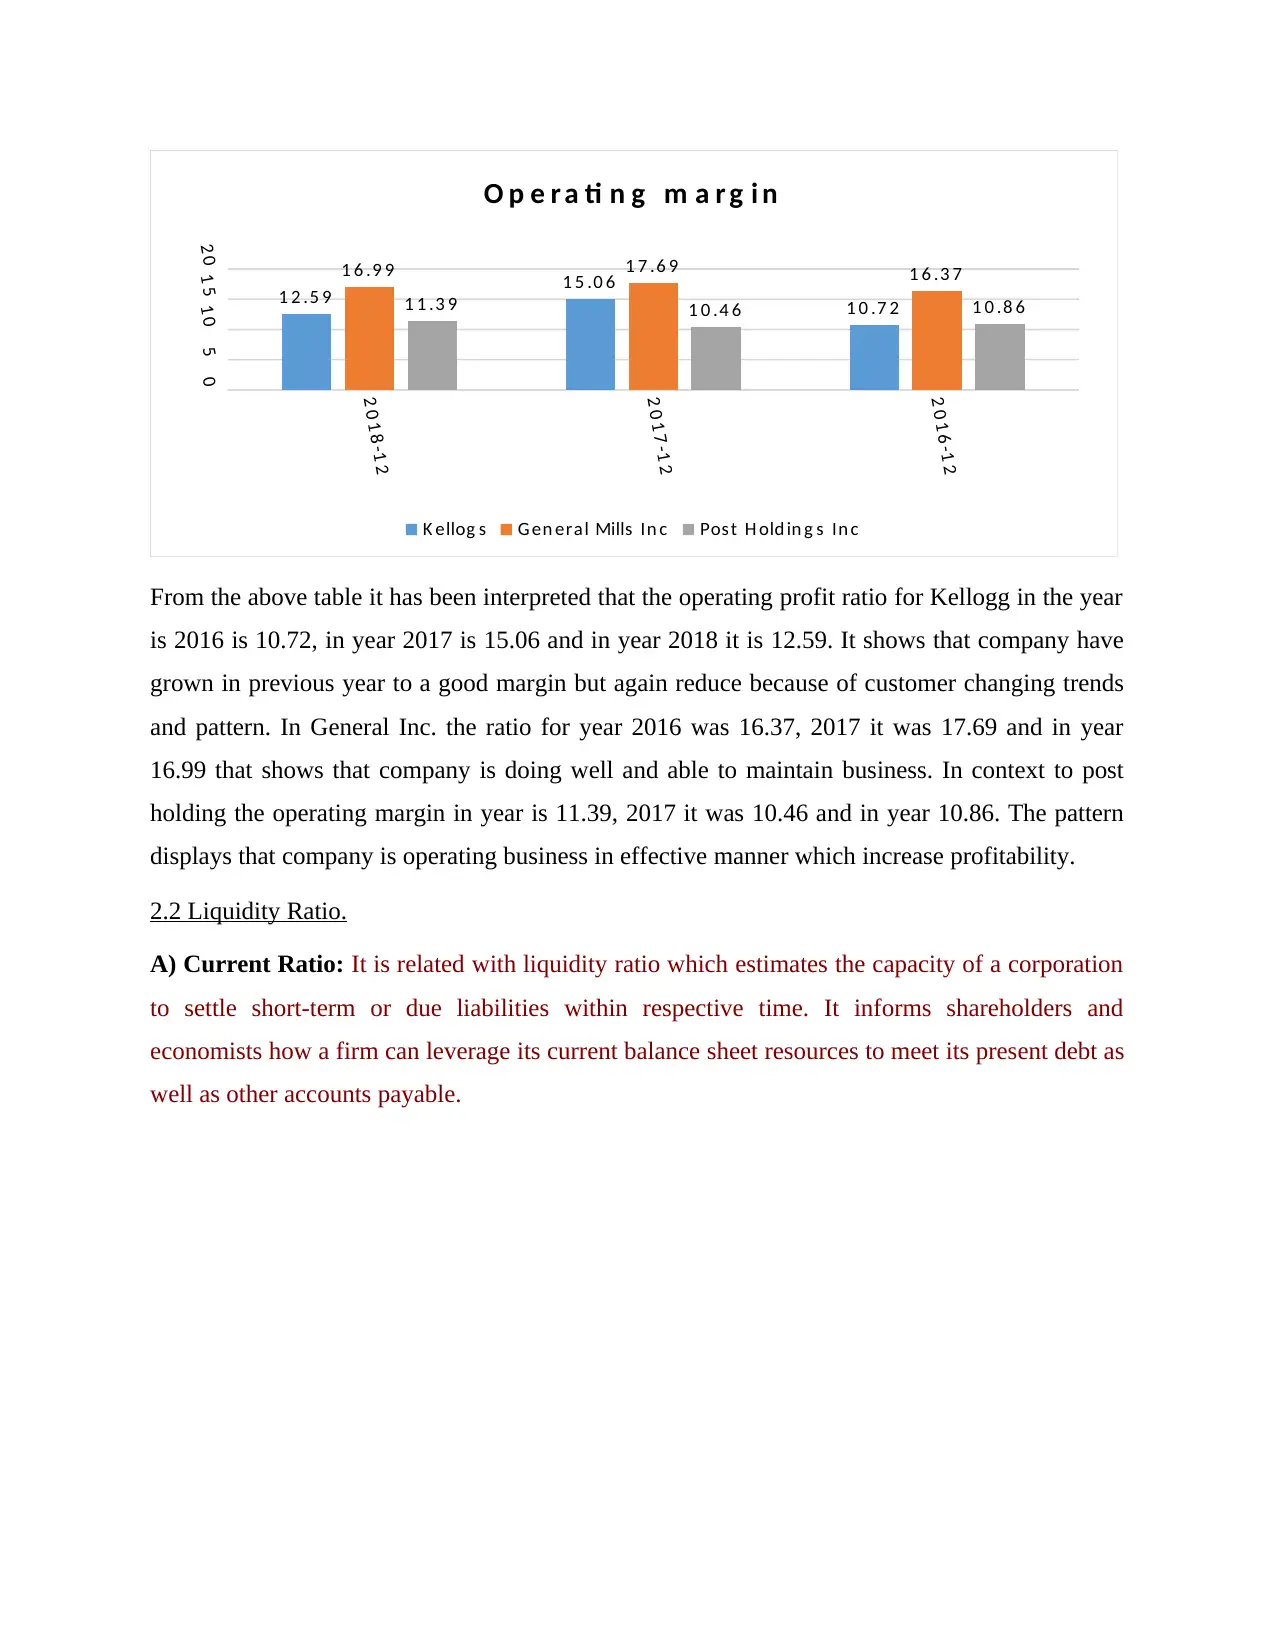
From the above table it has been interpreted that the operating profit ratio for Kellogg in the year
is 2016 is 10.72, in year 2017 is 15.06 and in year 2018 it is 12.59. It shows that company have
grown in previous year to a good margin but again reduce because of customer changing trends
and pattern. In General Inc. the ratio for year 2016 was 16.37, 2017 it was 17.69 and in year
16.99 that shows that company is doing well and able to maintain business. In context to post
holding the operating margin in year is 11.39, 2017 it was 10.46 and in year 10.86. The pattern
displays that company is operating business in effective manner which increase profitability.
2.2 Liquidity Ratio.
A) Current Ratio: It is related with liquidity ratio which estimates the capacity of a corporation
to settle short-term or due liabilities within respective time. It informs shareholders and
economists how a firm can leverage its current balance sheet resources to meet its present debt as
well as other accounts payable.
2 0 1 7 -1 2
2 0 1 6 -1 2
051 01 52 0
1 2 .5 9 1 5 .0 6
1 0 .7 2
1 6 .9 9 1 7 .6 9 1 6 .3 7
1 1 .3 9 1 0 .4 6 1 0 .8 6
O p e r a ti n g m a r g i n
K ellog s G en eral Mills In c Pos t H old in g s In c
From the above table it has been interpreted that the operating profit ratio for Kellogg in the year
is 2016 is 10.72, in year 2017 is 15.06 and in year 2018 it is 12.59. It shows that company have
grown in previous year to a good margin but again reduce because of customer changing trends
and pattern. In General Inc. the ratio for year 2016 was 16.37, 2017 it was 17.69 and in year
16.99 that shows that company is doing well and able to maintain business. In context to post
holding the operating margin in year is 11.39, 2017 it was 10.46 and in year 10.86. The pattern
displays that company is operating business in effective manner which increase profitability.
2.2 Liquidity Ratio.
A) Current Ratio: It is related with liquidity ratio which estimates the capacity of a corporation
to settle short-term or due liabilities within respective time. It informs shareholders and
economists how a firm can leverage its current balance sheet resources to meet its present debt as
well as other accounts payable.
Paraphrase This Document
Need a fresh take? Get an instant paraphrase of this document with our AI Paraphraser
2 0 1 8 -1 2
2 0 1 7 -1 2
2 0 1 6 -1 2 0
0 .5
1
1 .5
2
2 .5
3
3 .5
4
0 .7
0 .6 8
0 .6 6
0 .5 6
0 .7 6
0 .7 9
2 .7 8
3 .7 1
3 .2 8
C u r r e n t r a ti o
K ellog s G en era l Mills In c Pos t H old in g s In c
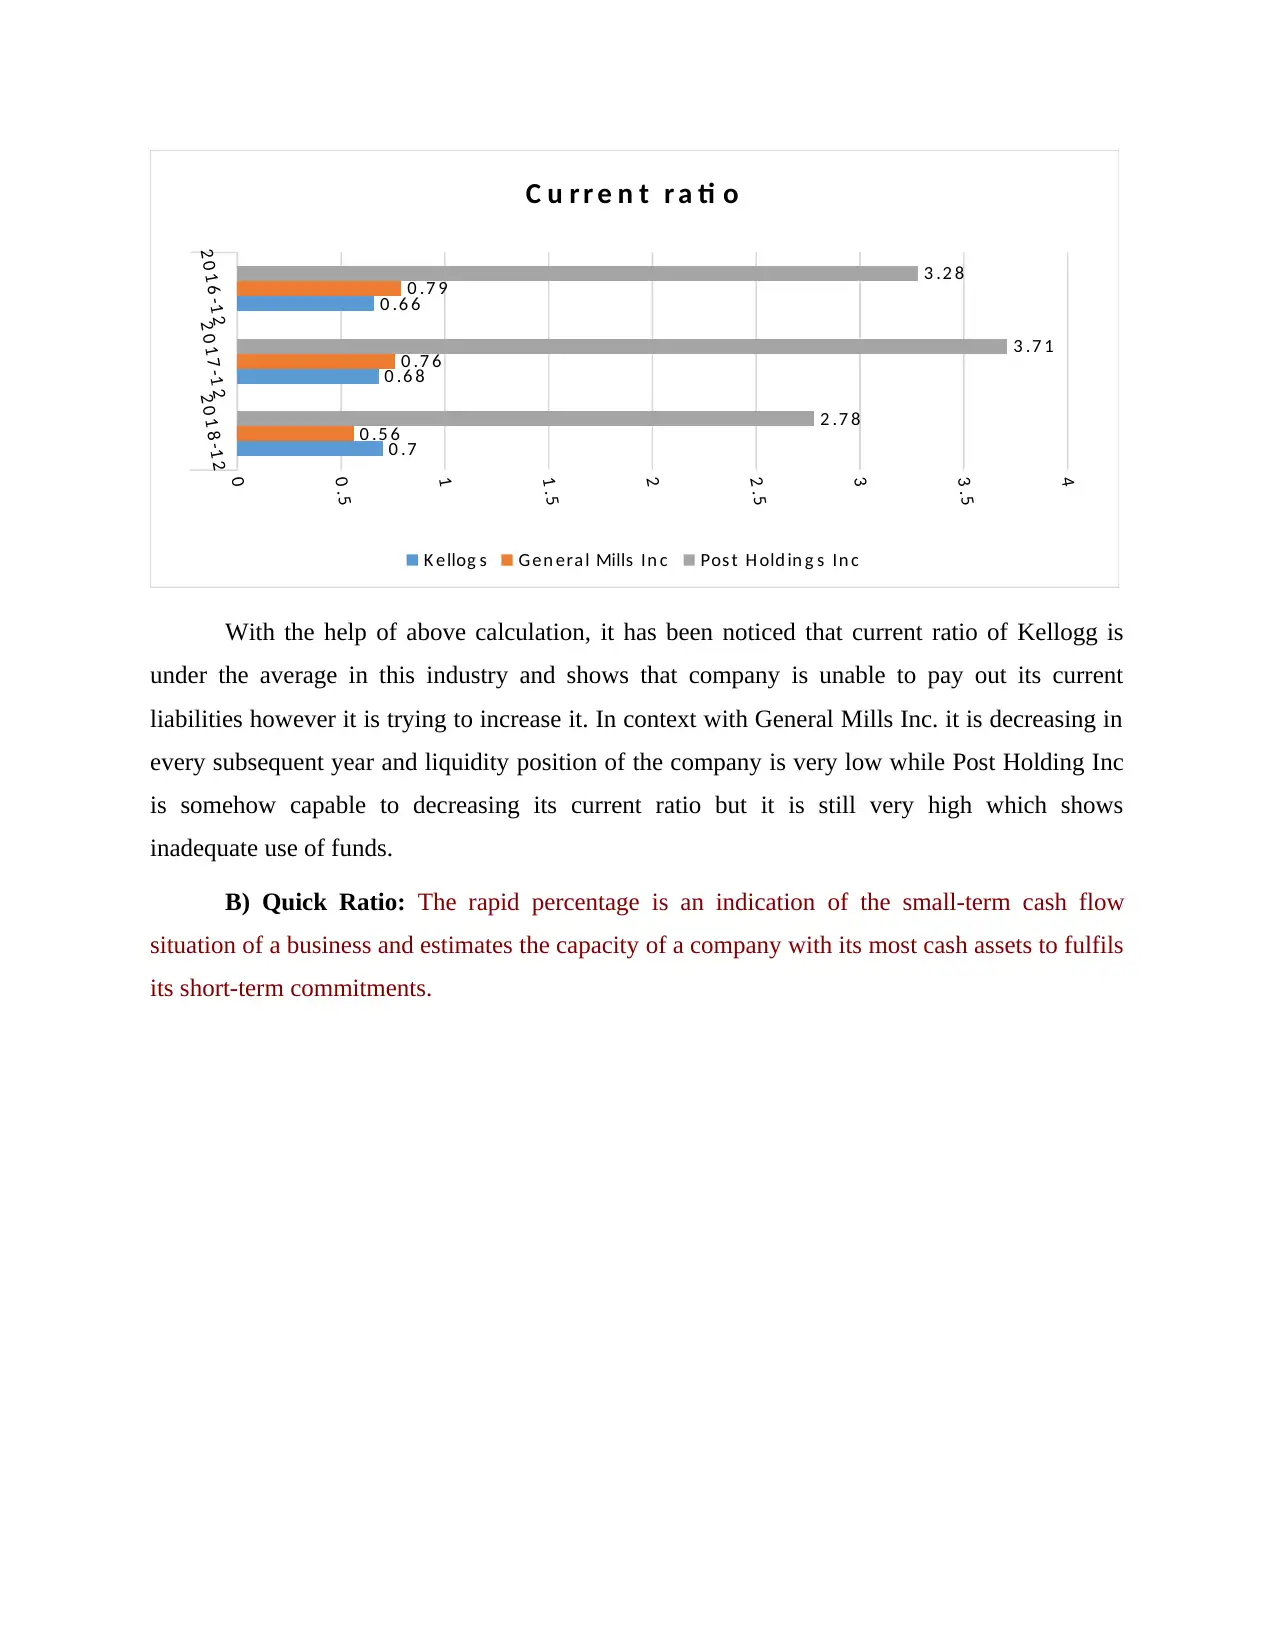
With the help of above calculation, it has been noticed that current ratio of Kellogg is
under the average in this industry and shows that company is unable to pay out its current
liabilities however it is trying to increase it. In context with General Mills Inc. it is decreasing in
every subsequent year and liquidity position of the company is very low while Post Holding Inc
is somehow capable to decreasing its current ratio but it is still very high which shows
inadequate use of funds.
B) Quick Ratio: The rapid percentage is an indication of the small-term cash flow
situation of a business and estimates the capacity of a company with its most cash assets to fulfils
its short-term commitments.
2 0 1 7 -1 2
2 0 1 6 -1 2 0
0 .5
1
1 .5
2
2 .5
3
3 .5
4
0 .7
0 .6 8
0 .6 6
0 .5 6
0 .7 6
0 .7 9
2 .7 8
3 .7 1
3 .2 8
C u r r e n t r a ti o
K ellog s G en era l Mills In c Pos t H old in g s In c
With the help of above calculation, it has been noticed that current ratio of Kellogg is
under the average in this industry and shows that company is unable to pay out its current
liabilities however it is trying to increase it. In context with General Mills Inc. it is decreasing in
every subsequent year and liquidity position of the company is very low while Post Holding Inc
is somehow capable to decreasing its current ratio but it is still very high which shows
inadequate use of funds.
B) Quick Ratio: The rapid percentage is an indication of the small-term cash flow
situation of a business and estimates the capacity of a company with its most cash assets to fulfils
its short-term commitments.
2 0 1 8 -1 2
2 0 1 7 -1 2
2 0 1 6 -1 2
0123
0 .3 7 0 .3 7 0 .3 40 .3 1 0 .4 5 0 .4 6
1 .8 3
2 .8 5
2 .4 1
Q u i c k r a ti o
K ellog s G en era l Mills In c Pos t H old in g s In c
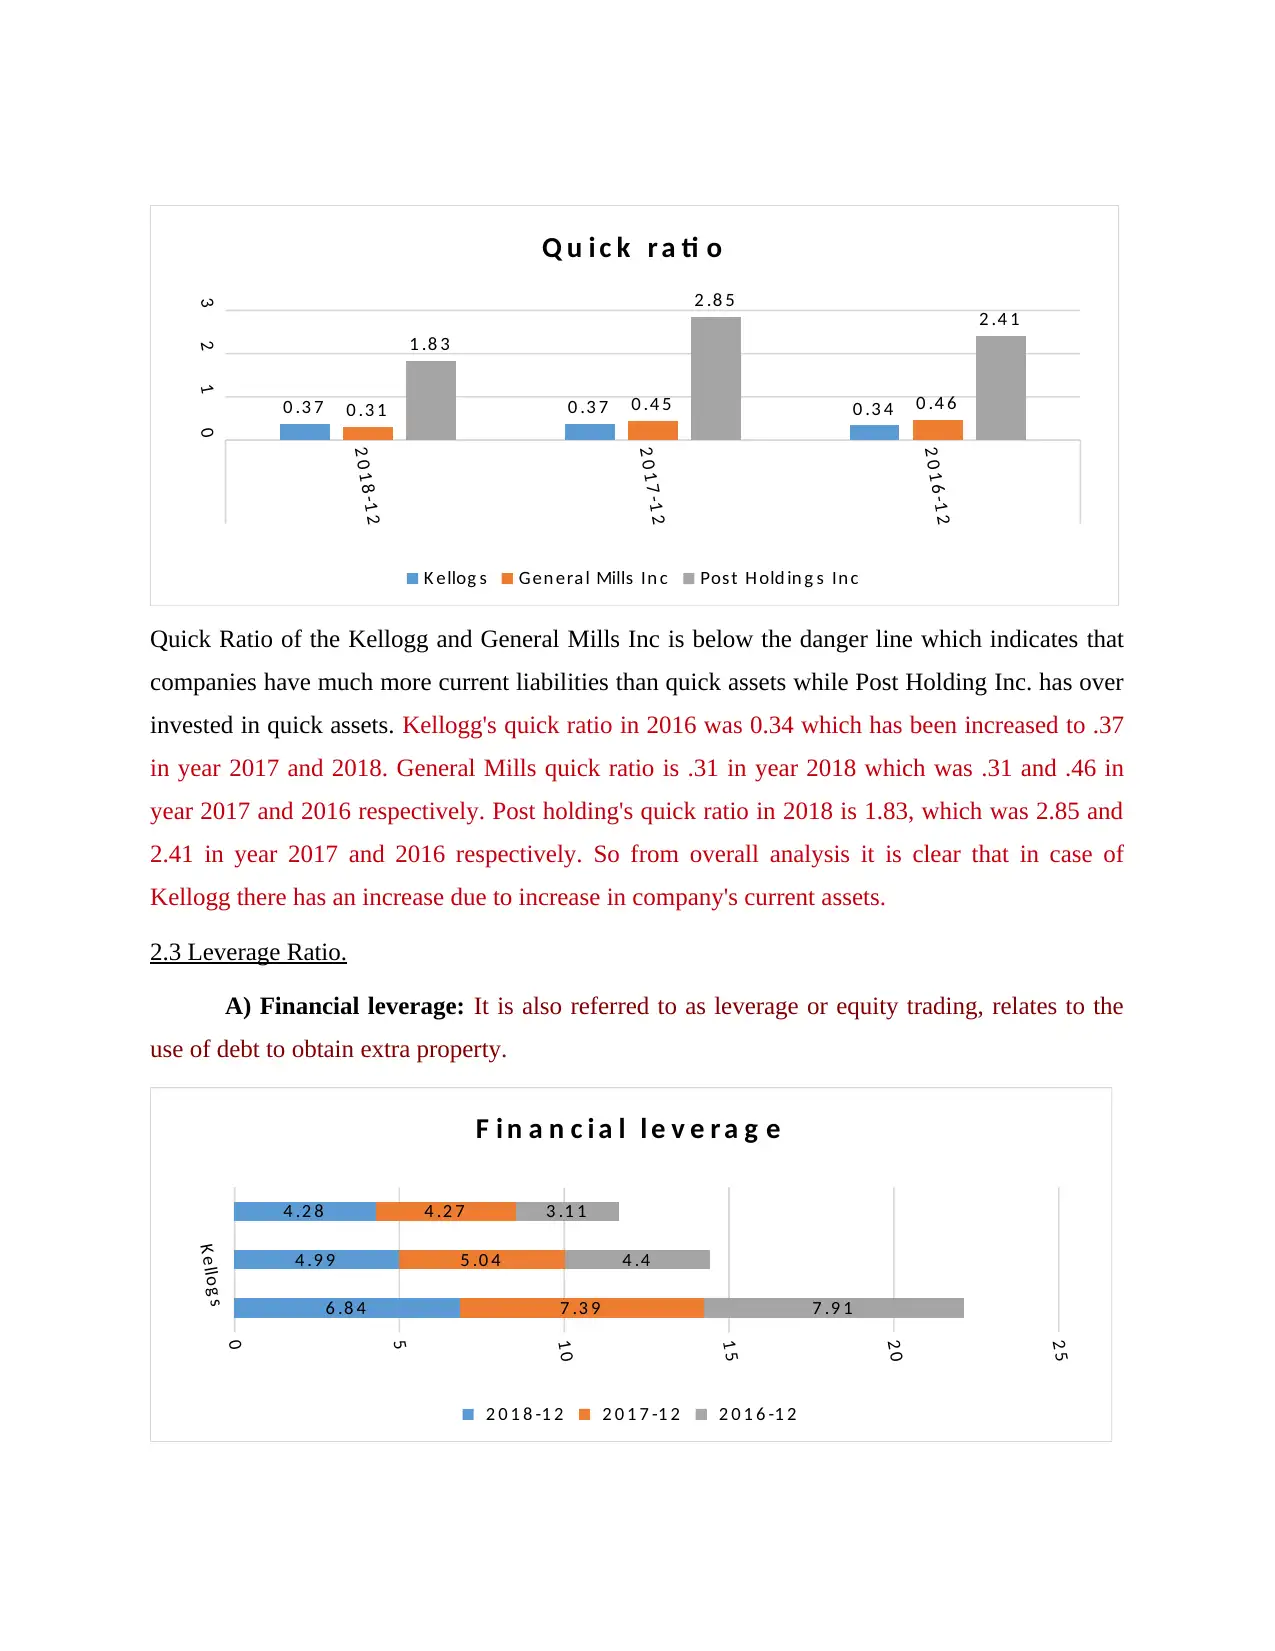
Quick Ratio of the Kellogg and General Mills Inc is below the danger line which indicates that
companies have much more current liabilities than quick assets while Post Holding Inc. has over
invested in quick assets. Kellogg's quick ratio in 2016 was 0.34 which has been increased to .37
in year 2017 and 2018. General Mills quick ratio is .31 in year 2018 which was .31 and .46 in
year 2017 and 2016 respectively. Post holding's quick ratio in 2018 is 1.83, which was 2.85 and
2.41 in year 2017 and 2016 respectively. So from overall analysis it is clear that in case of
Kellogg there has an increase due to increase in company's current assets.
2.3 Leverage Ratio.
A) Financial leverage: It is also referred to as leverage or equity trading, relates to the
use of debt to obtain extra property.
K ellog s 0
5
1 0
1 5
2 0
2 5
6 .8 4
4 .9 9
4 .2 8
7 .3 9
5 .0 4
4 .2 7
7 .9 1
4 .4
3 .1 1
F i n a n c i a l l e v e r a g e
2 0 1 8 -1 2 2 0 1 7 -1 2 2 0 1 6 -1 2
2 0 1 7 -1 2
2 0 1 6 -1 2
0123
0 .3 7 0 .3 7 0 .3 40 .3 1 0 .4 5 0 .4 6
1 .8 3
2 .8 5
2 .4 1
Q u i c k r a ti o
K ellog s G en era l Mills In c Pos t H old in g s In c
Quick Ratio of the Kellogg and General Mills Inc is below the danger line which indicates that
companies have much more current liabilities than quick assets while Post Holding Inc. has over
invested in quick assets. Kellogg's quick ratio in 2016 was 0.34 which has been increased to .37
in year 2017 and 2018. General Mills quick ratio is .31 in year 2018 which was .31 and .46 in
year 2017 and 2016 respectively. Post holding's quick ratio in 2018 is 1.83, which was 2.85 and
2.41 in year 2017 and 2016 respectively. So from overall analysis it is clear that in case of
Kellogg there has an increase due to increase in company's current assets.
2.3 Leverage Ratio.
A) Financial leverage: It is also referred to as leverage or equity trading, relates to the
use of debt to obtain extra property.
K ellog s 0
5
1 0
1 5
2 0
2 5
6 .8 4
4 .9 9
4 .2 8
7 .3 9
5 .0 4
4 .2 7
7 .9 1
4 .4
3 .1 1
F i n a n c i a l l e v e r a g e
2 0 1 8 -1 2 2 0 1 7 -1 2 2 0 1 6 -1 2
⊘ This is a preview!⊘
Do you want full access?
Subscribe today to unlock all pages.
Trusted by 1+ million students worldwide
Calculation indicates that Degree of financial leverage in Kellogg is decreasing per year while
Post Holding Inc is managing to increase its financial leverage every year. Degree of financial
leverage of General Mills Inc is fluctuating which is not good for the stakeholders.
2.4 Investors Ratio.
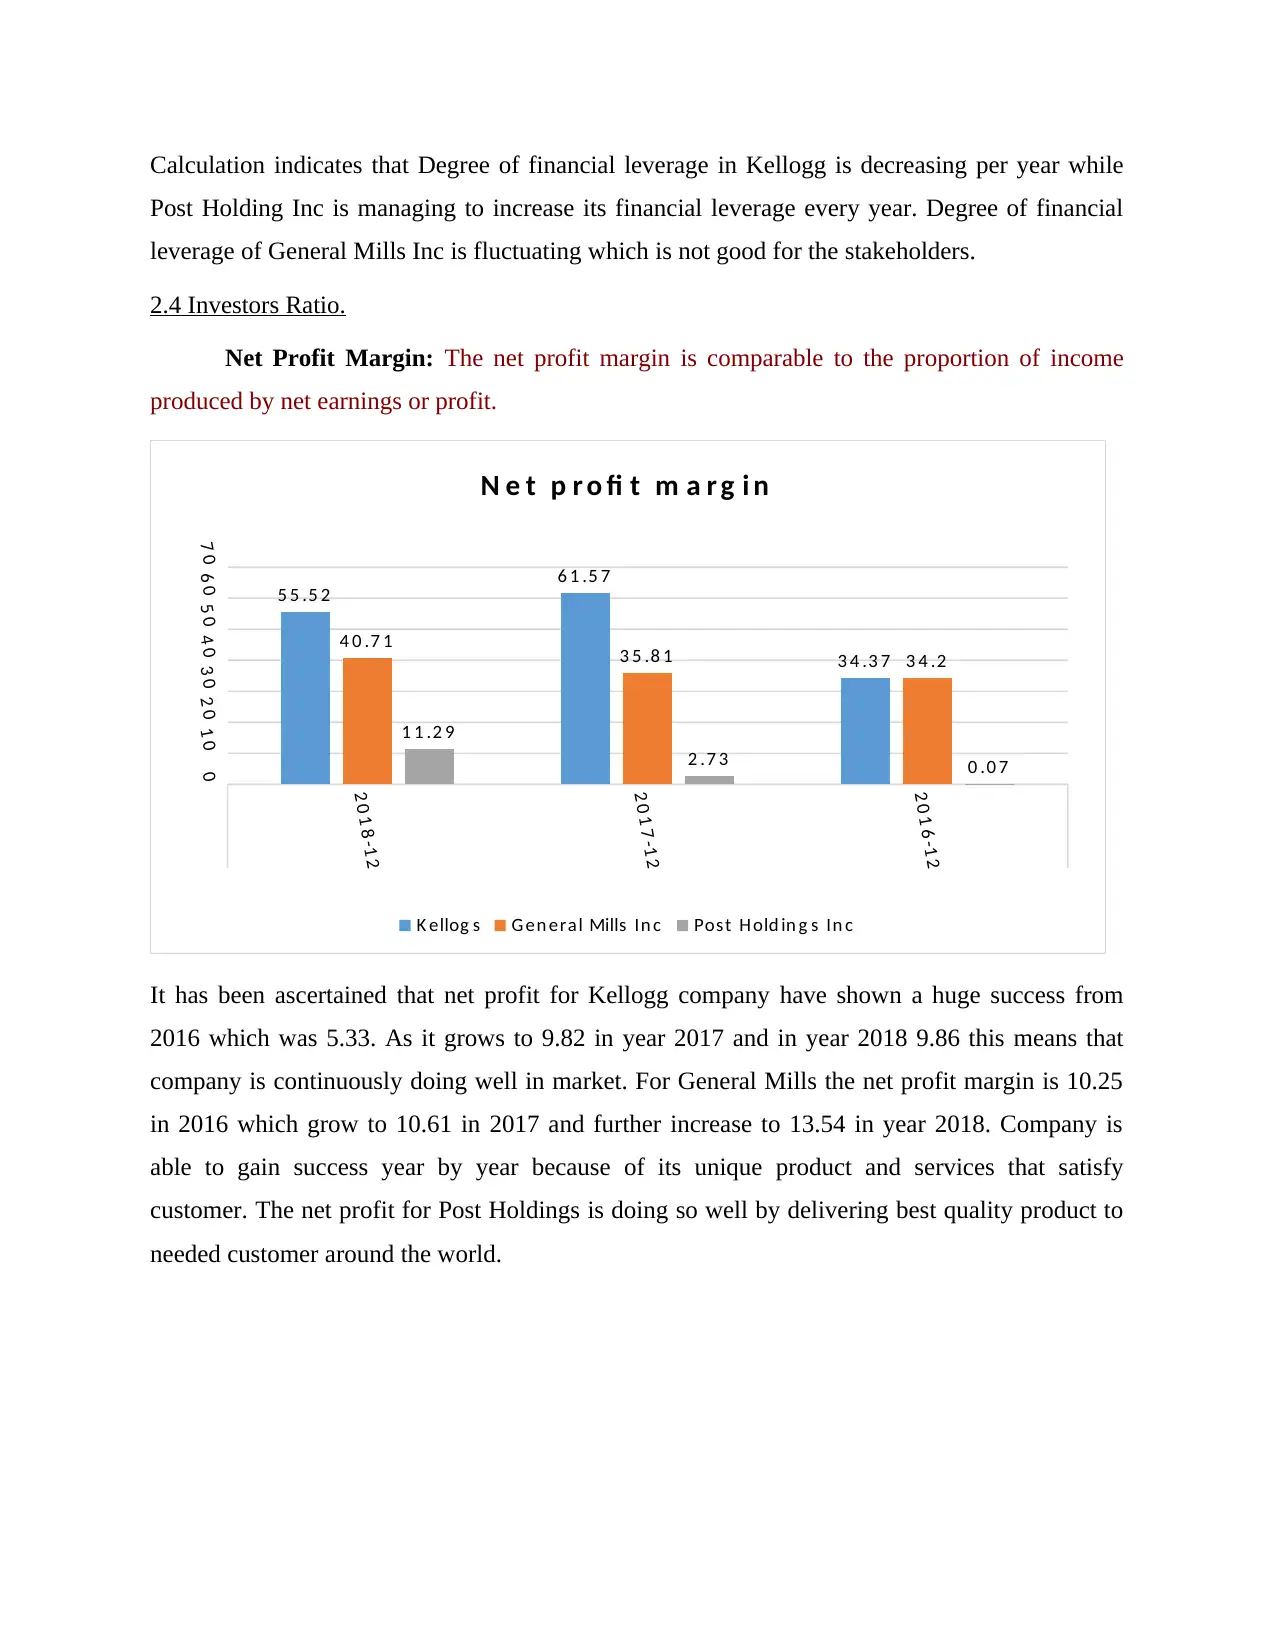
Net Profit Margin: The net profit margin is comparable to the proportion of income
produced by net earnings or profit.
2 0 1 8 -1 2
2 0 1 7 -1 2
2 0 1 6 -1 2
01 02 03 04 05 06 07 0
5 5 .5 2
6 1 .5 7
3 4 .3 7
4 0 .7 1 3 5 .8 1 3 4 .2
1 1 .2 9
2 .7 3 0 .0 7
N e t p r o fi t m a r g i n
K ellog s G en eral Mills In c Post H old in g s In c
It has been ascertained that net profit for Kellogg company have shown a huge success from
2016 which was 5.33. As it grows to 9.82 in year 2017 and in year 2018 9.86 this means that
company is continuously doing well in market. For General Mills the net profit margin is 10.25
in 2016 which grow to 10.61 in 2017 and further increase to 13.54 in year 2018. Company is
able to gain success year by year because of its unique product and services that satisfy
customer. The net profit for Post Holdings is doing so well by delivering best quality product to
needed customer around the world.
Post Holding Inc is managing to increase its financial leverage every year. Degree of financial
leverage of General Mills Inc is fluctuating which is not good for the stakeholders.
2.4 Investors Ratio.
Net Profit Margin: The net profit margin is comparable to the proportion of income
produced by net earnings or profit.
2 0 1 8 -1 2
2 0 1 7 -1 2
2 0 1 6 -1 2
01 02 03 04 05 06 07 0
5 5 .5 2
6 1 .5 7
3 4 .3 7
4 0 .7 1 3 5 .8 1 3 4 .2
1 1 .2 9
2 .7 3 0 .0 7
N e t p r o fi t m a r g i n
K ellog s G en eral Mills In c Post H old in g s In c
It has been ascertained that net profit for Kellogg company have shown a huge success from
2016 which was 5.33. As it grows to 9.82 in year 2017 and in year 2018 9.86 this means that
company is continuously doing well in market. For General Mills the net profit margin is 10.25
in 2016 which grow to 10.61 in 2017 and further increase to 13.54 in year 2018. Company is
able to gain success year by year because of its unique product and services that satisfy
customer. The net profit for Post Holdings is doing so well by delivering best quality product to
needed customer around the world.
Paraphrase This Document
Need a fresh take? Get an instant paraphrase of this document with our AI Paraphraser
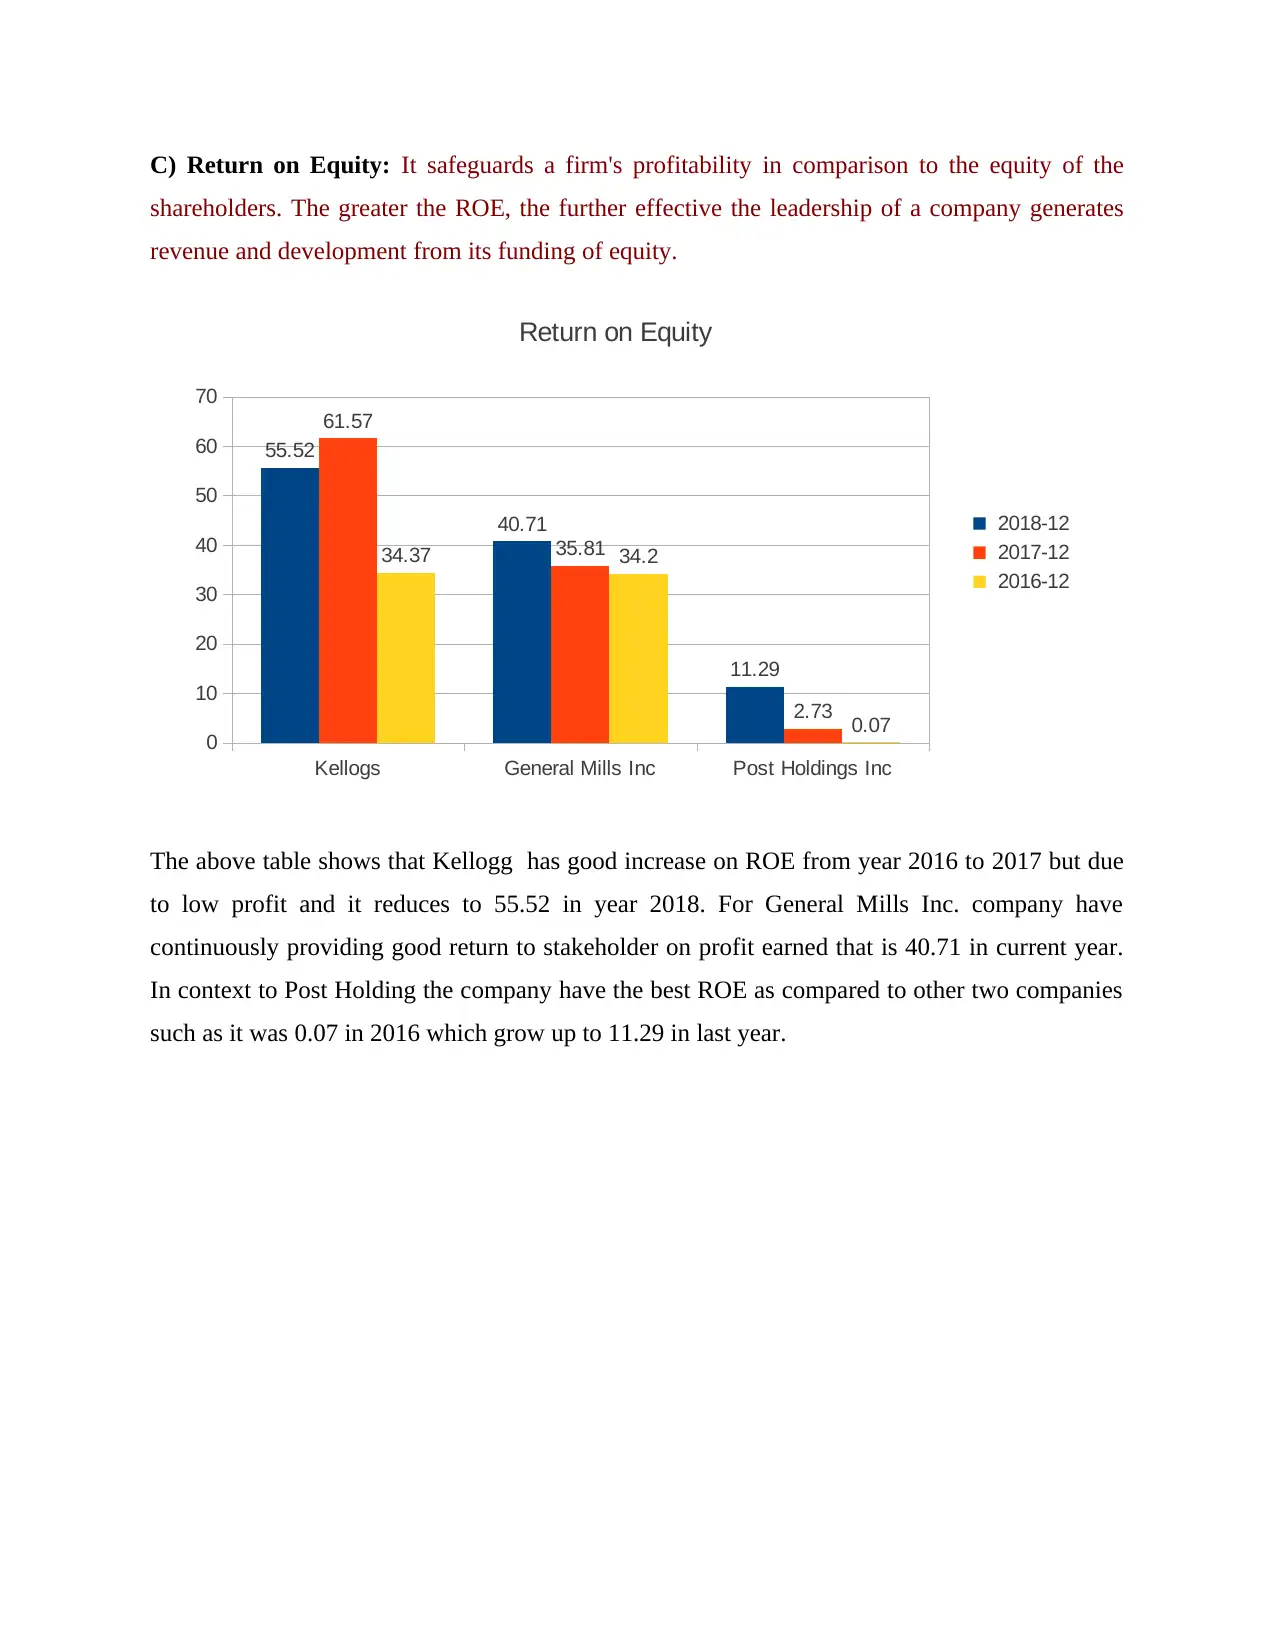
C) Return on Equity: It safeguards a firm's profitability in comparison to the equity of the
shareholders. The greater the ROE, the further effective the leadership of a company generates
revenue and development from its funding of equity.
Kellogs General Mills Inc Post Holdings Inc
0
10
20
30
40
50
60
70
55.52
40.71
11.29
61.57
35.81
2.73
34.37 34.2
0.07
Return on Equity
2018-12
2017-12
2016-12
The above table shows that Kellogg has good increase on ROE from year 2016 to 2017 but due
to low profit and it reduces to 55.52 in year 2018. For General Mills Inc. company have
continuously providing good return to stakeholder on profit earned that is 40.71 in current year.
In context to Post Holding the company have the best ROE as compared to other two companies
such as it was 0.07 in 2016 which grow up to 11.29 in last year.
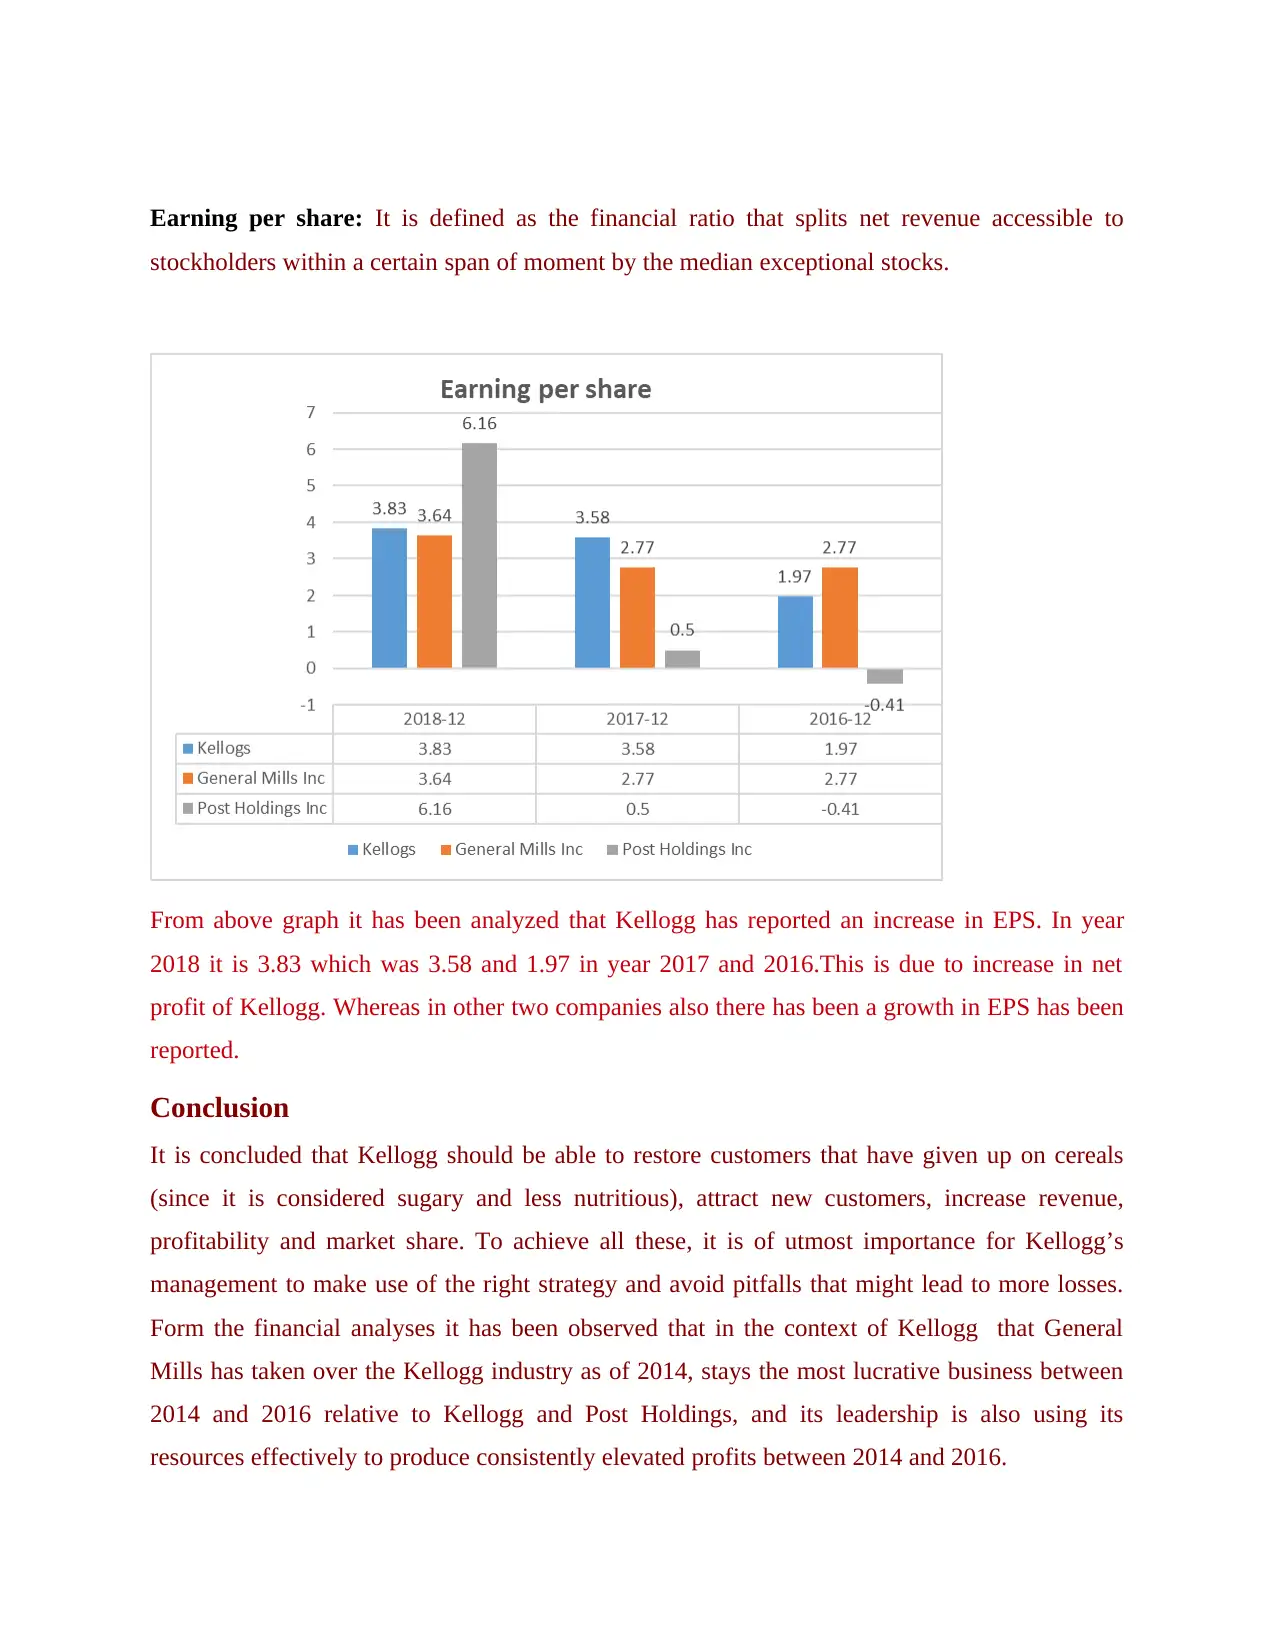
Earning per share: It is defined as the financial ratio that splits net revenue accessible to
stockholders within a certain span of moment by the median exceptional stocks.
From above graph it has been analyzed that Kellogg has reported an increase in EPS. In year
2018 it is 3.83 which was 3.58 and 1.97 in year 2017 and 2016.This is due to increase in net
profit of Kellogg. Whereas in other two companies also there has been a growth in EPS has been
reported.
Conclusion
It is concluded that Kellogg should be able to restore customers that have given up on cereals
(since it is considered sugary and less nutritious), attract new customers, increase revenue,
profitability and market share. To achieve all these, it is of utmost importance for Kellogg’s
management to make use of the right strategy and avoid pitfalls that might lead to more losses.
Form the financial analyses it has been observed that in the context of Kellogg that General
Mills has taken over the Kellogg industry as of 2014, stays the most lucrative business between
2014 and 2016 relative to Kellogg and Post Holdings, and its leadership is also using its
resources effectively to produce consistently elevated profits between 2014 and 2016.
⊘ This is a preview!⊘
Do you want full access?
Subscribe today to unlock all pages.
Trusted by 1+ million students worldwide
1 out of 31
Related Documents


Your All-in-One AI-Powered Toolkit for Academic Success.
+13062052269
info@desklib.com
Available 24*7 on WhatsApp / Email
![[object Object]](/_next/static/media/star-bottom.7253800d.svg)
Unlock your academic potential
Copyright © 2020–2026 A2Z Services. All Rights Reserved. Developed and managed by ZUCOL.