Comparative Analysis: WBES Data on Business in Kenya & South Africa
VerifiedAdded on 2023/06/12
|11
|3057
|161
Report
AI Summary
This report examines the role and purpose of quantitative and qualitative research in modern marketing and data analysis, focusing on regression and correlation techniques. It addresses issues in modern business decision-making and effective data collection methods. The analysis utilizes data from the World Bank Enterprise Survey (WBES) for Kenya and South Africa, identifying obstacles faced by businesses, such as labor regulations, inadequate workforce education, access to finance, crime, and political instability. The data is sorted and interpreted using Excel functions to calculate mean, median, and mode, revealing insights into how these factors impact business development. Key findings highlight the challenges posed by political instability, customs and trade regulations, business licensing permits, access to finance, labor regulations, and access to land, providing a comparative perspective between the two countries. Desklib offers similar solved assignments and past papers for students.
WBES Data Analysis
Paraphrase This Document
Need a fresh take? Get an instant paraphrase of this document with our AI Paraphraser
Contents
INTRODUCTION...........................................................................................................................3
MAIN BODY..................................................................................................................................3
Examine the material supplied to acquire a better grasp of what the company need..................3
Choose the questions company wants to look into to get the information they need..................4
Analyse the data for the questions company has chosen using the relevant summary statistic.. 5
Findings and recommendations...................................................................................................8
CONCLUSION................................................................................................................................9
REFERENCES..............................................................................................................................11
INTRODUCTION
The report takes in account Role and purpose of quantitative and qualitative research in
modern marketing and data analysis. It further describes in what certain ways regression and
correlation are taken in account. It also helps to understand issues present while adapting modern
business decision making tools and techniques. The report helps in collection of data of data
through effective ways which would help in carrying out effective decisions. With thorough
knowledge of what big data is would be useful and helpful for a business and company in
achieving its goals and objectives set for a specific time duration. Business can benefit their
growth and expansion by collecting data and information from various sources. Corporate gain a
better understanding of their habits being adapted, needs and wants of consumers linked with the
firm. The data and information so far collected helps to gather sources that would guarantee
earning and maximisation of profit in a related enterprise (Buxbaum and et.al., 2020).
MAIN BODY
Examine the material supplied to acquire a better grasp of what the company need.
Data set is a collection of data which contains information in a specified manner. Each
column has its own value. Each row has certain values which is presented in data set. Data set
presents value of each variable for indefinite quantity which can be classified as weight,
temperature, height, volume and various other characteristics. These values are referred to as
Datum. Data is corresponding with the one or more members of the other same data type. It
further explains various data types, attributes and data sets to be analysed. The data set provided
is comprises of two countries which are Kenya and South Africa. Various factors are in the
report which helps in knowing the insights of the businesses located these countries and how
these business run their operations in these countries.
The provided data is extracted from the data of World Bank Enterprise Survey (WBES).
The collected data shows the various challenges faced by the organisation in order to sustain in
the market. The excel is further divided into three parts, one of which represents data of South
Africa and second represents the data of Kenya and their and the last explains about the different
keys which helps in understanding the data provided. The data is further sorted by using different
functions of Excel such as replace, count, sort, etc. For analysing the available data, it further
⊘ This is a preview!⊘
Do you want full access?
Subscribe today to unlock all pages.
Trusted by 1+ million students worldwide
calculated the degree of change is calculated with the help of mean, median and mode which
helps in interpreting the data (Collingridge and Gantt, 2019).
The provided data set states the degree obstacles caused in operating a business and further
various factors are mentioned below,
Labour Regulation
Inadequately Educated workforce
Access to finance
Crime, theft and disorder
Access to land
Practices of competitors in the informal sector
Transport
Customs and trade regulations
Electricity
Tax rates
Tax administration
Political instability
Corruption
Courts
Business Licensing Permit
The data provided is coded in different terminologies and sorting those to interpret the data.
Choose the questions company wants to look into to get the information they need.
The provided data set is available with the various terminologies that helps businesses in taking
business decision techniques which are used in Africa. Following factors are used to analyse the
business situation in the African countries:
o Custom and Trade regulations: These trade regulations are mainly followed by the
countries in order to trade between the two nations. These rules and regulations helps in
deciding the tax rates which are applicable in order to transport the goods to the other
nation. It further includes trade protection laws, trademark, franchise and advertising.
o Political instability: The authorised employment of the public force by government is
essential for political party. By symbolising volatility in the political parties and electoral
Paraphrase This Document
Need a fresh take? Get an instant paraphrase of this document with our AI Paraphraser
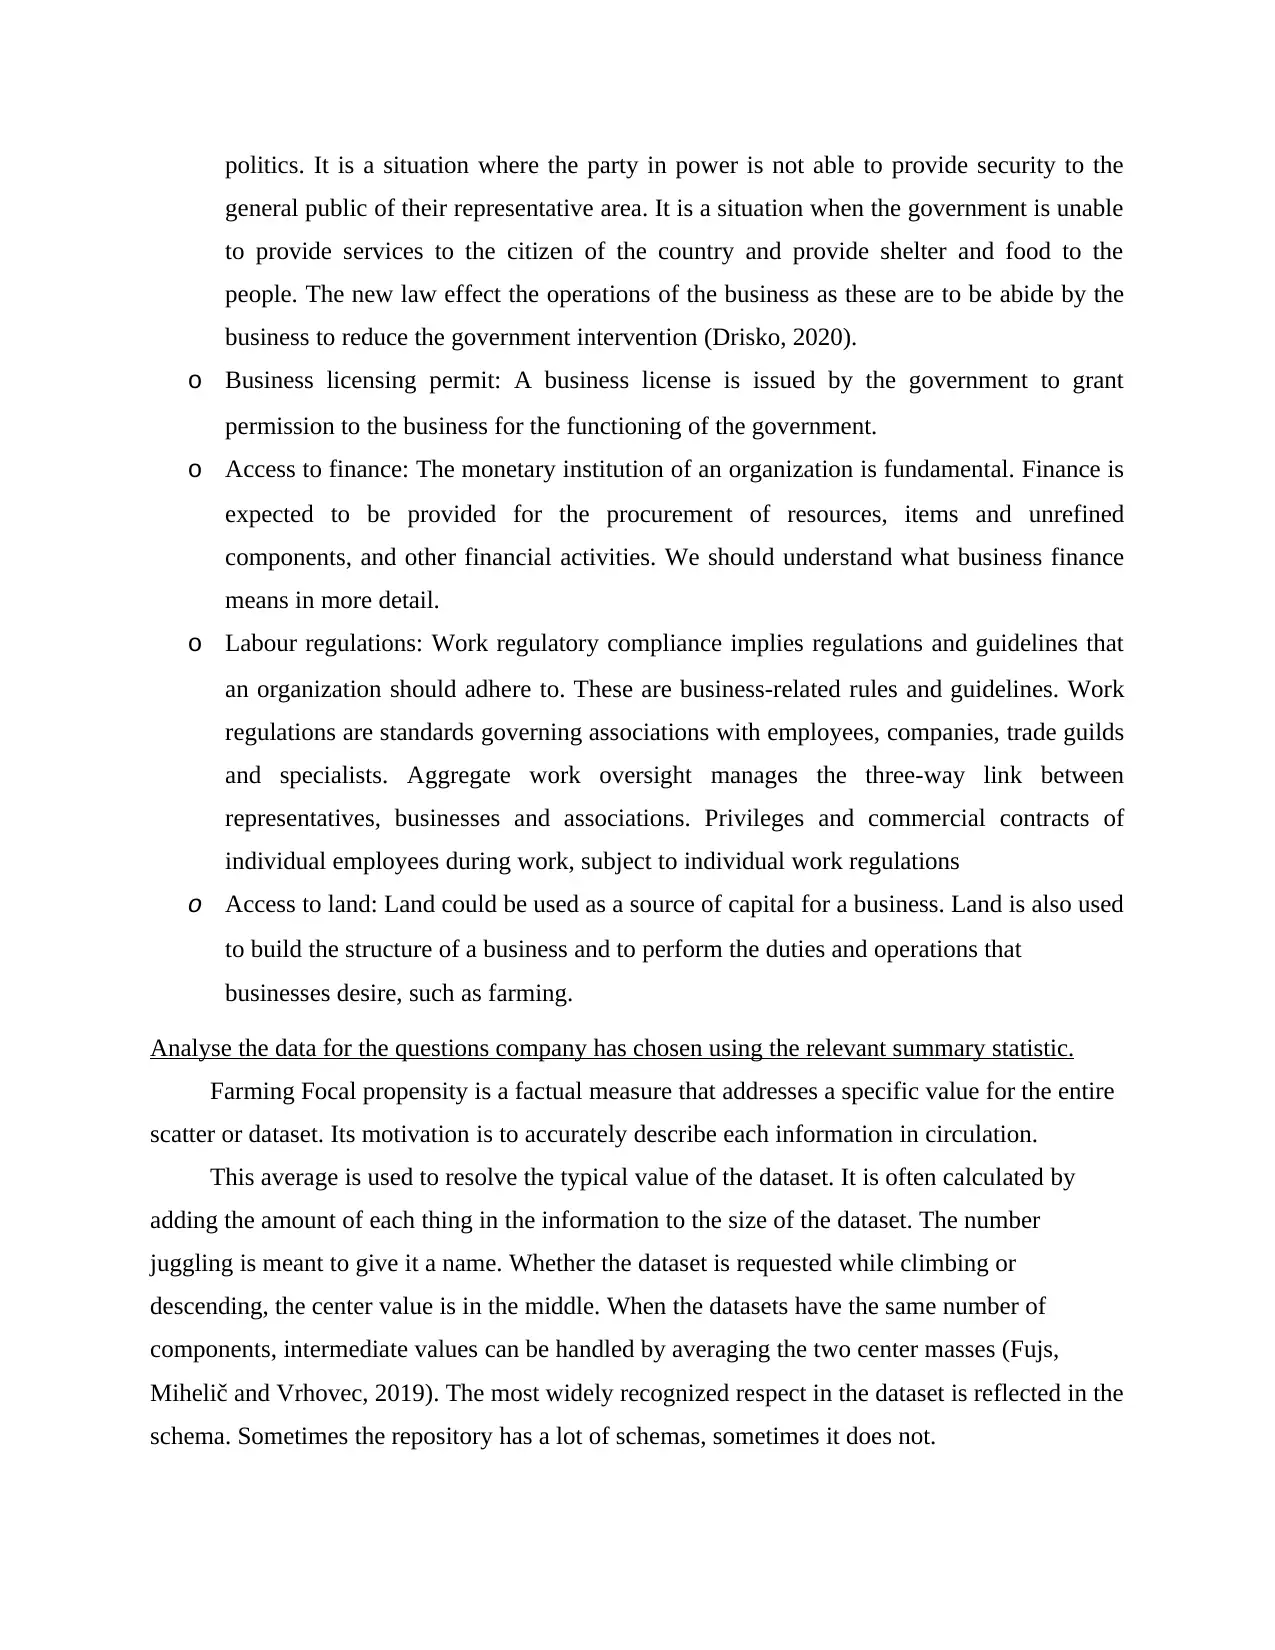
politics. It is a situation where the party in power is not able to provide security to the
general public of their representative area. It is a situation when the government is unable
to provide services to the citizen of the country and provide shelter and food to the
people. The new law effect the operations of the business as these are to be abide by the
business to reduce the government intervention (Drisko, 2020).
o Business licensing permit: A business license is issued by the government to grant
permission to the business for the functioning of the government.
o Access to finance: The monetary institution of an organization is fundamental. Finance is
expected to be provided for the procurement of resources, items and unrefined
components, and other financial activities. We should understand what business finance
means in more detail.
o Labour regulations: Work regulatory compliance implies regulations and guidelines that
an organization should adhere to. These are business-related rules and guidelines. Work
regulations are standards governing associations with employees, companies, trade guilds
and specialists. Aggregate work oversight manages the three-way link between
representatives, businesses and associations. Privileges and commercial contracts of
individual employees during work, subject to individual work regulations
o Access to land: Land could be used as a source of capital for a business. Land is also used
to build the structure of a business and to perform the duties and operations that
businesses desire, such as farming.
Analyse the data for the questions company has chosen using the relevant summary statistic.
Farming Focal propensity is a factual measure that addresses a specific value for the entire
scatter or dataset. Its motivation is to accurately describe each information in circulation.
This average is used to resolve the typical value of the dataset. It is often calculated by
adding the amount of each thing in the information to the size of the dataset. The number
juggling is meant to give it a name. Whether the dataset is requested while climbing or
descending, the center value is in the middle. When the datasets have the same number of
components, intermediate values can be handled by averaging the two center masses (Fujs,
Mihelič and Vrhovec, 2019). The most widely recognized respect in the dataset is reflected in the
schema. Sometimes the repository has a lot of schemas, sometimes it does not.
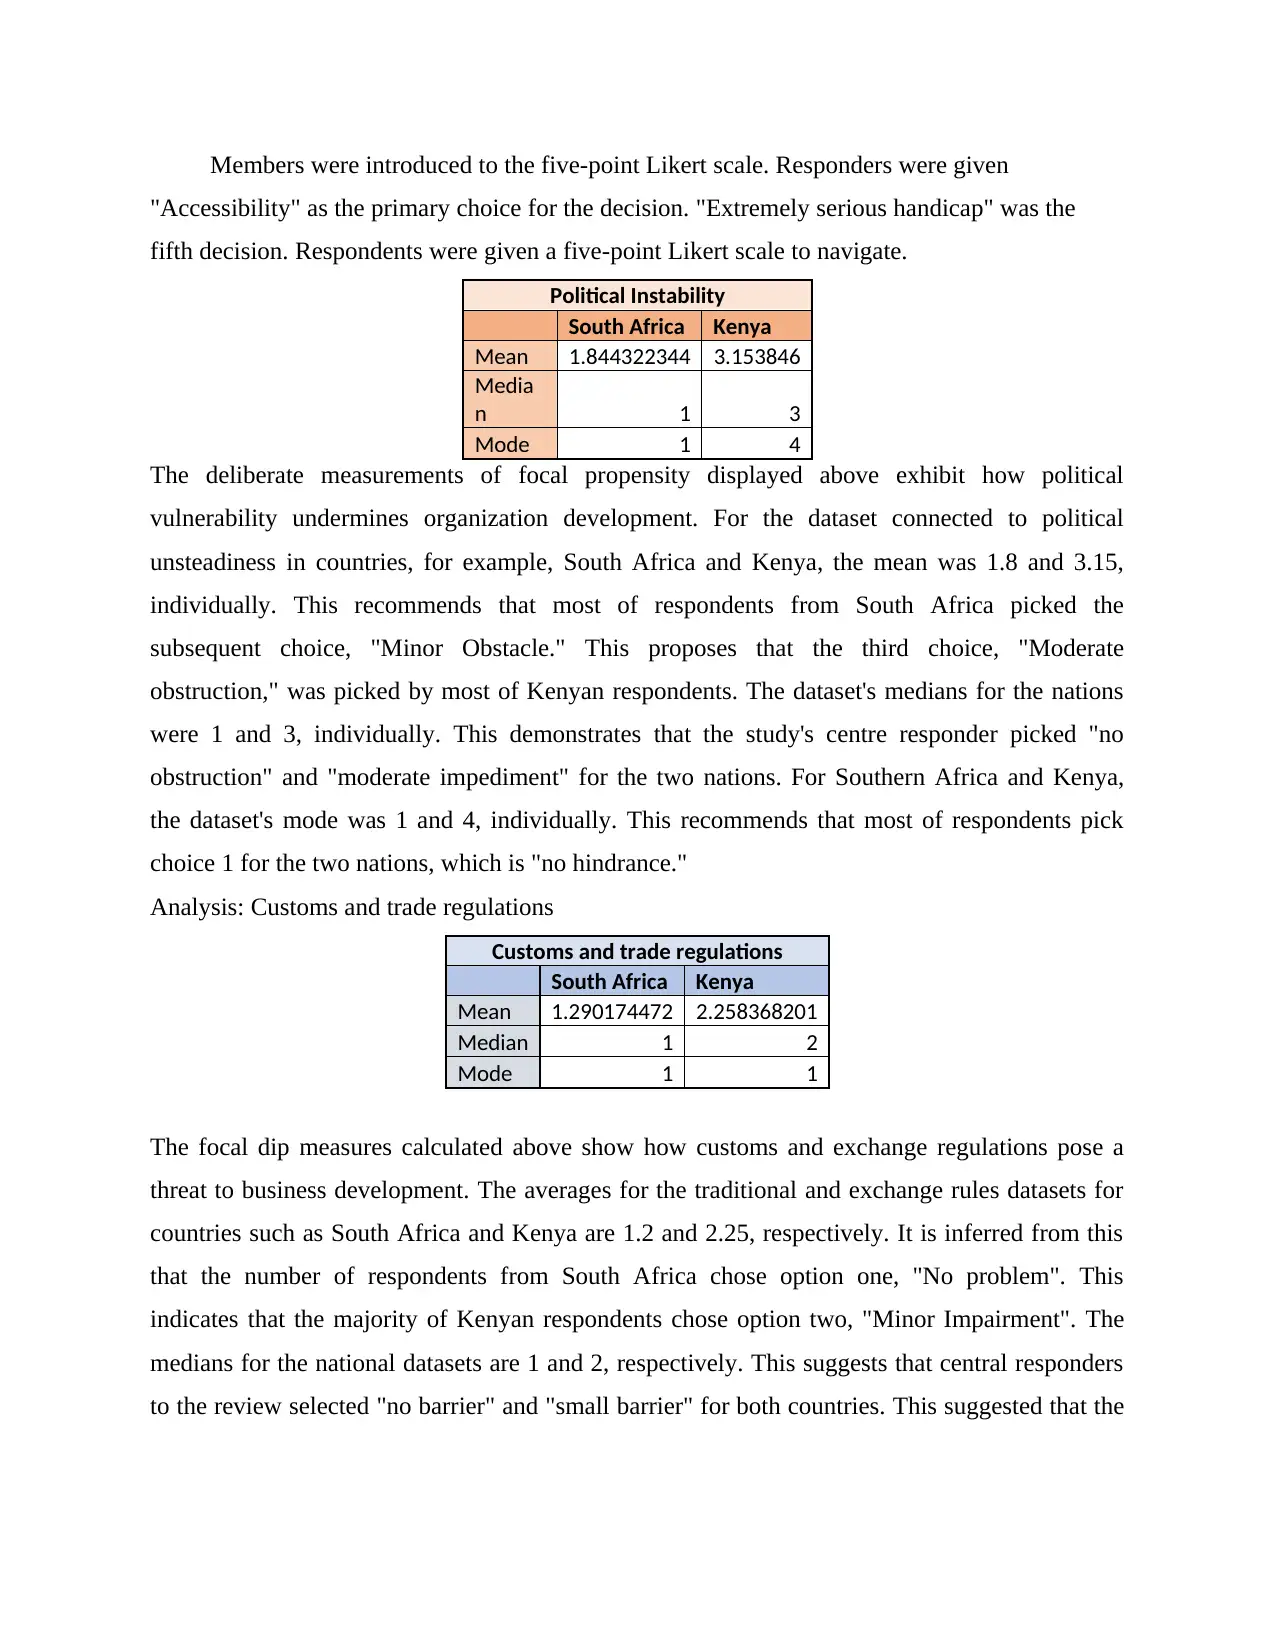
Members were introduced to the five-point Likert scale. Responders were given
"Accessibility" as the primary choice for the decision. "Extremely serious handicap" was the
fifth decision. Respondents were given a five-point Likert scale to navigate.
Political Instability
South Africa Kenya
Mean 1.844322344 3.153846
Media
n 1 3
Mode 1 4
The deliberate measurements of focal propensity displayed above exhibit how political
vulnerability undermines organization development. For the dataset connected to political
unsteadiness in countries, for example, South Africa and Kenya, the mean was 1.8 and 3.15,
individually. This recommends that most of respondents from South Africa picked the
subsequent choice, "Minor Obstacle." This proposes that the third choice, "Moderate
obstruction," was picked by most of Kenyan respondents. The dataset's medians for the nations
were 1 and 3, individually. This demonstrates that the study's centre responder picked "no
obstruction" and "moderate impediment" for the two nations. For Southern Africa and Kenya,
the dataset's mode was 1 and 4, individually. This recommends that most of respondents pick
choice 1 for the two nations, which is "no hindrance."
Analysis: Customs and trade regulations
Customs and trade regulations
South Africa Kenya
Mean 1.290174472 2.258368201
Median 1 2
Mode 1 1
The focal dip measures calculated above show how customs and exchange regulations pose a
threat to business development. The averages for the traditional and exchange rules datasets for
countries such as South Africa and Kenya are 1.2 and 2.25, respectively. It is inferred from this
that the number of respondents from South Africa chose option one, "No problem". This
indicates that the majority of Kenyan respondents chose option two, "Minor Impairment". The
medians for the national datasets are 1 and 2, respectively. This suggests that central responders
to the review selected "no barrier" and "small barrier" for both countries. This suggested that the
⊘ This is a preview!⊘
Do you want full access?
Subscribe today to unlock all pages.
Trusted by 1+ million students worldwide
majority of respondents would choose option 1, 'no barriers', for both countries (Gallina and
et.al., 2022).
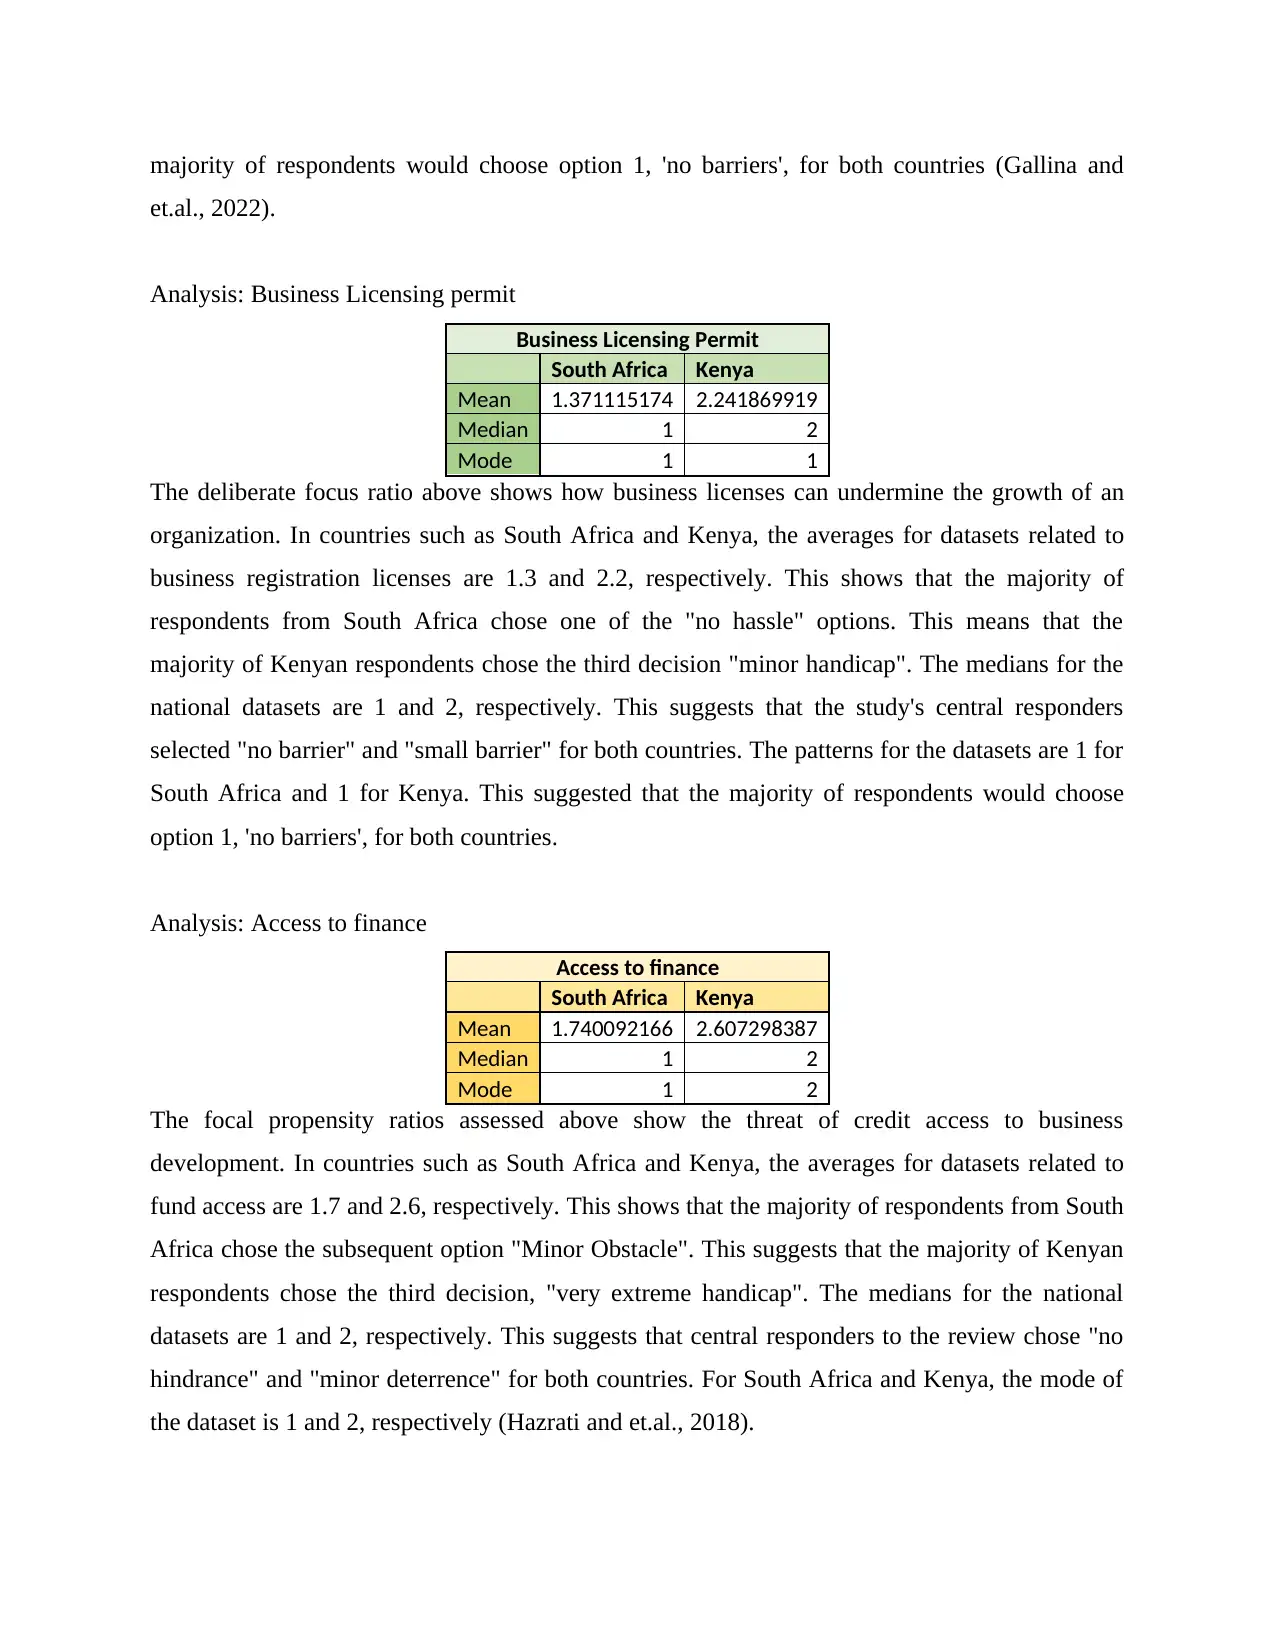
Analysis: Business Licensing permit
Business Licensing Permit
South Africa Kenya
Mean 1.371115174 2.241869919
Median 1 2
Mode 1 1
The deliberate focus ratio above shows how business licenses can undermine the growth of an
organization. In countries such as South Africa and Kenya, the averages for datasets related to
business registration licenses are 1.3 and 2.2, respectively. This shows that the majority of
respondents from South Africa chose one of the "no hassle" options. This means that the
majority of Kenyan respondents chose the third decision "minor handicap". The medians for the
national datasets are 1 and 2, respectively. This suggests that the study's central responders
selected "no barrier" and "small barrier" for both countries. The patterns for the datasets are 1 for
South Africa and 1 for Kenya. This suggested that the majority of respondents would choose
option 1, 'no barriers', for both countries.
Analysis: Access to finance
Access to finance
South Africa Kenya
Mean 1.740092166 2.607298387
Median 1 2
Mode 1 2
The focal propensity ratios assessed above show the threat of credit access to business
development. In countries such as South Africa and Kenya, the averages for datasets related to
fund access are 1.7 and 2.6, respectively. This shows that the majority of respondents from South
Africa chose the subsequent option "Minor Obstacle". This suggests that the majority of Kenyan
respondents chose the third decision, "very extreme handicap". The medians for the national
datasets are 1 and 2, respectively. This suggests that central responders to the review chose "no
hindrance" and "minor deterrence" for both countries. For South Africa and Kenya, the mode of
the dataset is 1 and 2, respectively (Hazrati and et.al., 2018).
et.al., 2022).
Analysis: Business Licensing permit
Business Licensing Permit
South Africa Kenya
Mean 1.371115174 2.241869919
Median 1 2
Mode 1 1
The deliberate focus ratio above shows how business licenses can undermine the growth of an
organization. In countries such as South Africa and Kenya, the averages for datasets related to
business registration licenses are 1.3 and 2.2, respectively. This shows that the majority of
respondents from South Africa chose one of the "no hassle" options. This means that the
majority of Kenyan respondents chose the third decision "minor handicap". The medians for the
national datasets are 1 and 2, respectively. This suggests that the study's central responders
selected "no barrier" and "small barrier" for both countries. The patterns for the datasets are 1 for
South Africa and 1 for Kenya. This suggested that the majority of respondents would choose
option 1, 'no barriers', for both countries.
Analysis: Access to finance
Access to finance
South Africa Kenya
Mean 1.740092166 2.607298387
Median 1 2
Mode 1 2
The focal propensity ratios assessed above show the threat of credit access to business
development. In countries such as South Africa and Kenya, the averages for datasets related to
fund access are 1.7 and 2.6, respectively. This shows that the majority of respondents from South
Africa chose the subsequent option "Minor Obstacle". This suggests that the majority of Kenyan
respondents chose the third decision, "very extreme handicap". The medians for the national
datasets are 1 and 2, respectively. This suggests that central responders to the review chose "no
hindrance" and "minor deterrence" for both countries. For South Africa and Kenya, the mode of
the dataset is 1 and 2, respectively (Hazrati and et.al., 2018).
Paraphrase This Document
Need a fresh take? Get an instant paraphrase of this document with our AI Paraphraser
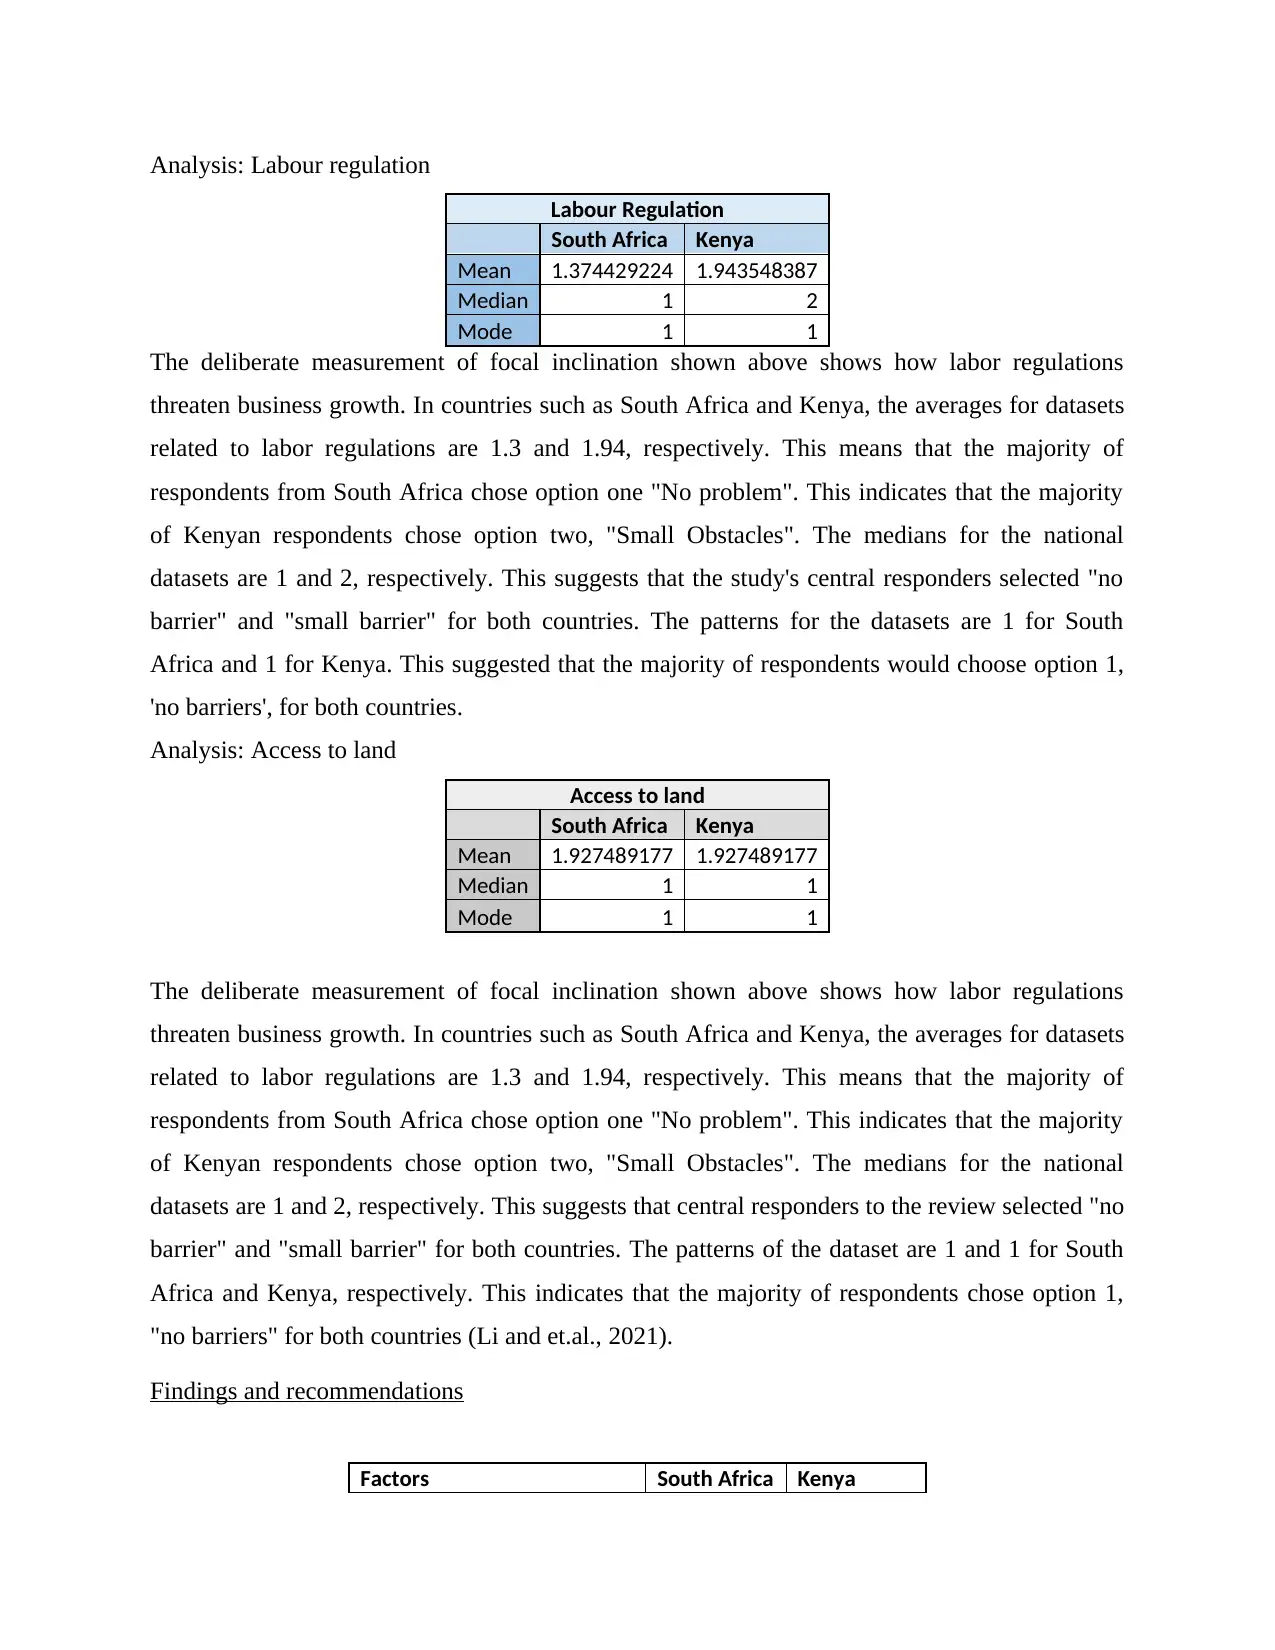
Analysis: Labour regulation
Labour Regulation
South Africa Kenya
Mean 1.374429224 1.943548387
Median 1 2
Mode 1 1
The deliberate measurement of focal inclination shown above shows how labor regulations
threaten business growth. In countries such as South Africa and Kenya, the averages for datasets
related to labor regulations are 1.3 and 1.94, respectively. This means that the majority of
respondents from South Africa chose option one "No problem". This indicates that the majority
of Kenyan respondents chose option two, "Small Obstacles". The medians for the national
datasets are 1 and 2, respectively. This suggests that the study's central responders selected "no
barrier" and "small barrier" for both countries. The patterns for the datasets are 1 for South
Africa and 1 for Kenya. This suggested that the majority of respondents would choose option 1,
'no barriers', for both countries.
Analysis: Access to land
Access to land
South Africa Kenya
Mean 1.927489177 1.927489177
Median 1 1
Mode 1 1
The deliberate measurement of focal inclination shown above shows how labor regulations
threaten business growth. In countries such as South Africa and Kenya, the averages for datasets
related to labor regulations are 1.3 and 1.94, respectively. This means that the majority of
respondents from South Africa chose option one "No problem". This indicates that the majority
of Kenyan respondents chose option two, "Small Obstacles". The medians for the national
datasets are 1 and 2, respectively. This suggests that central responders to the review selected "no
barrier" and "small barrier" for both countries. The patterns of the dataset are 1 and 1 for South
Africa and Kenya, respectively. This indicates that the majority of respondents chose option 1,
"no barriers" for both countries (Li and et.al., 2021).
Findings and recommendations
Factors South Africa Kenya
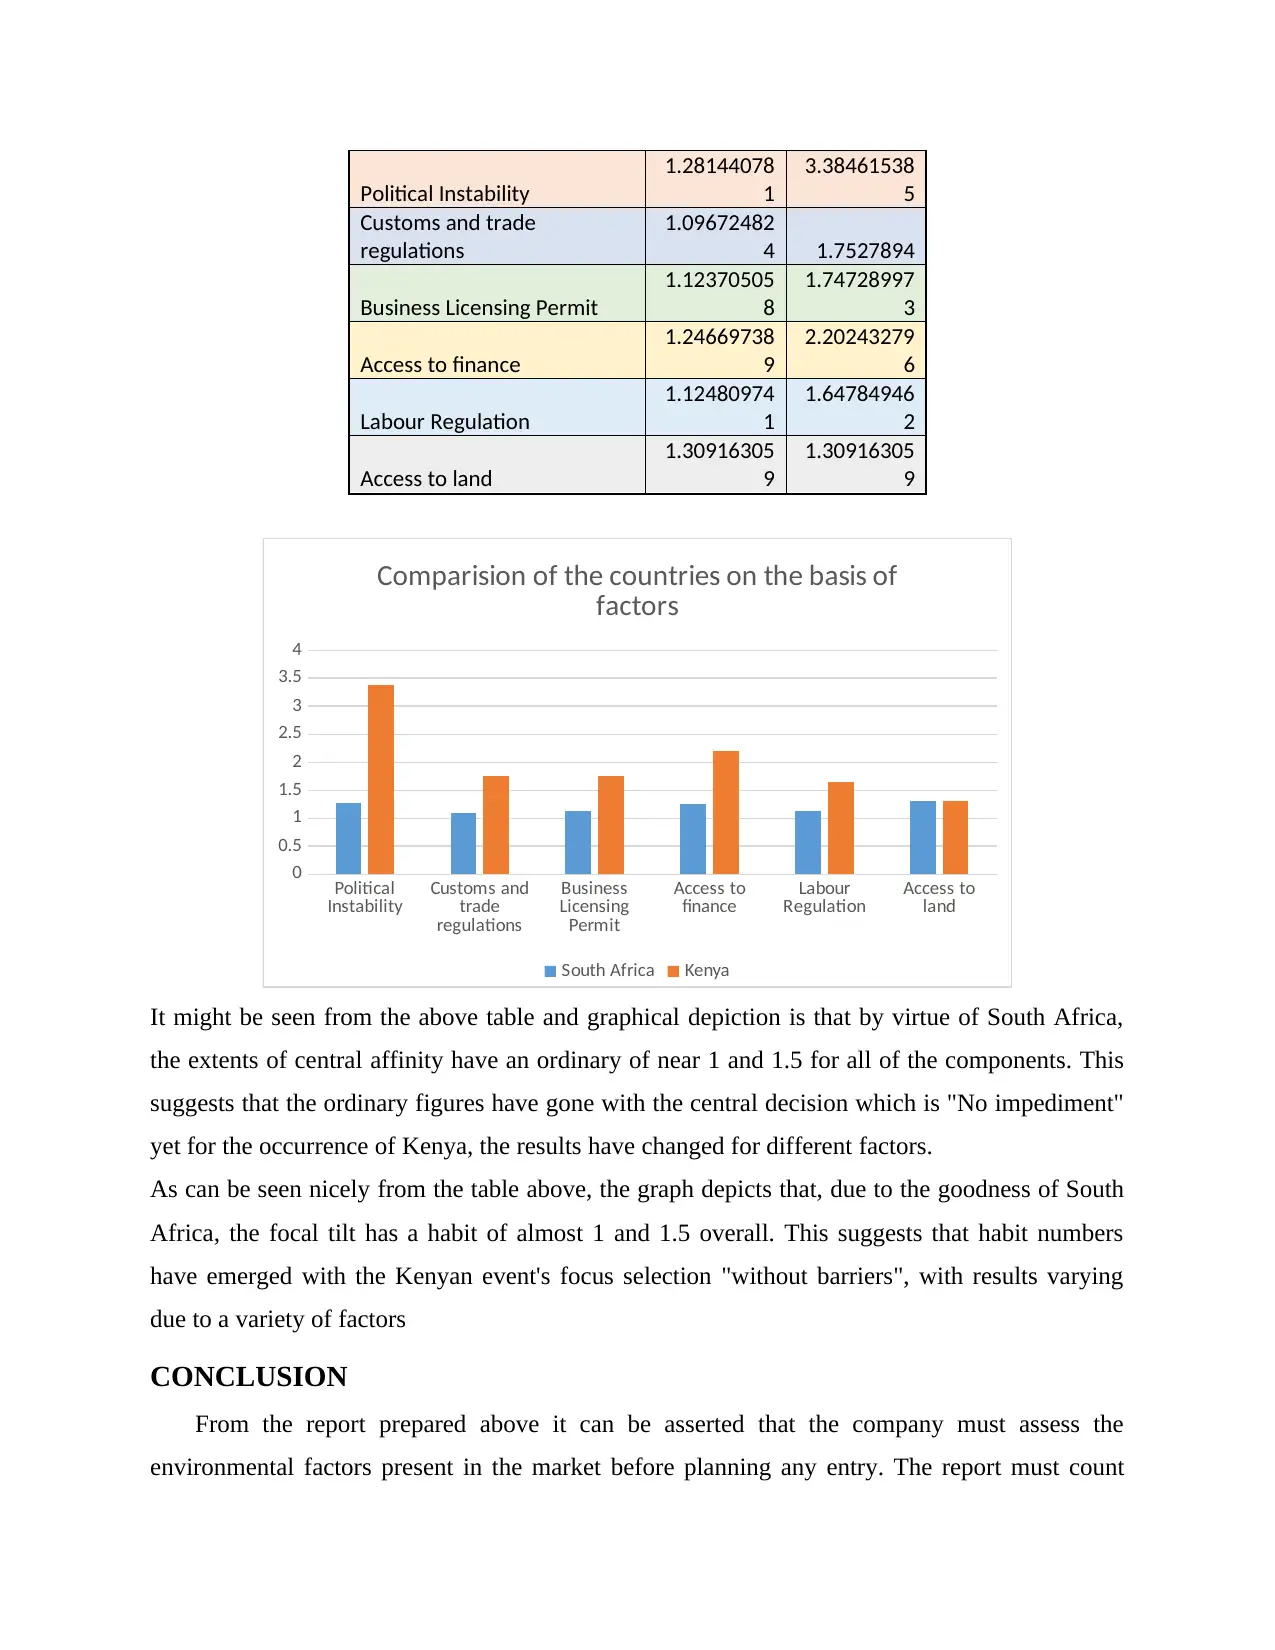
Political Instability
1.28144078
1
3.38461538
5
Customs and trade
regulations
1.09672482
4 1.7527894
Business Licensing Permit
1.12370505
8
1.74728997
3
Access to finance
1.24669738
9
2.20243279
6
Labour Regulation
1.12480974
1
1.64784946
2
Access to land
1.30916305
9
1.30916305
9
Political
Instability Customs and
trade
regulations
Business
Licensing
Permit
Access to
finance Labour
Regulation Access to
land
0
0.5
1
1.5
2
2.5
3
3.5
4
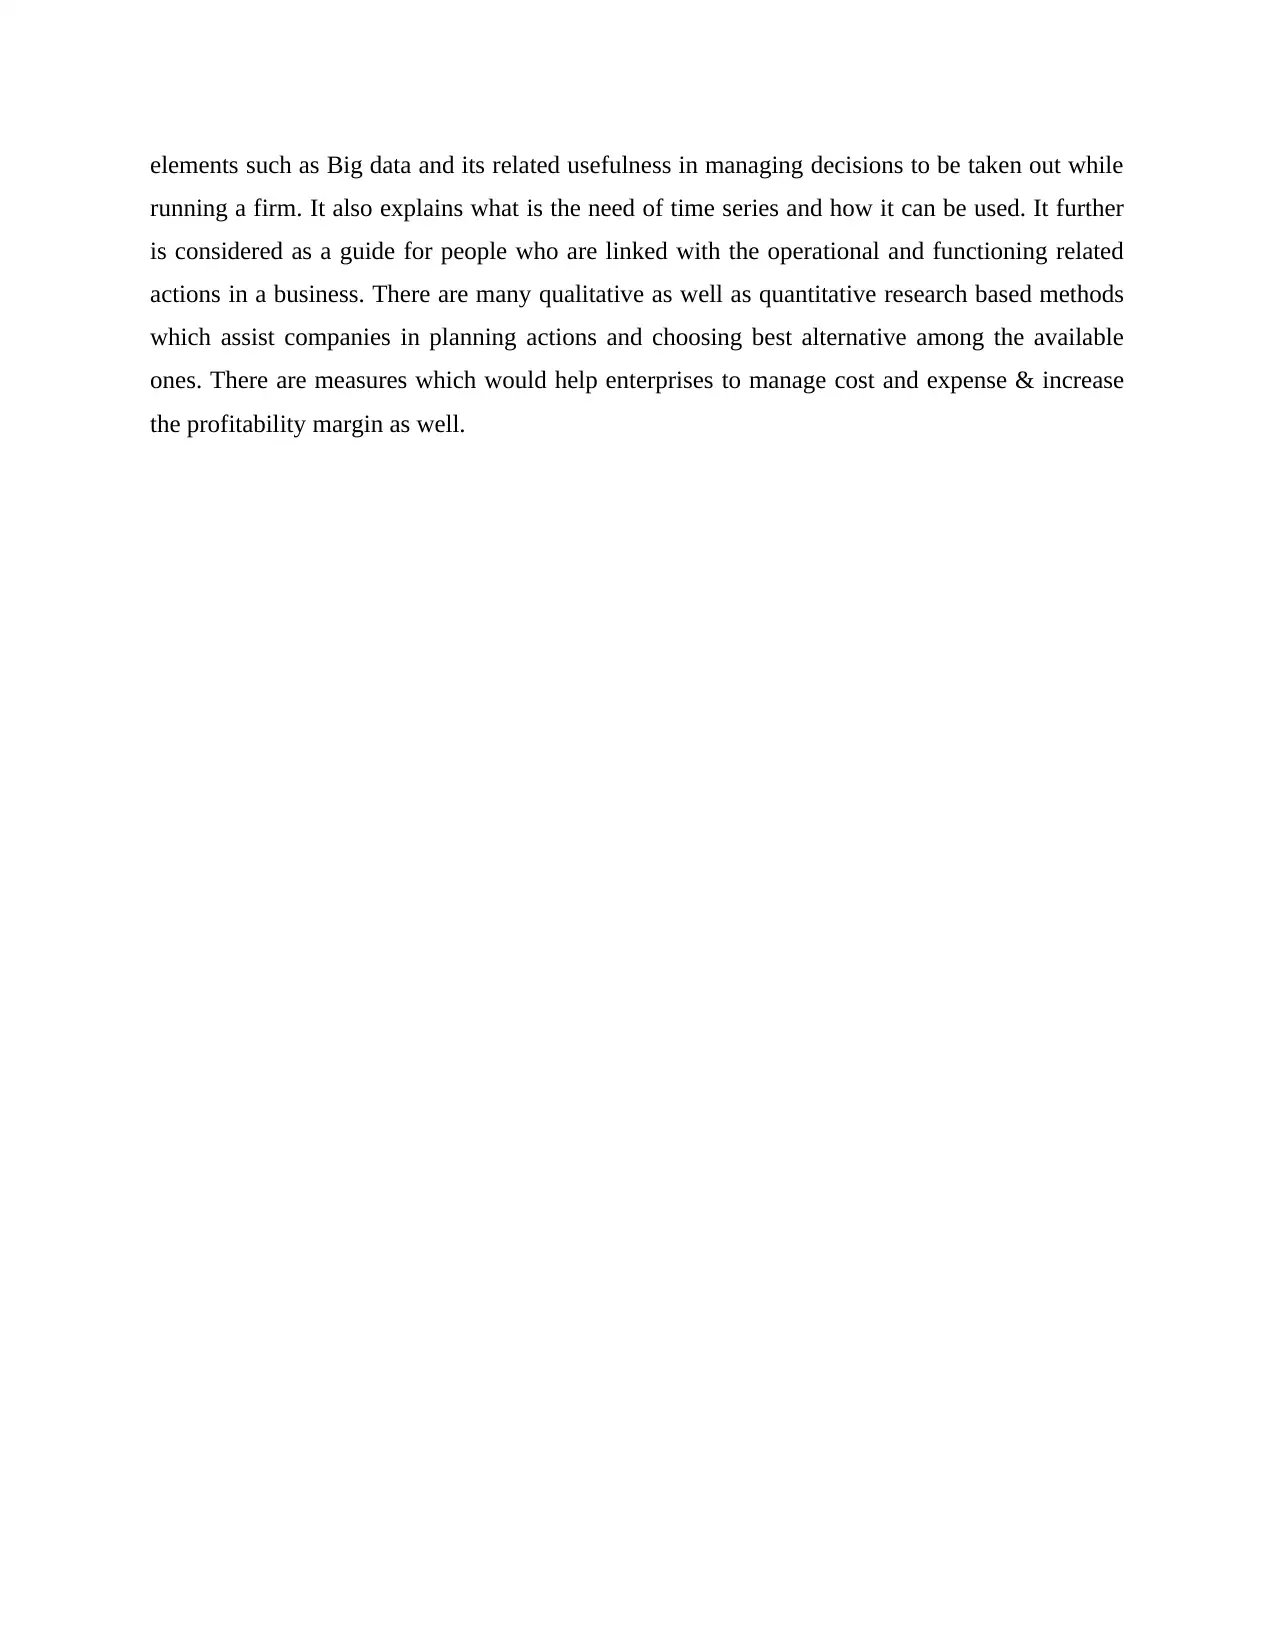
Comparision of the countries on the basis of
factors
South Africa Kenya
It might be seen from the above table and graphical depiction is that by virtue of South Africa,
the extents of central affinity have an ordinary of near 1 and 1.5 for all of the components. This
suggests that the ordinary figures have gone with the central decision which is "No impediment"
yet for the occurrence of Kenya, the results have changed for different factors.
As can be seen nicely from the table above, the graph depicts that, due to the goodness of South
Africa, the focal tilt has a habit of almost 1 and 1.5 overall. This suggests that habit numbers
have emerged with the Kenyan event's focus selection "without barriers", with results varying
due to a variety of factors
CONCLUSION
From the report prepared above it can be asserted that the company must assess the
environmental factors present in the market before planning any entry. The report must count
1.28144078
1
3.38461538
5
Customs and trade
regulations
1.09672482
4 1.7527894
Business Licensing Permit
1.12370505
8
1.74728997
3
Access to finance
1.24669738
9
2.20243279
6
Labour Regulation
1.12480974
1
1.64784946
2
Access to land
1.30916305
9
1.30916305
9
Political
Instability Customs and
trade
regulations
Business
Licensing
Permit
Access to
finance Labour
Regulation Access to
land
0
0.5
1
1.5
2
2.5
3
3.5
4
Comparision of the countries on the basis of
factors
South Africa Kenya
It might be seen from the above table and graphical depiction is that by virtue of South Africa,
the extents of central affinity have an ordinary of near 1 and 1.5 for all of the components. This
suggests that the ordinary figures have gone with the central decision which is "No impediment"
yet for the occurrence of Kenya, the results have changed for different factors.
As can be seen nicely from the table above, the graph depicts that, due to the goodness of South
Africa, the focal tilt has a habit of almost 1 and 1.5 overall. This suggests that habit numbers
have emerged with the Kenyan event's focus selection "without barriers", with results varying
due to a variety of factors
CONCLUSION
From the report prepared above it can be asserted that the company must assess the
environmental factors present in the market before planning any entry. The report must count
⊘ This is a preview!⊘
Do you want full access?
Subscribe today to unlock all pages.
Trusted by 1+ million students worldwide
elements such as Big data and its related usefulness in managing decisions to be taken out while
running a firm. It also explains what is the need of time series and how it can be used. It further
is considered as a guide for people who are linked with the operational and functioning related
actions in a business. There are many qualitative as well as quantitative research based methods
which assist companies in planning actions and choosing best alternative among the available
ones. There are measures which would help enterprises to manage cost and expense & increase
the profitability margin as well.
Paraphrase This Document
Need a fresh take? Get an instant paraphrase of this document with our AI Paraphraser
REFERENCES
Books and Journals
Buxbaum, J. And et.al., 2020. Qualitative and quantitative contrast-enhanced endoscopic
ultrasound improves evaluation of focal pancreatic lesions. Clinical Gastroenterology
and Hepatology, 18(4), pp.917-925.
Collingridge, D.S. and Gantt, E.E., 2019. Republished: The Quality of qualitative
research. American Journal of Medical Quality, 34(5), pp.439-445.
Drisko, J.W., 2020. Qualitative research synthesis: An appreciative and critical
introduction. Qualitative Social Work, 19(4), pp.736-753.
Fujs, D., Mihelič, A. and Vrhovec, S.L., 2019, August. The power of interpretation: Qualitative
methods in cybersecurity research. In Proceedings of the 14th International Conference
on Availability, Reliability and Security (pp. 1-10).
Gallina, B. And et.al., 2022. Multiconcern Dependability-Centered Assurance via Qualitative
and Quantitative Coanalysis. IEEE Software.
Hazrati, S. And et.al., 2018. Effect of different drying techniques on qualitative and quantitative
properties of Stachys Schtschegleevii essential oil. Journal of Food Processing and
Preservation, 42(8), p.e13686.
Li, H. And et.al., 2021. Development and validation of the Multidimensional Procrastination
Scale in Chinese: A comprehensive qualitative and quantitative investigation. European
Journal of Psychological Assessment.
Naydenova, S. And et.al., 2020. Qualitative and quantitative determination of polycyclic
aromatic hydrocarbons in fine particulate matter. Journal of Environmental Science and
Health, Part A, 55(4), pp.498-509.
Pankratova, N., Gorelova, G. and Pankratov, V., 2019, October. System approach to assessing of
the quantitative and qualitative characteristics of information. In Proceedings of the XI
International Scientific Conference Communicative Strategies of the Information
Society (pp. 1-6).
Schroers, G., Ross, J.G. and Moriarty, H., 2021. Nurses’ perceived causes of medication
administration errors: a qualitative systematic review. The Joint Commission Journal on
Quality and Patient Safety, 47(1), pp.38-53.
Slatnar, A and et.al., 2020. The effect of green cover within rows on the qualitative and
quantitative fruit parameters of full-cropping apple trees. Horticulture, Environment,
and Biotechnology, 61(1), pp.41-49.
Wang, Y. And et.al., 2018. Rapid qualitative and quantitative analysis of chlortetracycline
hydrochloride and tetracycline hydrochloride in environmental samples based on
terahertz frequency-domain spectroscopy. Talanta, 190, pp.284-291.
1 out of 11
Related Documents


Your All-in-One AI-Powered Toolkit for Academic Success.
+13062052269
info@desklib.com
Available 24*7 on WhatsApp / Email
![[object Object]](/_next/static/media/star-bottom.7253800d.svg)
Unlock your academic potential
Copyright © 2020–2026 A2Z Services. All Rights Reserved. Developed and managed by ZUCOL.