Performance Gap Analysis: Kering and LVMH Financial Comparison

Verified

Added on  2023/03/20

|5
|960
|52
Report
AI Summary
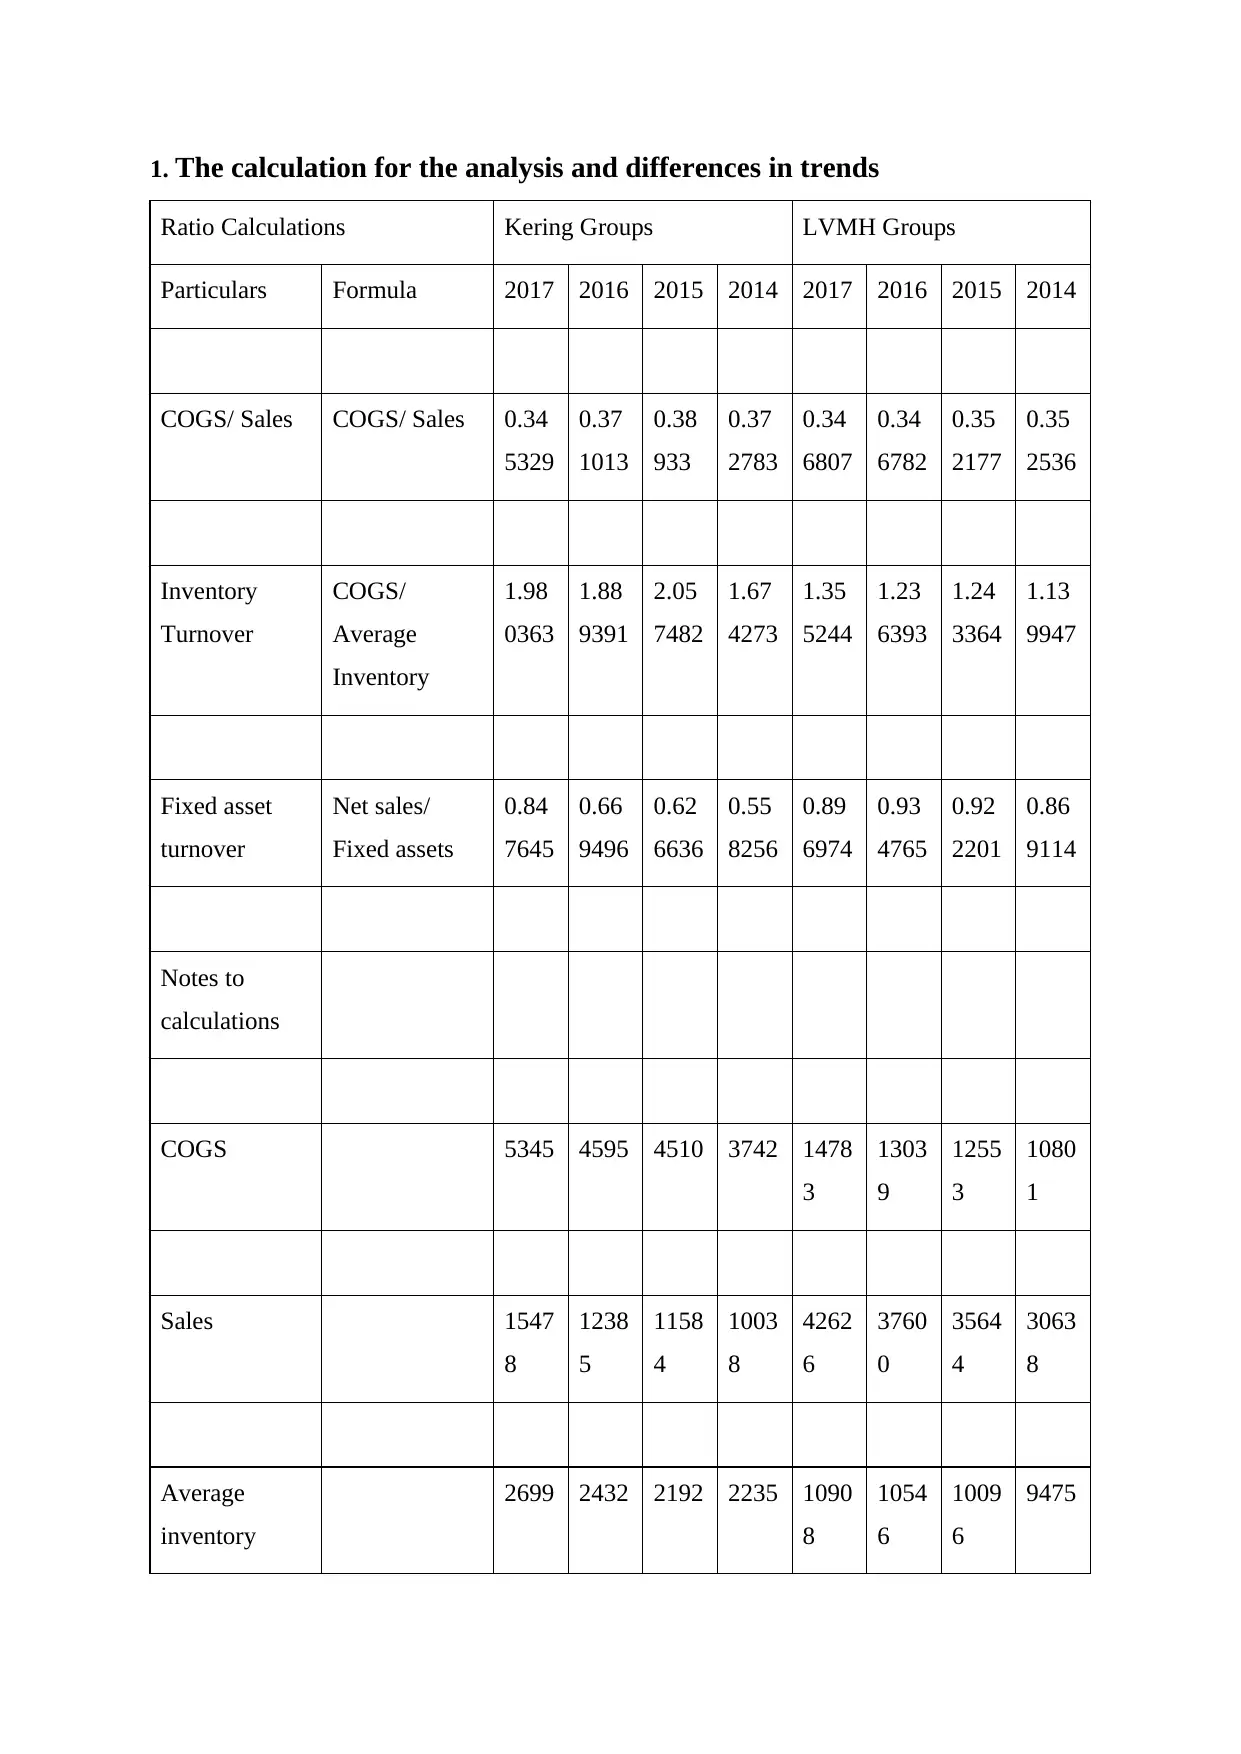
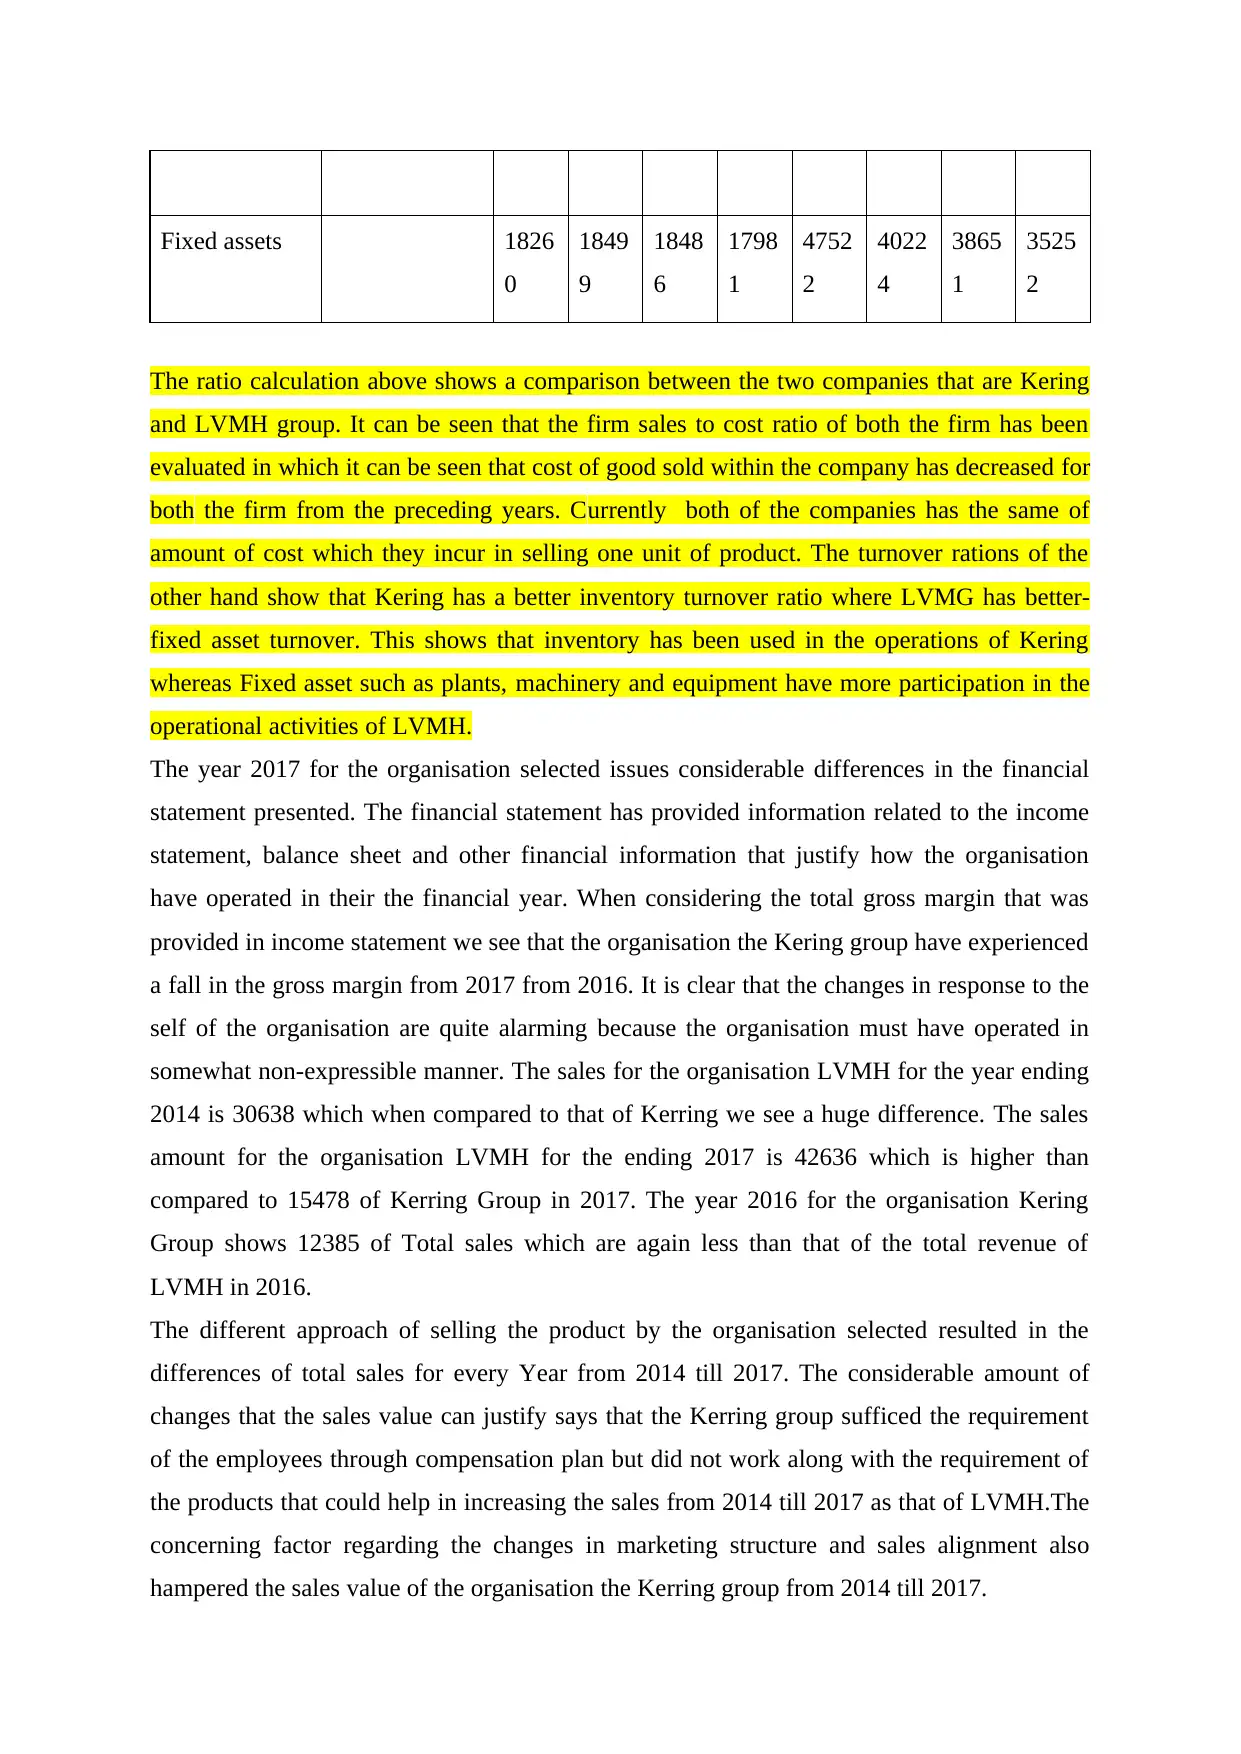
This report provides a comparative financial analysis of Kering and LVMH, focusing on key performance indicators (KPIs) such as COGS/Sales ratio, inventory turnover, and fixed asset turnover from 2014 to 2017. The analysis reveals trends and differences in the financial performance of both companies. The report highlights that while both firms experienced a decrease in their cost of goods sold (COGS) relative to sales, Kering demonstrated a better inventory turnover ratio, whereas LVMH showed a better fixed asset turnover. The report also discusses the impact of acquisitions and divestments by Kering, and how these strategic moves influenced the company's profit margins and overall financial health. Furthermore, the analysis explores how changes in marketing structures and sales alignment affected Kering's sales value compared to LVMH's. The report concludes with insights into the profit differentials between the two companies and the factors that contributed to the performance gaps observed during the period.
Document Page
PROBING THE PERFORMANCE GAP
tabler-icon-diamond-filled.svg

Paraphrase This Document

Need a fresh take? Get an instant paraphrase of this document with our AI Paraphraser
Document Page
Table of Contents
1. Calculation for the analysis and differences in trends 3
2. Insight on the profit and changes 4
Document Page
1. The calculation for the analysis and differences in trends
Ratio Calculations Kering Groups LVMH Groups
Particulars Formula 2017 2016 2015 2014 2017 2016 2015 2014
COGS/ Sales COGS/ Sales 0.34
5329
0.37
1013
0.38
933
0.37
2783
0.34
6807
0.34
6782
0.35
2177
0.35
2536
Inventory
Turnover
COGS/
Average
Inventory
1.98
0363
1.88
9391
2.05
7482
1.67
4273
1.35
5244
1.23
6393
1.24
3364
1.13
9947
Fixed asset
turnover
Net sales/
Fixed assets
0.84
7645
0.66
9496
0.62
6636
0.55
8256
0.89
6974
0.93
4765
0.92
2201
0.86
9114
Notes to
calculations
COGS 5345 4595 4510 3742 1478
3
1303
9
1255
3
1080
1
Sales 1547
8
1238
5
1158
4
1003
8
4262
6
3760
0
3564
4
3063
8
Average
inventory
2699 2432 2192 2235 1090
8
1054
6
1009
6
9475
Document Page
Fixed assets 1826
0
1849
9
1848
6
1798
1
4752
2
4022
4
3865
1
3525
2
The ratio calculation above shows a comparison between the two companies that are Kering
and LVMH group. It can be seen that the firm sales to cost ratio of both the firm has been
evaluated in which it can be seen that cost of good sold within the company has decreased for
both the firm from the preceding years. Currently both of the companies has the same of
amount of cost which they incur in selling one unit of product. The turnover rations of the
other hand show that Kering has a better inventory turnover ratio where LVMG has better-
fixed asset turnover. This shows that inventory has been used in the operations of Kering
whereas Fixed asset such as plants, machinery and equipment have more participation in the
operational activities of LVMH.
The year 2017 for the organisation selected issues considerable differences in the financial
statement presented. The financial statement has provided information related to the income
statement, balance sheet and other financial information that justify how the organisation
have operated in their the financial year. When considering the total gross margin that was
provided in income statement we see that the organisation the Kering group have experienced
a fall in the gross margin from 2017 from 2016. It is clear that the changes in response to the
self of the organisation are quite alarming because the organisation must have operated in
somewhat non-expressible manner. The sales for the organisation LVMH for the year ending
2014 is 30638 which when compared to that of Kerring we see a huge difference. The sales
amount for the organisation LVMH for the ending 2017 is 42636 which is higher than
compared to 15478 of Kerring Group in 2017. The year 2016 for the organisation Kering
Group shows 12385 of Total sales which are again less than that of the total revenue of
LVMH in 2016.
The different approach of selling the product by the organisation selected resulted in the
differences of total sales for every Year from 2014 till 2017. The considerable amount of
changes that the sales value can justify says that the Kerring group sufficed the requirement
of the employees through compensation plan but did not work along with the requirement of
the products that could help in increasing the sales from 2014 till 2017 as that of LVMH.The
concerning factor regarding the changes in marketing structure and sales alignment also
hampered the sales value of the organisation the Kerring group from 2014 till 2017.
tabler-icon-diamond-filled.svg

Paraphrase This Document

Need a fresh take? Get an instant paraphrase of this document with our AI Paraphraser
Document Page
2. Insight on the profit and changes
In response to the concerning profit as mentioned in the case study, we understand that there
has been acquisition by the organisation the Kering Group. The value of the deposition from
the year 1999 till 2017 has directly impacted the profit. The prophet value of the organisation
has started changing from 1999 with an acquisition of 42% of Gucci group which letter
increases to 100%. Considerable value in the sales of printeps printed and acquisition of
Puman by 62% in 2006 and 2007 respectively have hugely boosted the profit. The divestment
presented by the organisation in terms of Fnac in the year 2012 presented a concerning factor
to the organisation overall development. The availability of profit within the organisation was
not a present table in terms of a stronger unit since there were completed with proper
organisational operation management. The concerning factor of the organisation as per the
case study is also directed towards the acquisition of Cobra and Volcom which includes
sports material and equipment. Which joint venture with Yoonx in online sales for the luxury
brand has also boosted the profit securing position of the organisation. Repositioning of the
ownership of Gucci increment to 99.4% in 2004, did have a positive impact over the profit.
However, the sale of facet and Rexel made critical times for the earning of profit in a fluent
manner.
From the above analysis, we can now justify that the changes in the managerial group and the
ideas for the organisation the Kering Group have been the Prime result for the alarming
situation of traffic in some of the Year passed. The concerning Fact and inside gathered is
that the organisation from your 2014 to 2017 have stabilizer operation which can be justified
with the increasing growth of sales value but not as fast as that of LMVH which could have
been possible if there were no instability from the year 1999 to 2012.
chevron_up_icon
1 out of 5
circle_padding
hide_on_mobile
zoom_out_icon
[object Object]