Financial Analysis & Interpretation: A Comparative Study of KFC & BK

Verified

Added on  2023/06/13

|5
|330
|161
Report
AI Summary
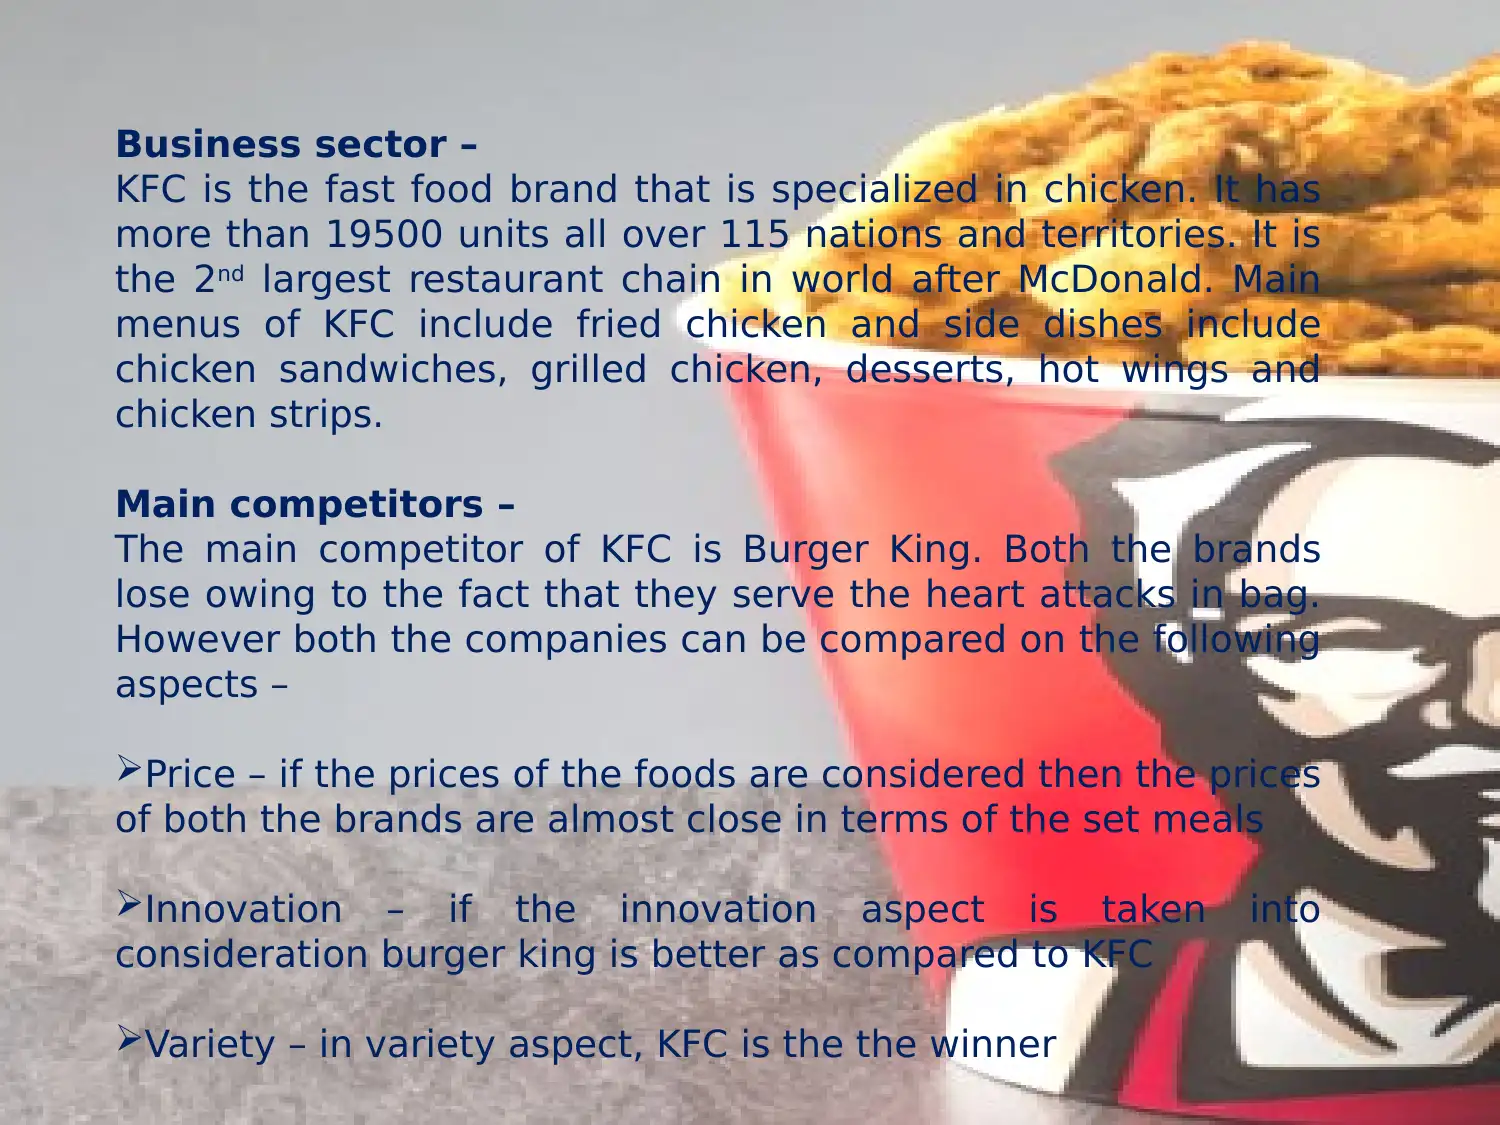
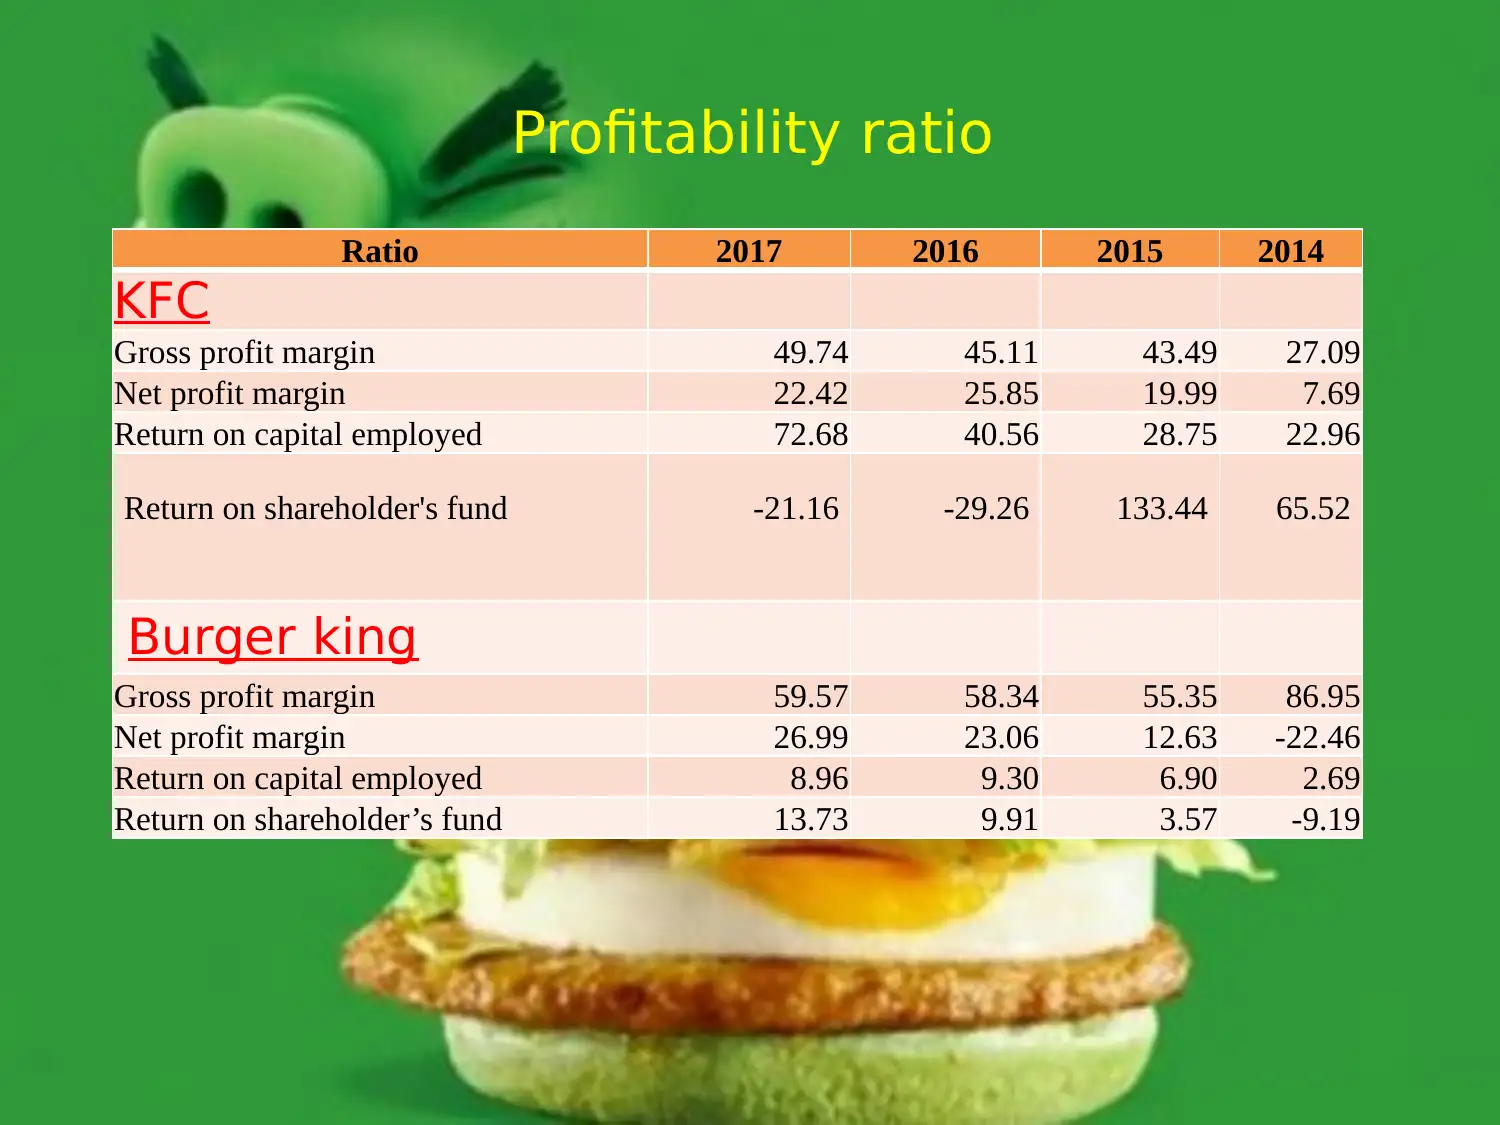
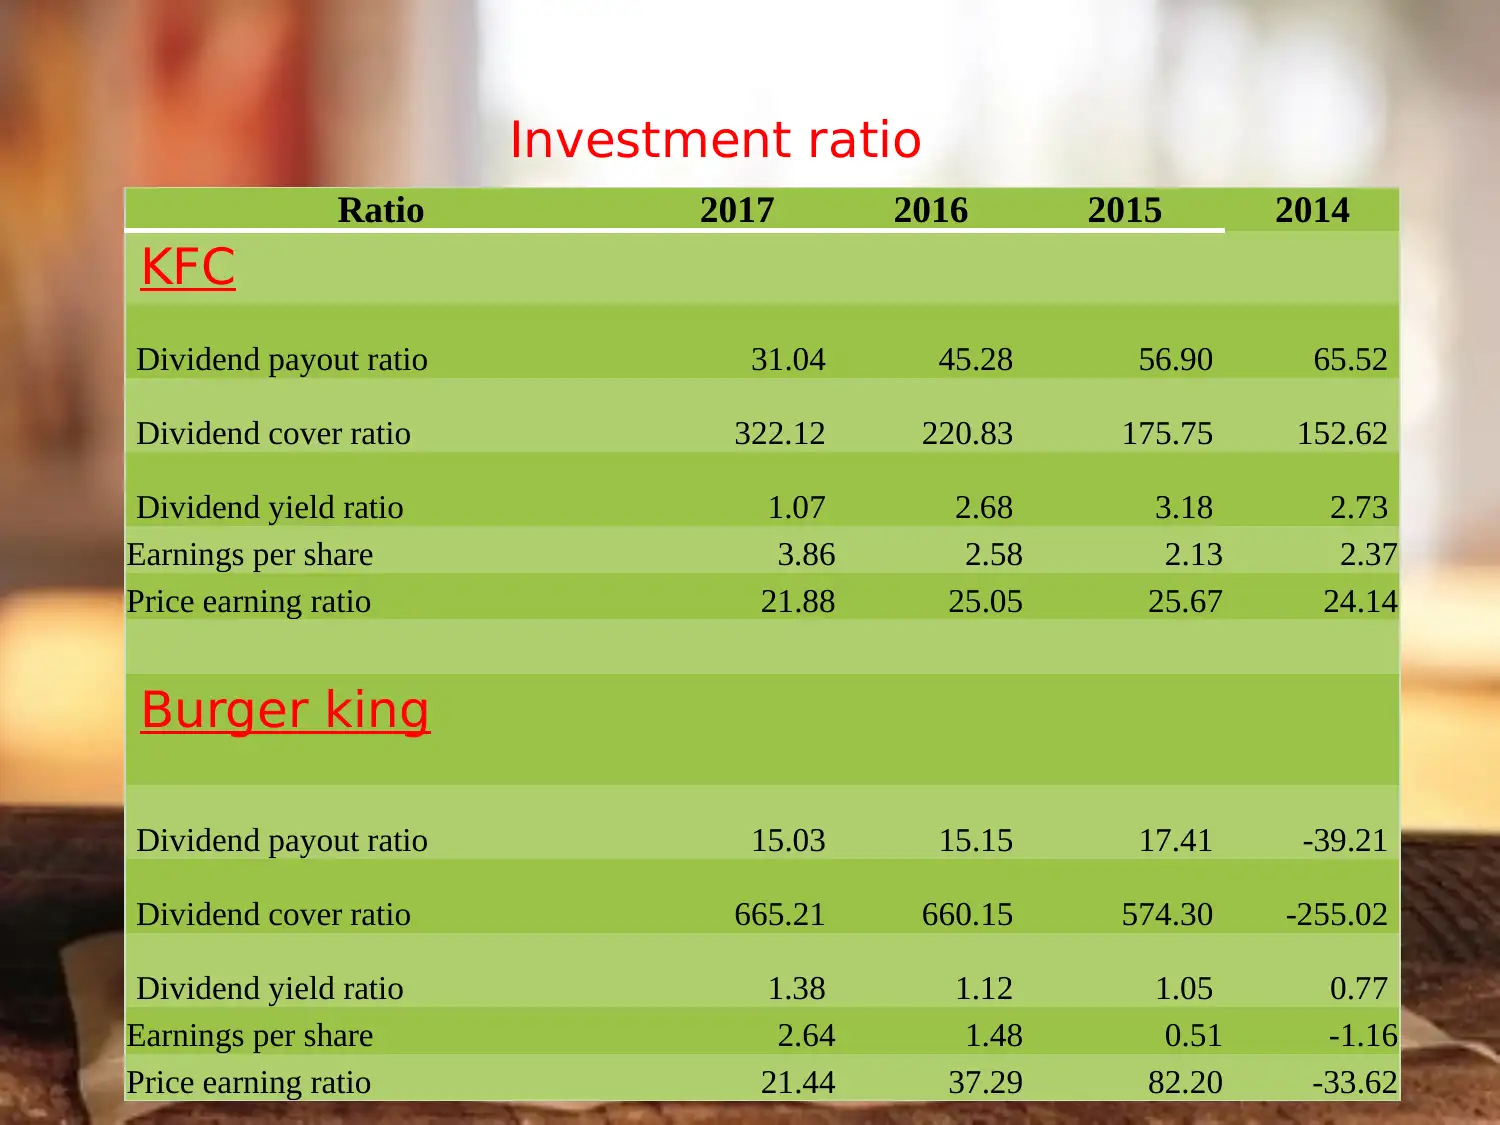
This report provides a financial analysis and interpretation comparing KFC and Burger King, two major players in the fast-food industry. The analysis includes a review of profitability ratios such as gross profit margin, net profit margin, return on capital employed, and return on shareholder's fund, as well as investment ratios like dividend payout ratio, dividend cover ratio, dividend yield ratio, earnings per share, and price-earnings ratio. Data from 2014 to 2017 is presented to illustrate trends and comparative performance. The report highlights the competitive landscape, noting Burger King's innovation and KFC's variety, and offers insights into the financial health and investment potential of both companies. Desklib provides access to this and many other solved assignments for students.
Document Page
Financial analysis and interpretation
Name of the student
Name of the university
Student ID
Author note
tabler-icon-diamond-filled.svg

Paraphrase This Document

Need a fresh take? Get an instant paraphrase of this document with our AI Paraphraser
Document Page
Business sector –
KFC is the fast food brand that is specialized in chicken. It has
more than 19500 units all over 115 nations and territories. It is
the 2nd largest restaurant chain in world after McDonald. Main
menus of KFC include fried chicken and side dishes include
chicken sandwiches, grilled chicken, desserts, hot wings and
chicken strips.
Main competitors –
The main competitor of KFC is Burger King. Both the brands
lose owing to the fact that they serve the heart attacks in bag.
However both the companies can be compared on the following
aspects –
Price – if the prices of the foods are considered then the prices
of both the brands are almost close in terms of the set meals
Innovation if the innovation aspect is taken into
consideration burger king is better as compared to KFC
Variety – in variety aspect, KFC is the the winner
Document Page
Ratio 2017 2016 2015 2014
KFC
Gross profit margin 49.74 45.11 43.49 27.09
Net profit margin 22.42 25.85 19.99 7.69
Return on capital employed 72.68 40.56 28.75 22.96
Return on shareholder's fund -21.16 -29.26 133.44 65.52
Burger king
Gross profit margin 59.57 58.34 55.35 86.95
Net profit margin 26.99 23.06 12.63 -22.46
Return on capital employed 8.96 9.30 6.90 2.69
Return on shareholder’s fund 13.73 9.91 3.57 -9.19
Profitability ratio
Document Page
Ratio 2017 2016 2015 2014
KFC
Dividend payout ratio 31.04 45.28 56.90 65.52
Dividend cover ratio 322.12 220.83 175.75 152.62
Dividend yield ratio 1.07 2.68 3.18 2.73
Earnings per share 3.86 2.58 2.13 2.37
Price earning ratio 21.88 25.05 25.67 24.14
Burger king
Dividend payout ratio 15.03 15.15 17.41 -39.21
Dividend cover ratio 665.21 660.15 574.30 -255.02
Dividend yield ratio 1.38 1.12 1.05 0.77
Earnings per share 2.64 1.48 0.51 -1.16
Price earning ratio 21.44 37.29 82.20 -33.62
Investment ratio
tabler-icon-diamond-filled.svg

Paraphrase This Document

Need a fresh take? Get an instant paraphrase of this document with our AI Paraphraser
Document Page
chevron_up_icon
1 out of 5
circle_padding
hide_on_mobile
zoom_out_icon
[object Object]