Business Decision Making Report
VerifiedAdded on 2019/12/03
|20
|4807
|2939
Report
AI Summary
This report uses statistical tools to analyze KFC's cash flows from 2011-2015. It begins by outlining a plan for collecting primary and secondary data, including sampling techniques and a questionnaire to gauge customer price preferences. The report then calculates and interprets measures of central tendency (mean, median, mode), dispersion (standard deviation, variance, range), and correlation between sales and profit. Quartiles and percentiles are also calculated. The analysis of the questionnaire results reveals customer priorities regarding price versus quality, age and price preference, and the relationship between income level and price preference. A trend line is used to forecast future cash flows. Finally, the report details the use of information processing tools (MIS, TPS, DSS) and project evaluation techniques (ARR, NPV, payback period, IRR) to assess the viability of a KFC project.
BUSINESS DECISON
MAKING
MAKING
Paraphrase This Document
Need a fresh take? Get an instant paraphrase of this document with our AI Paraphraser
TABLE OF CONTENTS
INTRODUCTION...........................................................................................................................1
TASK 1............................................................................................................................................1
1.1 Creation of plan for primary and secondary data.............................................................1
1.2 Sampling techniques.........................................................................................................2
1.3 Questionnaire to measure customer preference in terms of price....................................2
TASK 2............................................................................................................................................4
2.1 Creation of information for decision making by the managers........................................4
2.2 Analysis of data................................................................................................................5
2.3 Measures of dispersion.....................................................................................................5
2.4 Calculation of quartile and percentile..............................................................................6
TASK 3............................................................................................................................................8
3.1 Conclusions on the basis of questionnaire results............................................................8
3.2 Trend line for forecasting KFC cash flows....................................................................10
3.3 Covered in PPT...............................................................................................................11
3.4 Formal business report...................................................................................................11
TASK 4..........................................................................................................................................12
4.1 Use of information processing tools...............................................................................12
4.2 Critical path method.......................................................................................................13
4.3 Use of financial tools......................................................................................................13
CONCLUSION..............................................................................................................................16
REFERENCES..............................................................................................................................17
INDEX OF TABLES
Table 1: Calculation of Mean, median and mode of KFC from 2011-15........................................4
Table 2: Percentage change in cash flows from FY 2011-15..........................................................5
Table 3: Calculation of standard deviation......................................................................................5
Table 4: Calculation of quartile for FY 2011-15.............................................................................6
Table 5: Calculation of percentile for FY 2011-15..........................................................................6
Table 6: Calculation of correlation..................................................................................................7
Table 7: Average rate of return on KFC project............................................................................13
Table 8: NPV of KFC project........................................................................................................13
Table 9: Calculation of payback period of KFC project................................................................14
Table 10: Calculation of IRR of KFC project................................................................................14
ILLUSTRATION INDEX
Illustration 1: People priority on price over quality.........................................................................8
Illustration 2: People opinion about age and price preference.........................................................8
Illustration 3: People opinion about relevance on income level and their price preference...........9
Illustration 4: People opinion about price reduction by KFC on its products.................................9
Illustration 5: Trend line of KFC cash flows.................................................................................10
Illustration 6: Gantt chart of the project.........................................................................................12
Illustration 7: Critical path of the project.......................................................................................12
⊘ This is a preview!⊘
Do you want full access?
Subscribe today to unlock all pages.
Trusted by 1+ million students worldwide
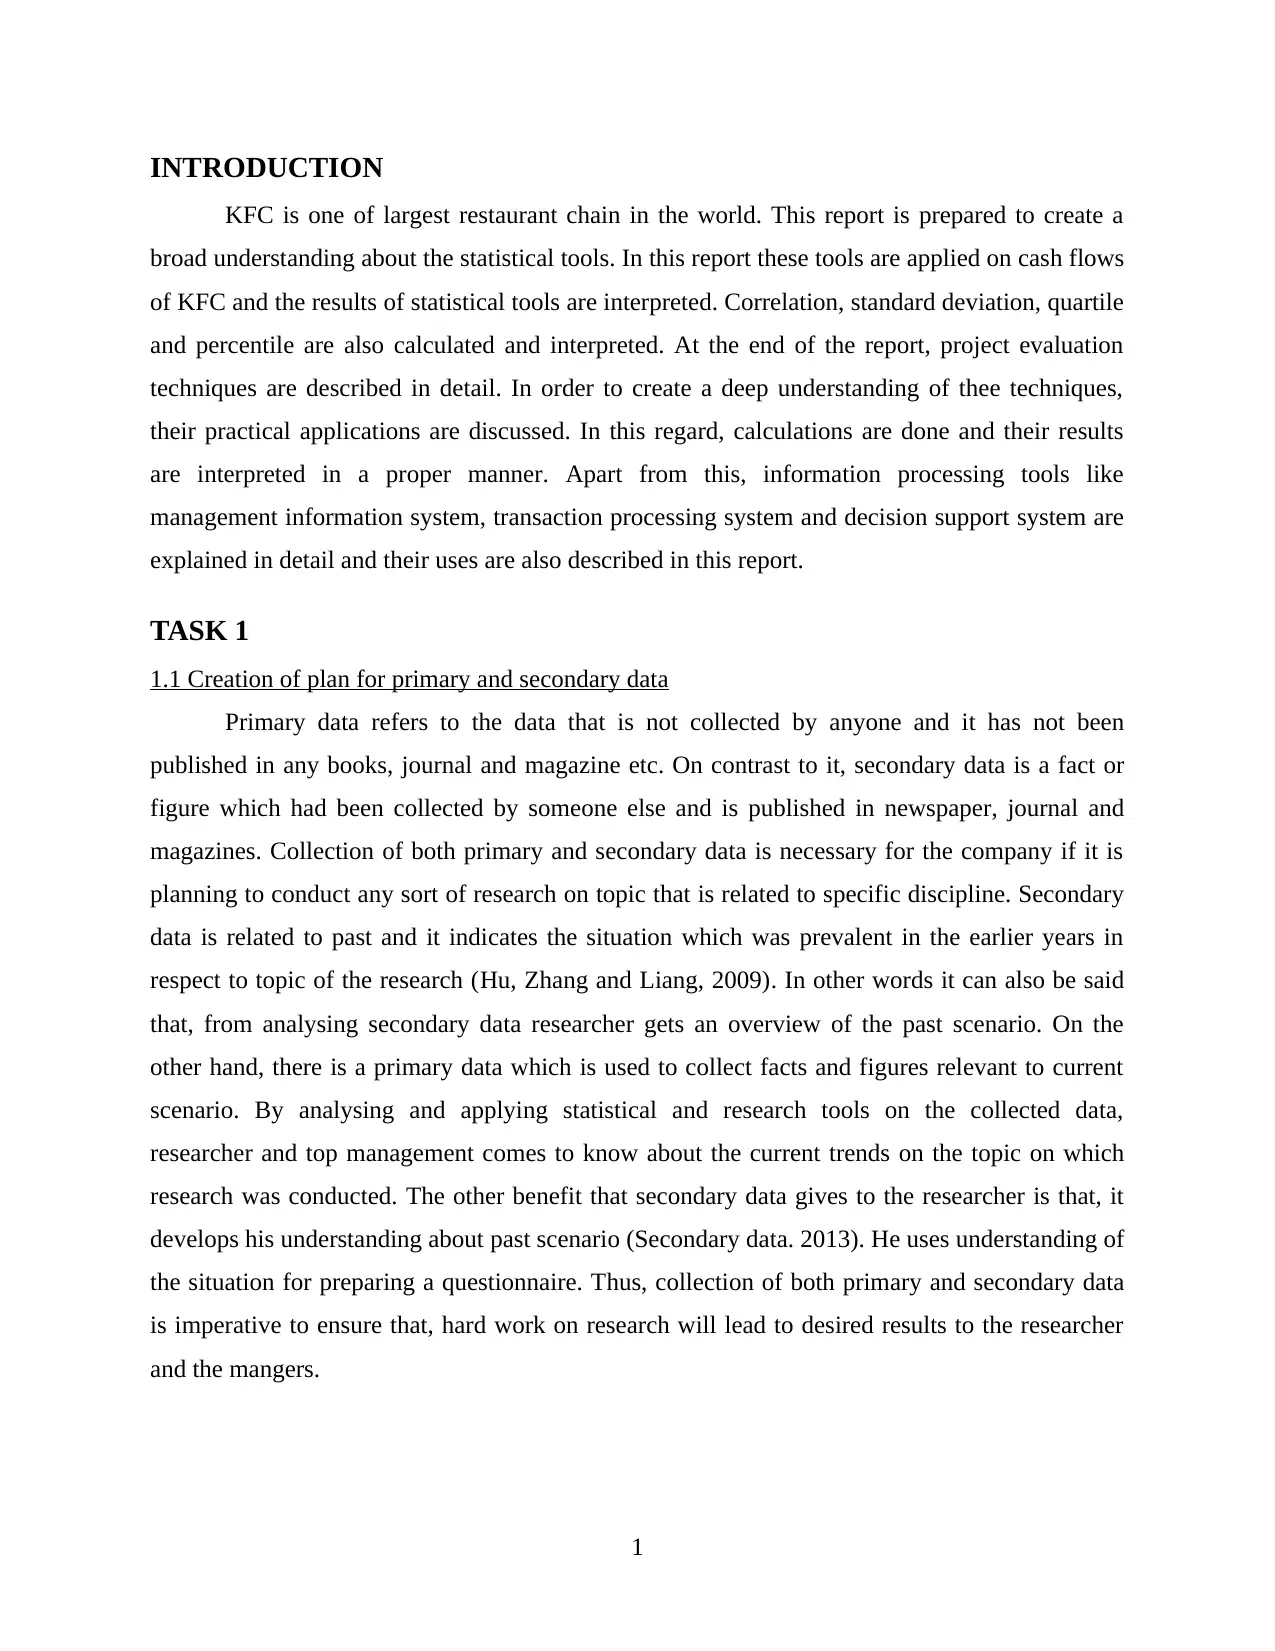
INTRODUCTION
KFC is one of largest restaurant chain in the world. This report is prepared to create a
broad understanding about the statistical tools. In this report these tools are applied on cash flows
of KFC and the results of statistical tools are interpreted. Correlation, standard deviation, quartile
and percentile are also calculated and interpreted. At the end of the report, project evaluation
techniques are described in detail. In order to create a deep understanding of thee techniques,
their practical applications are discussed. In this regard, calculations are done and their results
are interpreted in a proper manner. Apart from this, information processing tools like
management information system, transaction processing system and decision support system are
explained in detail and their uses are also described in this report.
TASK 1
1.1 Creation of plan for primary and secondary data
Primary data refers to the data that is not collected by anyone and it has not been
published in any books, journal and magazine etc. On contrast to it, secondary data is a fact or
figure which had been collected by someone else and is published in newspaper, journal and
magazines. Collection of both primary and secondary data is necessary for the company if it is
planning to conduct any sort of research on topic that is related to specific discipline. Secondary
data is related to past and it indicates the situation which was prevalent in the earlier years in
respect to topic of the research (Hu, Zhang and Liang, 2009). In other words it can also be said
that, from analysing secondary data researcher gets an overview of the past scenario. On the
other hand, there is a primary data which is used to collect facts and figures relevant to current
scenario. By analysing and applying statistical and research tools on the collected data,
researcher and top management comes to know about the current trends on the topic on which
research was conducted. The other benefit that secondary data gives to the researcher is that, it
develops his understanding about past scenario (Secondary data. 2013). He uses understanding of
the situation for preparing a questionnaire. Thus, collection of both primary and secondary data
is imperative to ensure that, hard work on research will lead to desired results to the researcher
and the mangers.
1
Paraphrase This Document
Need a fresh take? Get an instant paraphrase of this document with our AI Paraphraser
1.2 Sampling techniques
For getting a better result on the research it is necessary that, researcher must collect
research data from the suitable respondents. If same does not happen then, researcher will not get
an optimum result on the research and managers will certainly take wrong decisions regarding
product manufacturing or marketing (Laitinen and Saarti, 2012). Thus, it is imperative for the
researcher to collect right respondents. In order to avoid mentioned mistakes researcher use
sampling techniques that helps them in collecting most suitable sample of the respondents.
Following are the techniques which can be used for this purpose.
1. Simple random sampling- In this method, sampling units are taken randomly by the
researcher from the given population. This method is employed when researcher do not
need specific category of the people as their respondent.
2. Stratified random sampling- In this method, whole population is divided into several
strata's and sample units which are taken from these sub division of population on
random basis (Simon and Cao, 2012). This method is used when response is needed from
the people that belong to different geographical areas and income level.
3. Cluster sampling- Under this method, entire population is divided on the basis of
homogeneous groups. After classifying entire population a sample is taken from these
clusters on random basis.
1.3 Questionnaire to measure customer preference in terms of price
Name
Age:
20- 40 age
40-60 age
60-80 age
Gender
Male
Female
Transgender
Marital status
Married
Unmarried
2
Divorced
What is your income level?
500-1500
1500-2500
2500-3500
3500- 4500
While making purchase decision do you give priority to price over quality?
Yes
No
Do you think that with increase in age people prefer to consume cheaper fast food items?
Yes
No
Do you think that income level has some relevance with your pricing preference?
Yes
No
How many times in a year you visit KFC restaurant?
5 times
10 times
15 times
More than 15 times
Do you think KFC charge a high price for its fast food items?
Strongly agree
Agree
Somewhat agree
Disagree
Strongly disagree
In case of high price do you like to visit KFC restaurant?
Yes
No
Do you think KFC should reduce price of its products.
Strongly agree
3
⊘ This is a preview!⊘
Do you want full access?
Subscribe today to unlock all pages.
Trusted by 1+ million students worldwide
Agree
Somewhat agree
Disagree
Strongly disagree
Give your feedback regarding services and products of KFC restaurant.
TASK 2
2.1 Creation of information for decision making by the managers
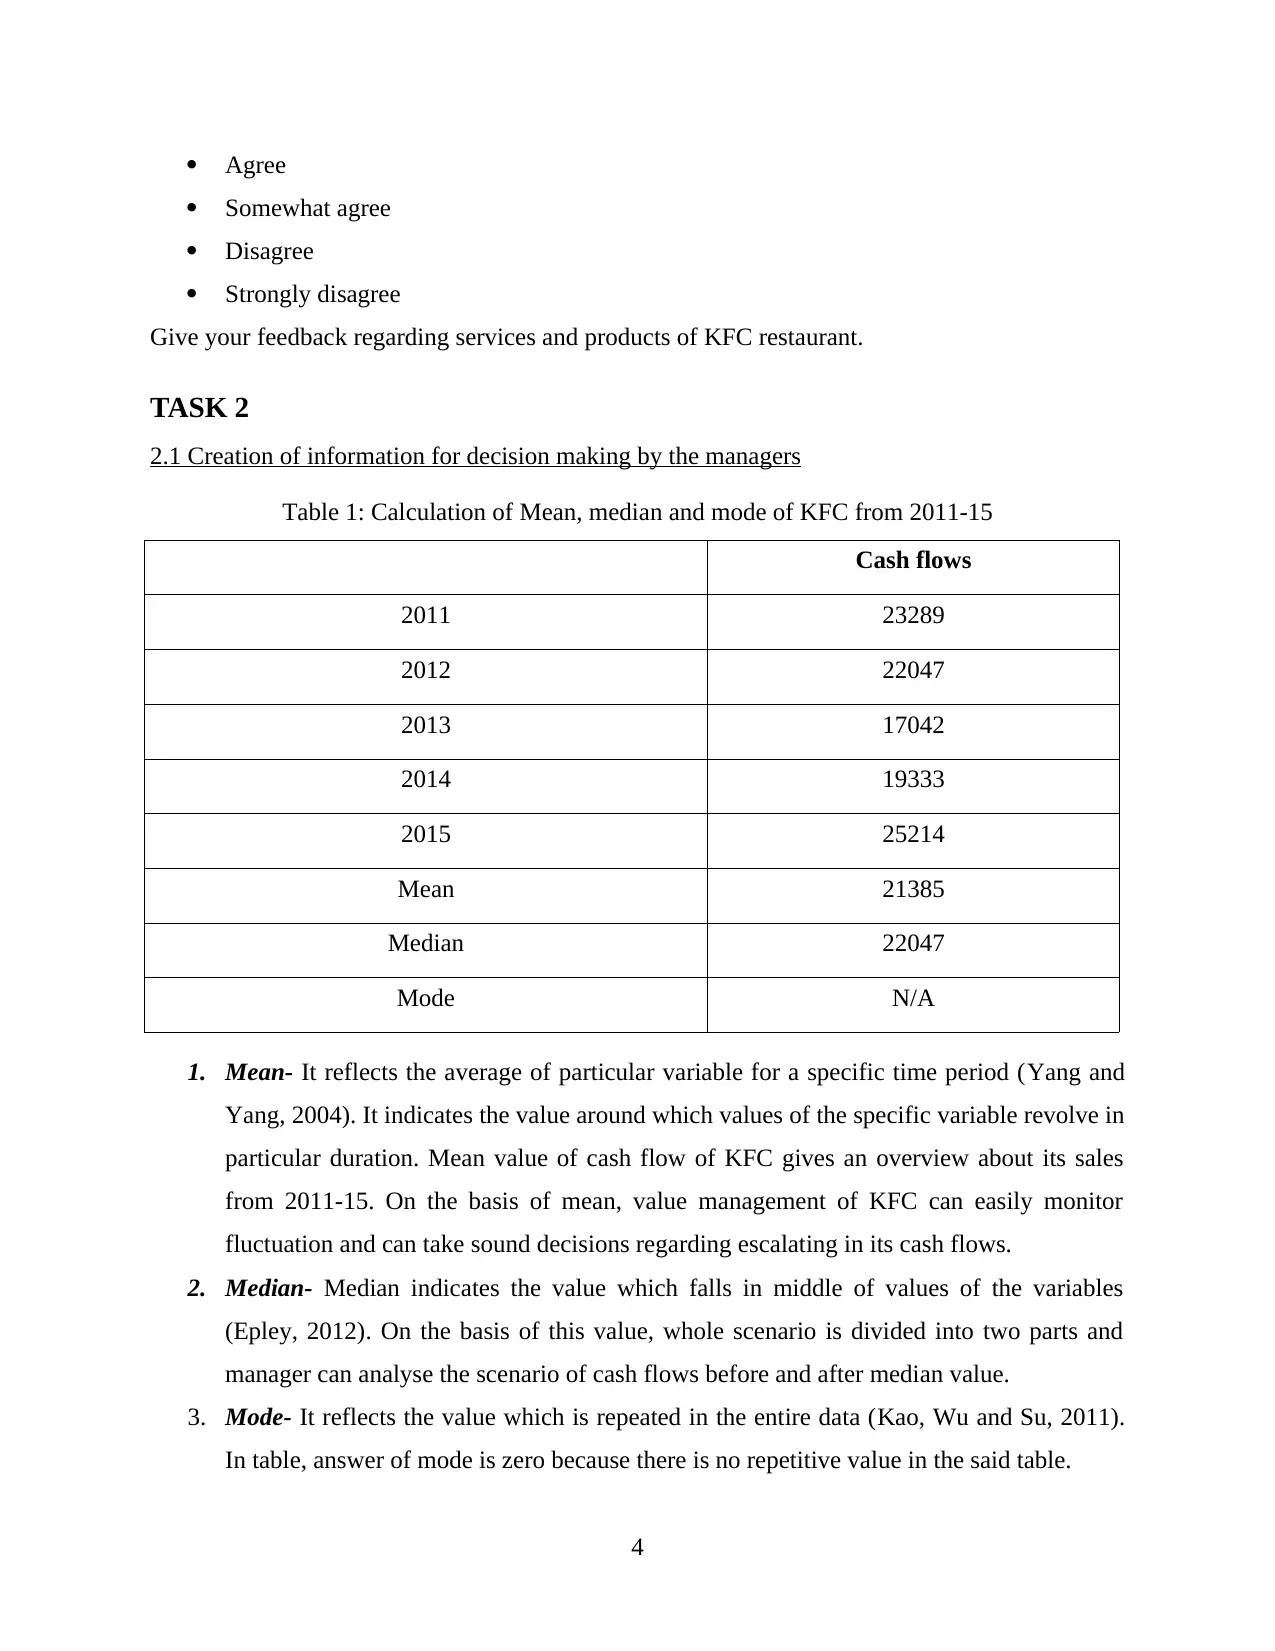
Table 1: Calculation of Mean, median and mode of KFC from 2011-15
Cash flows
2011 23289
2012 22047
2013 17042
2014 19333
2015 25214
Mean 21385
Median 22047
Mode N/A
1. Mean- It reflects the average of particular variable for a specific time period (Yang and
Yang, 2004). It indicates the value around which values of the specific variable revolve in
particular duration. Mean value of cash flow of KFC gives an overview about its sales
from 2011-15. On the basis of mean, value management of KFC can easily monitor
fluctuation and can take sound decisions regarding escalating in its cash flows.
2. Median- Median indicates the value which falls in middle of values of the variables
(Epley, 2012). On the basis of this value, whole scenario is divided into two parts and
manager can analyse the scenario of cash flows before and after median value.
3. Mode- It reflects the value which is repeated in the entire data (Kao, Wu and Su, 2011).
In table, answer of mode is zero because there is no repetitive value in the said table.
4
Somewhat agree
Disagree
Strongly disagree
Give your feedback regarding services and products of KFC restaurant.
TASK 2
2.1 Creation of information for decision making by the managers
Table 1: Calculation of Mean, median and mode of KFC from 2011-15
Cash flows
2011 23289
2012 22047
2013 17042
2014 19333
2015 25214
Mean 21385
Median 22047
Mode N/A
1. Mean- It reflects the average of particular variable for a specific time period (Yang and
Yang, 2004). It indicates the value around which values of the specific variable revolve in
particular duration. Mean value of cash flow of KFC gives an overview about its sales
from 2011-15. On the basis of mean, value management of KFC can easily monitor
fluctuation and can take sound decisions regarding escalating in its cash flows.
2. Median- Median indicates the value which falls in middle of values of the variables
(Epley, 2012). On the basis of this value, whole scenario is divided into two parts and
manager can analyse the scenario of cash flows before and after median value.
3. Mode- It reflects the value which is repeated in the entire data (Kao, Wu and Su, 2011).
In table, answer of mode is zero because there is no repetitive value in the said table.
4
Paraphrase This Document
Need a fresh take? Get an instant paraphrase of this document with our AI Paraphraser
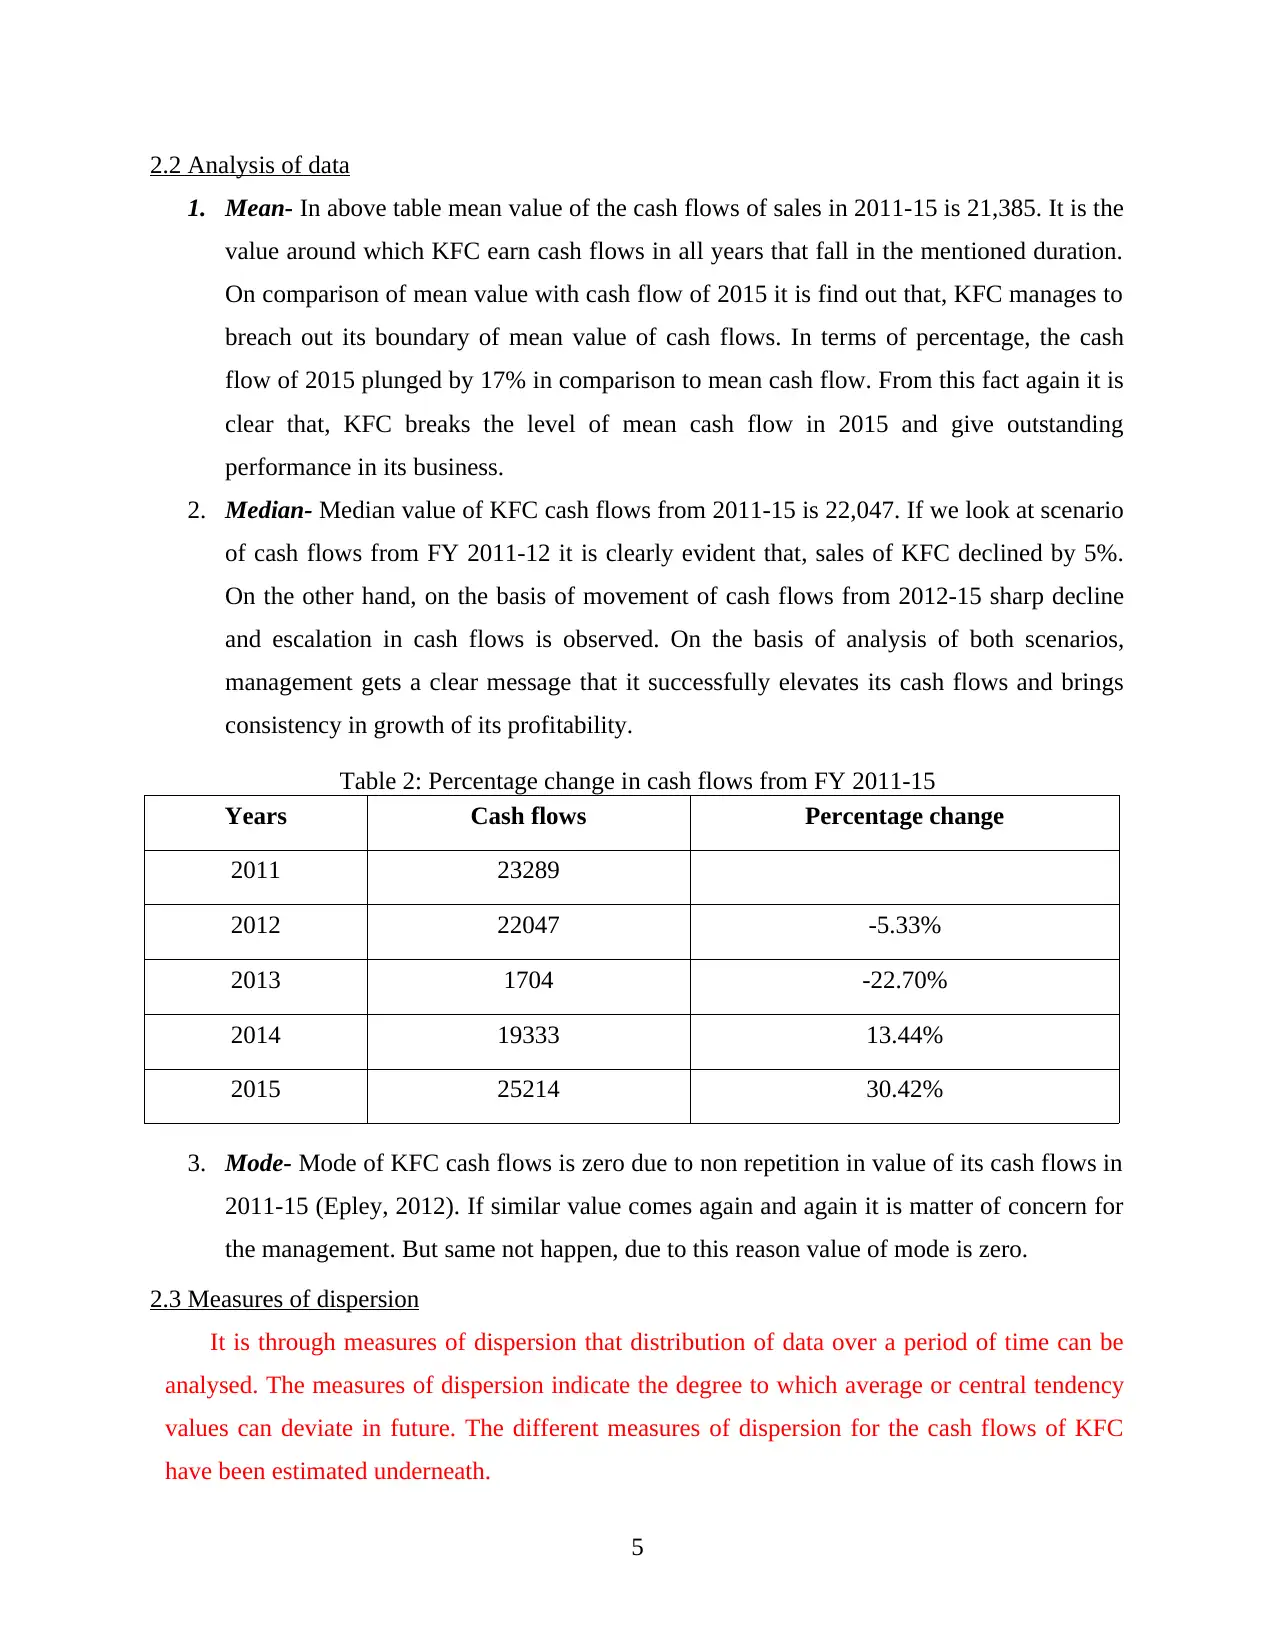
2.2 Analysis of data
1. Mean- In above table mean value of the cash flows of sales in 2011-15 is 21,385. It is the
value around which KFC earn cash flows in all years that fall in the mentioned duration.
On comparison of mean value with cash flow of 2015 it is find out that, KFC manages to
breach out its boundary of mean value of cash flows. In terms of percentage, the cash
flow of 2015 plunged by 17% in comparison to mean cash flow. From this fact again it is
clear that, KFC breaks the level of mean cash flow in 2015 and give outstanding
performance in its business.
2. Median- Median value of KFC cash flows from 2011-15 is 22,047. If we look at scenario
of cash flows from FY 2011-12 it is clearly evident that, sales of KFC declined by 5%.
On the other hand, on the basis of movement of cash flows from 2012-15 sharp decline
and escalation in cash flows is observed. On the basis of analysis of both scenarios,
management gets a clear message that it successfully elevates its cash flows and brings
consistency in growth of its profitability.
Table 2: Percentage change in cash flows from FY 2011-15
Years Cash flows Percentage change
2011 23289
2012 22047 -5.33%
2013 1704 -22.70%
2014 19333 13.44%
2015 25214 30.42%
3. Mode- Mode of KFC cash flows is zero due to non repetition in value of its cash flows in
2011-15 (Epley, 2012). If similar value comes again and again it is matter of concern for
the management. But same not happen, due to this reason value of mode is zero.
2.3 Measures of dispersion
It is through measures of dispersion that distribution of data over a period of time can be
analysed. The measures of dispersion indicate the degree to which average or central tendency
values can deviate in future. The different measures of dispersion for the cash flows of KFC
have been estimated underneath.
5
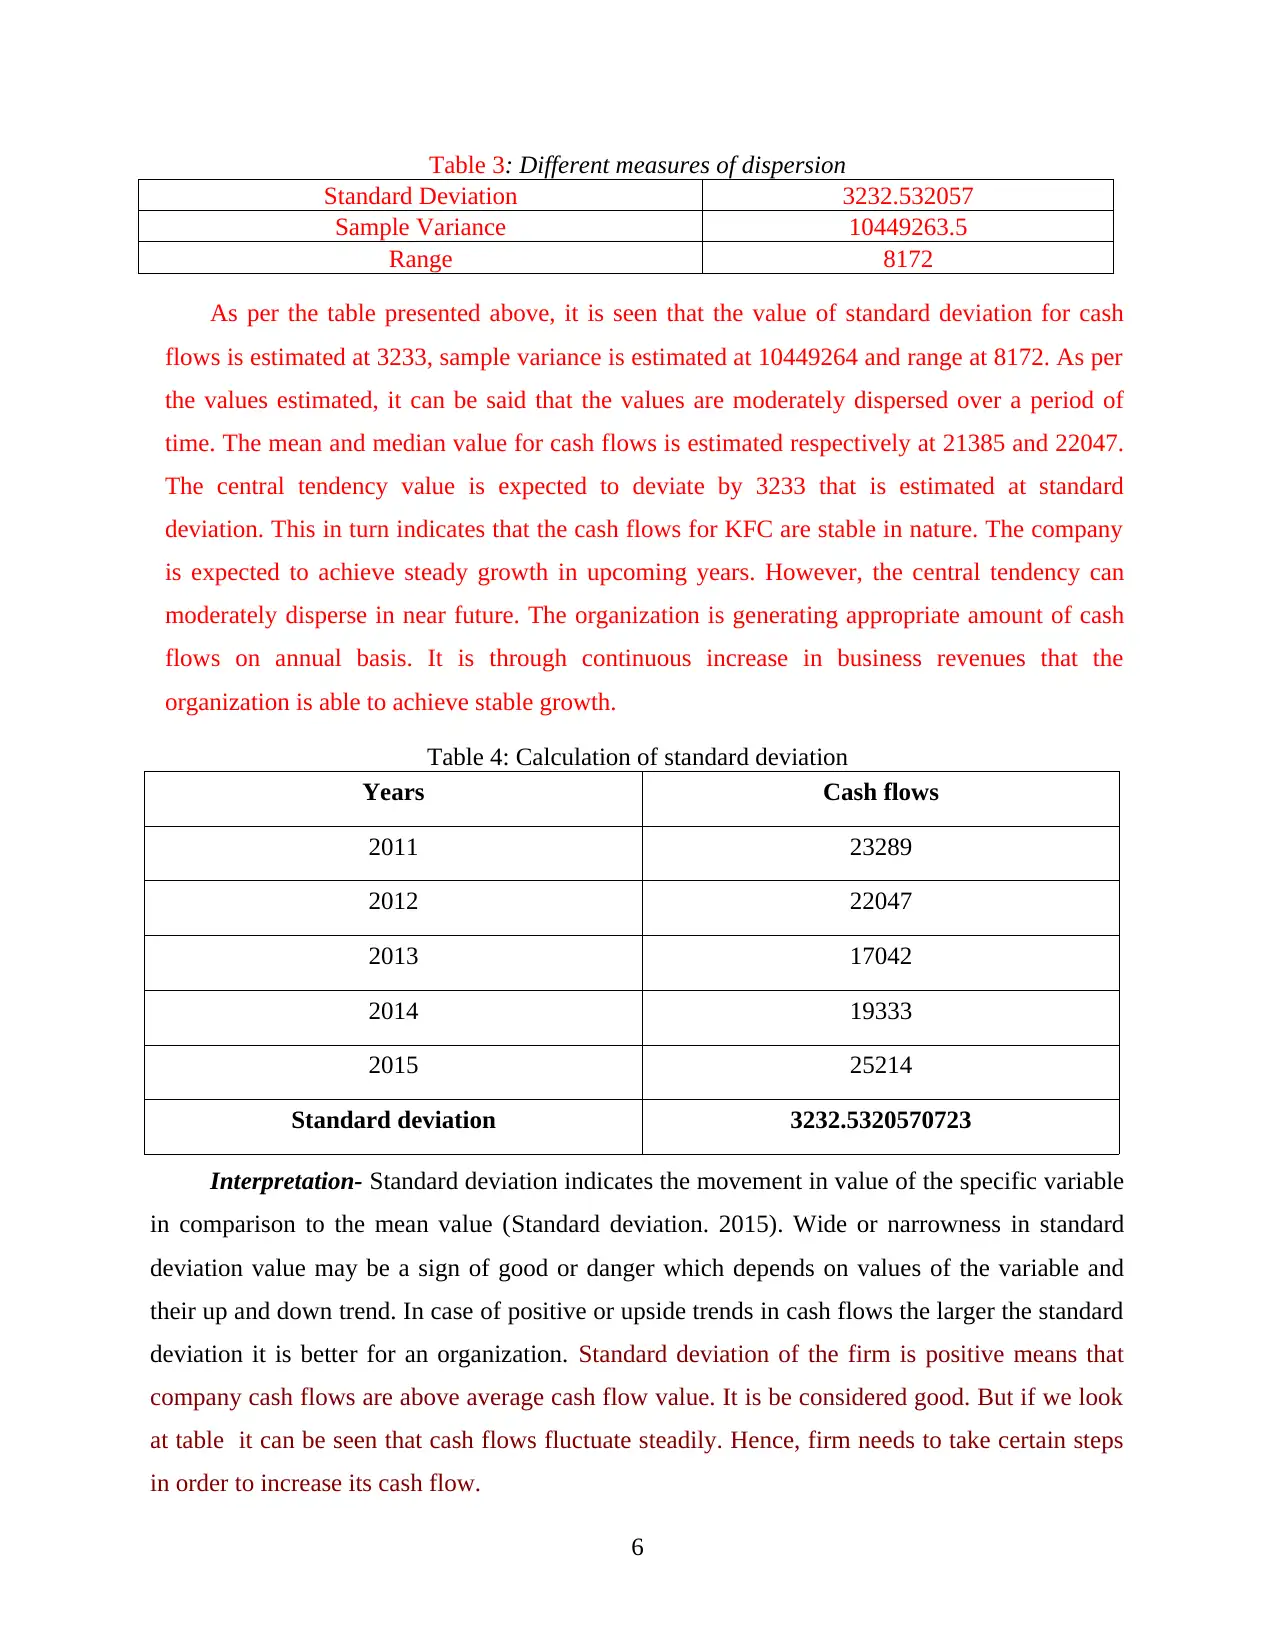
Table 3: Different measures of dispersion
Standard Deviation 3232.532057
Sample Variance 10449263.5
Range 8172
As per the table presented above, it is seen that the value of standard deviation for cash
flows is estimated at 3233, sample variance is estimated at 10449264 and range at 8172. As per
the values estimated, it can be said that the values are moderately dispersed over a period of
time. The mean and median value for cash flows is estimated respectively at 21385 and 22047.
The central tendency value is expected to deviate by 3233 that is estimated at standard
deviation. This in turn indicates that the cash flows for KFC are stable in nature. The company
is expected to achieve steady growth in upcoming years. However, the central tendency can
moderately disperse in near future. The organization is generating appropriate amount of cash
flows on annual basis. It is through continuous increase in business revenues that the
organization is able to achieve stable growth.
Table 4: Calculation of standard deviation
Years Cash flows
2011 23289
2012 22047
2013 17042
2014 19333
2015 25214
Standard deviation 3232.5320570723
Interpretation- Standard deviation indicates the movement in value of the specific variable
in comparison to the mean value (Standard deviation. 2015). Wide or narrowness in standard
deviation value may be a sign of good or danger which depends on values of the variable and
their up and down trend. In case of positive or upside trends in cash flows the larger the standard
deviation it is better for an organization. Standard deviation of the firm is positive means that
company cash flows are above average cash flow value. It is be considered good. But if we look
at table it can be seen that cash flows fluctuate steadily. Hence, firm needs to take certain steps
in order to increase its cash flow.
6
⊘ This is a preview!⊘
Do you want full access?
Subscribe today to unlock all pages.
Trusted by 1+ million students worldwide
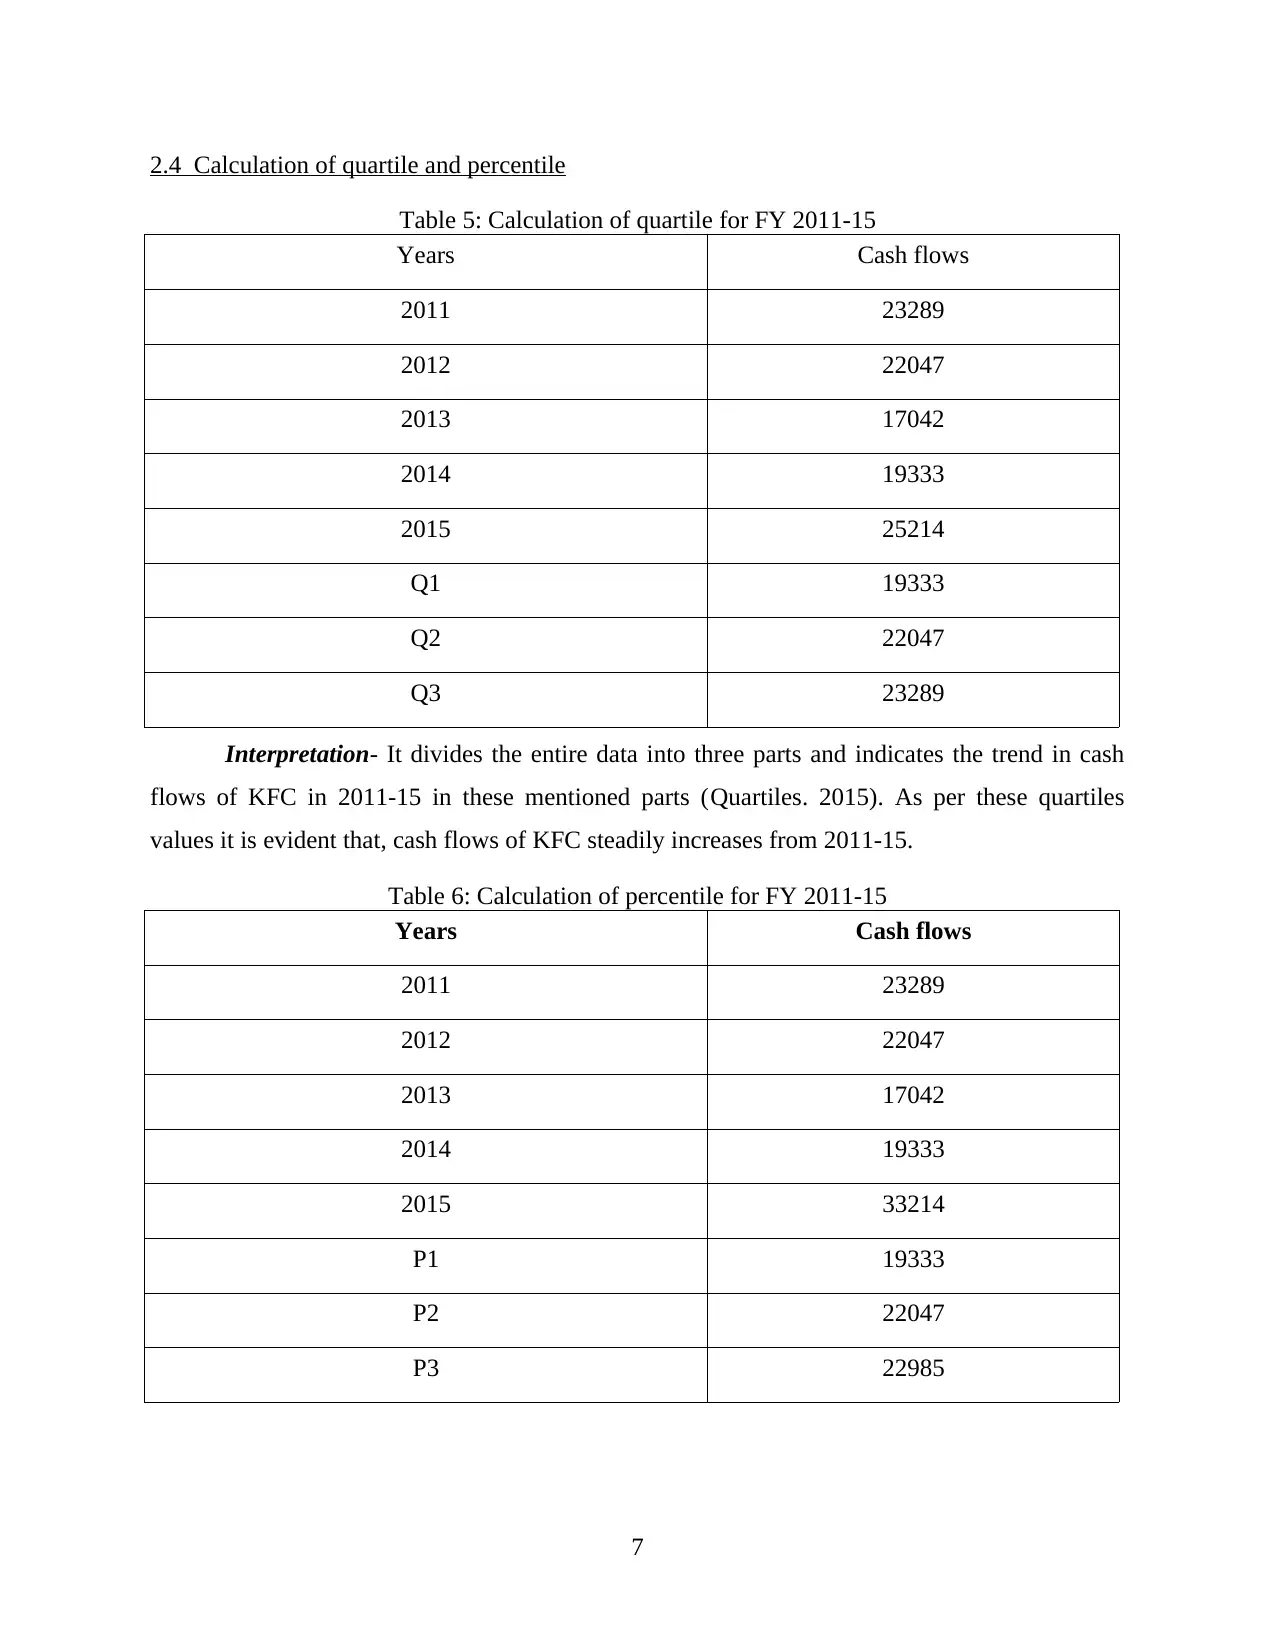
2.4 Calculation of quartile and percentile
Table 5: Calculation of quartile for FY 2011-15
Years Cash flows
2011 23289
2012 22047
2013 17042
2014 19333
2015 25214
Q1 19333
Q2 22047
Q3 23289
Interpretation- It divides the entire data into three parts and indicates the trend in cash
flows of KFC in 2011-15 in these mentioned parts (Quartiles. 2015). As per these quartiles
values it is evident that, cash flows of KFC steadily increases from 2011-15.
Table 6: Calculation of percentile for FY 2011-15
Years Cash flows
2011 23289
2012 22047
2013 17042
2014 19333
2015 33214
P1 19333
P2 22047
P3 22985
7
Paraphrase This Document
Need a fresh take? Get an instant paraphrase of this document with our AI Paraphraser
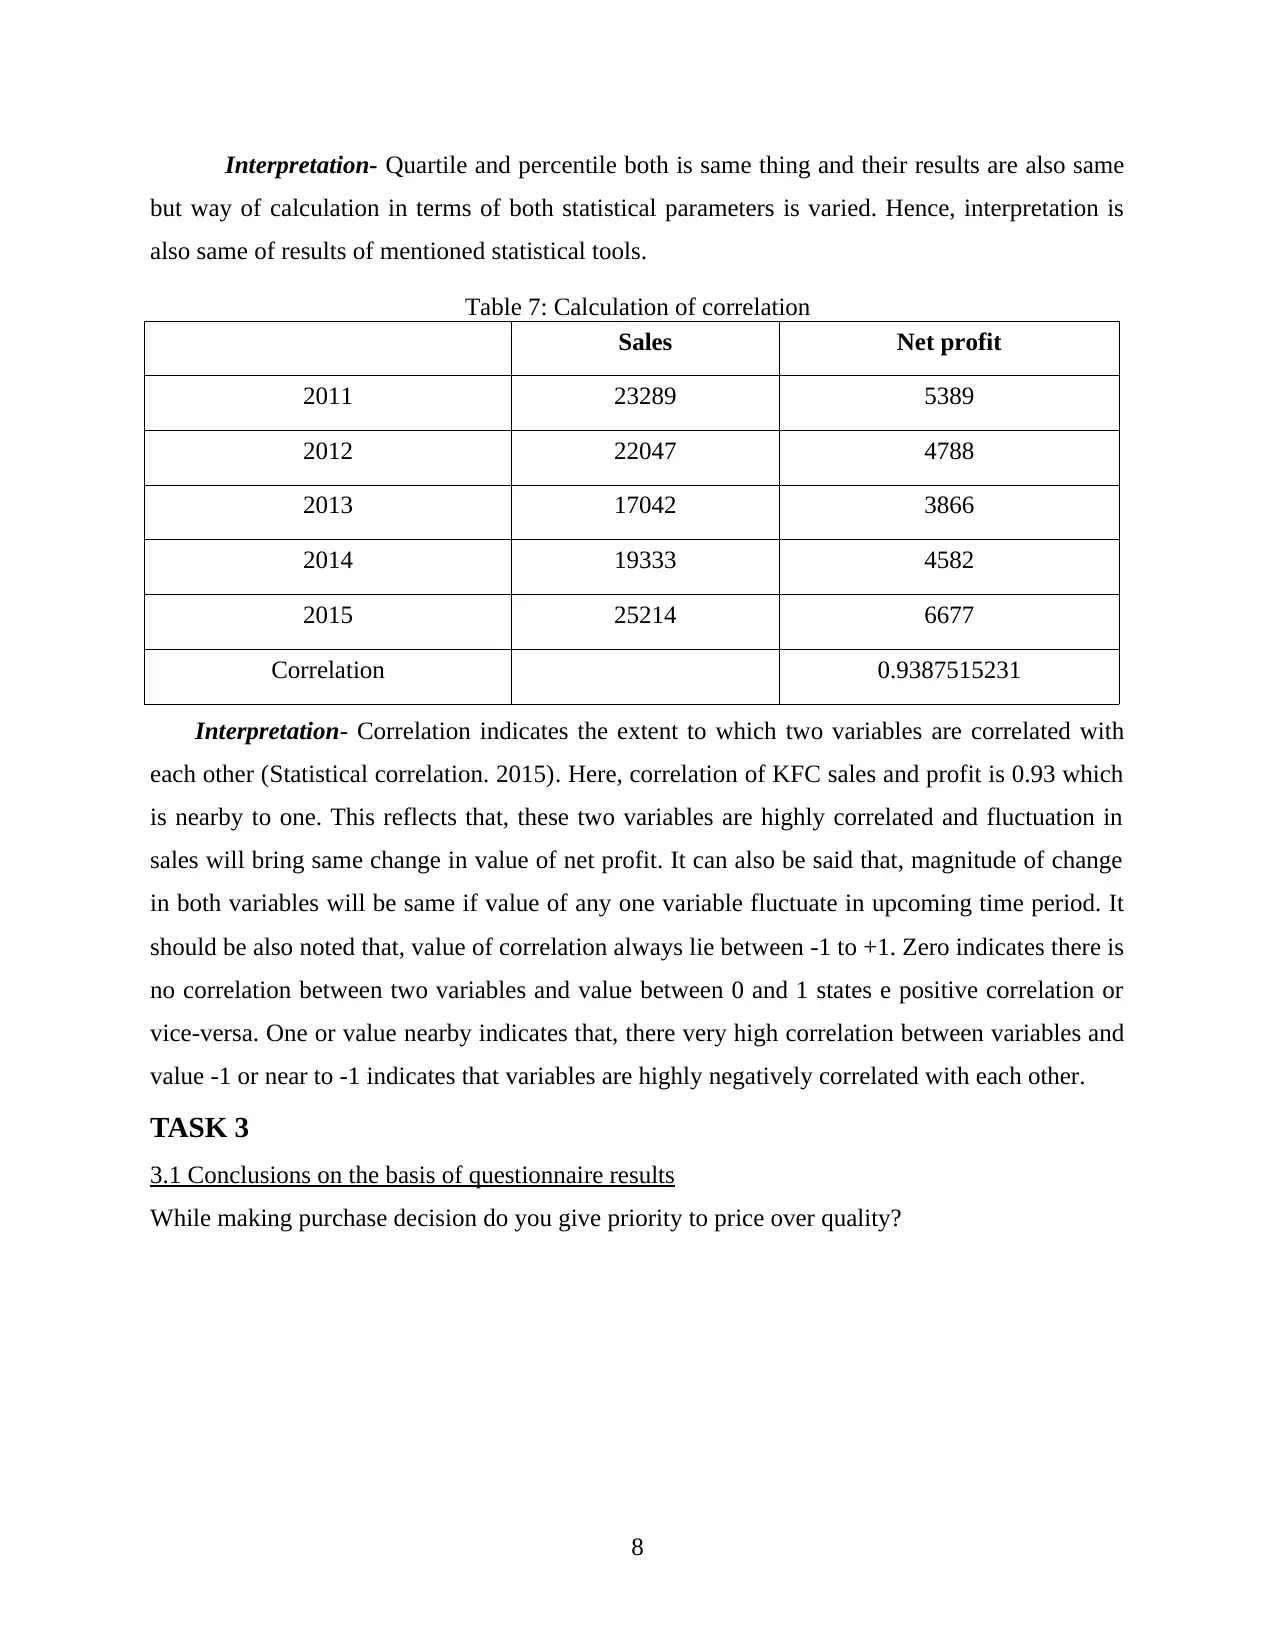
Interpretation- Quartile and percentile both is same thing and their results are also same
but way of calculation in terms of both statistical parameters is varied. Hence, interpretation is
also same of results of mentioned statistical tools.
Table 7: Calculation of correlation
Sales Net profit
2011 23289 5389
2012 22047 4788
2013 17042 3866
2014 19333 4582
2015 25214 6677
Correlation 0.9387515231
Interpretation- Correlation indicates the extent to which two variables are correlated with
each other (Statistical correlation. 2015). Here, correlation of KFC sales and profit is 0.93 which
is nearby to one. This reflects that, these two variables are highly correlated and fluctuation in
sales will bring same change in value of net profit. It can also be said that, magnitude of change
in both variables will be same if value of any one variable fluctuate in upcoming time period. It
should be also noted that, value of correlation always lie between -1 to +1. Zero indicates there is
no correlation between two variables and value between 0 and 1 states e positive correlation or
vice-versa. One or value nearby indicates that, there very high correlation between variables and
value -1 or near to -1 indicates that variables are highly negatively correlated with each other.
TASK 3
3.1 Conclusions on the basis of questionnaire results
While making purchase decision do you give priority to price over quality?
8
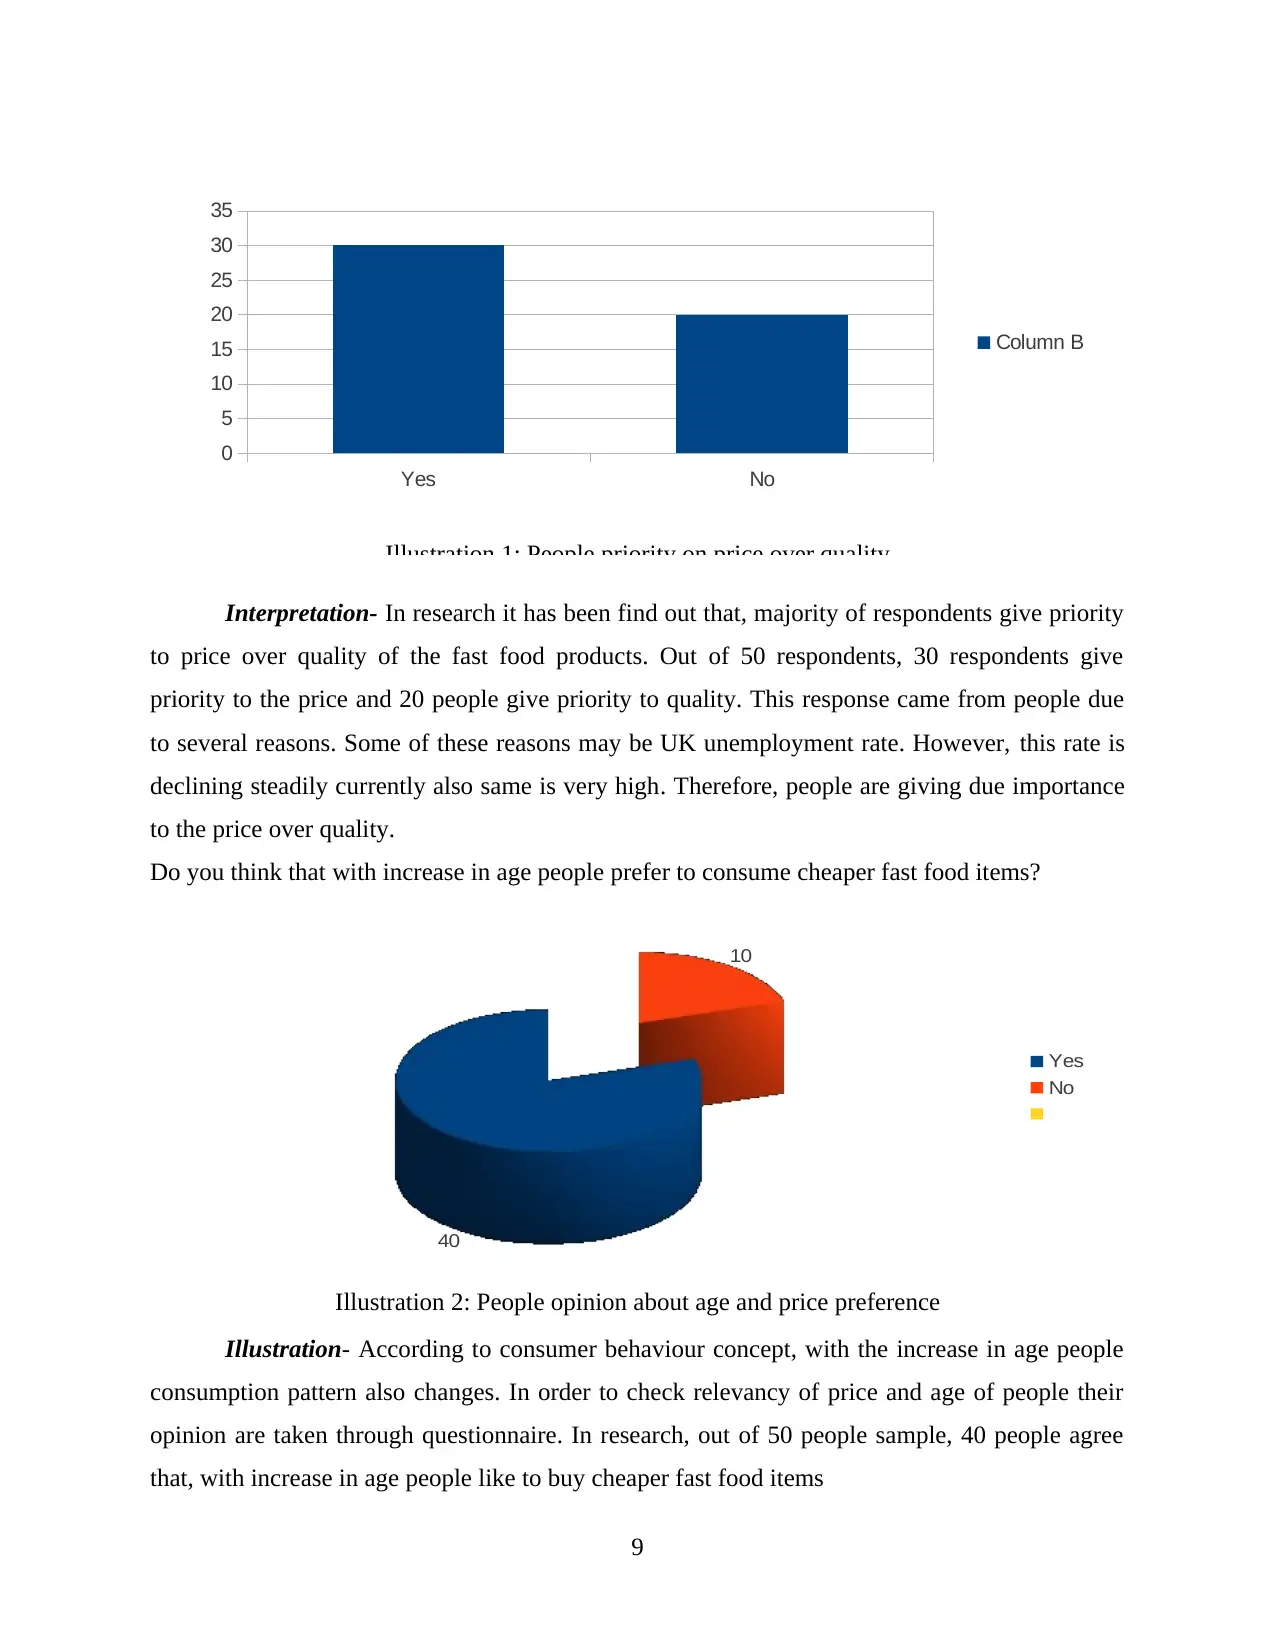
Interpretation- In research it has been find out that, majority of respondents give priority
to price over quality of the fast food products. Out of 50 respondents, 30 respondents give
priority to the price and 20 people give priority to quality. This response came from people due
to several reasons. Some of these reasons may be UK unemployment rate. However, this rate is
declining steadily currently also same is very high. Therefore, people are giving due importance
to the price over quality.
Do you think that with increase in age people prefer to consume cheaper fast food items?
Illustration- According to consumer behaviour concept, with the increase in age people
consumption pattern also changes. In order to check relevancy of price and age of people their
opinion are taken through questionnaire. In research, out of 50 people sample, 40 people agree
that, with increase in age people like to buy cheaper fast food items
9
40
10
Yes
No
Illustration 2: People opinion about age and price preference
Yes No
0
5
10
15
20
25
30
35
Column B
Illustration 1: People priority on price over quality
⊘ This is a preview!⊘
Do you want full access?
Subscribe today to unlock all pages.
Trusted by 1+ million students worldwide
1 out of 20
Related Documents


Your All-in-One AI-Powered Toolkit for Academic Success.
+13062052269
info@desklib.com
Available 24*7 on WhatsApp / Email
![[object Object]](/_next/static/media/star-bottom.7253800d.svg)
Unlock your academic potential
Copyright © 2020–2026 A2Z Services. All Rights Reserved. Developed and managed by ZUCOL.