Financial Report: A Comparative Analysis of KFC and Burger King

Verified

Added on  2023/06/13

|8
|1715
|167
Report
AI Summary
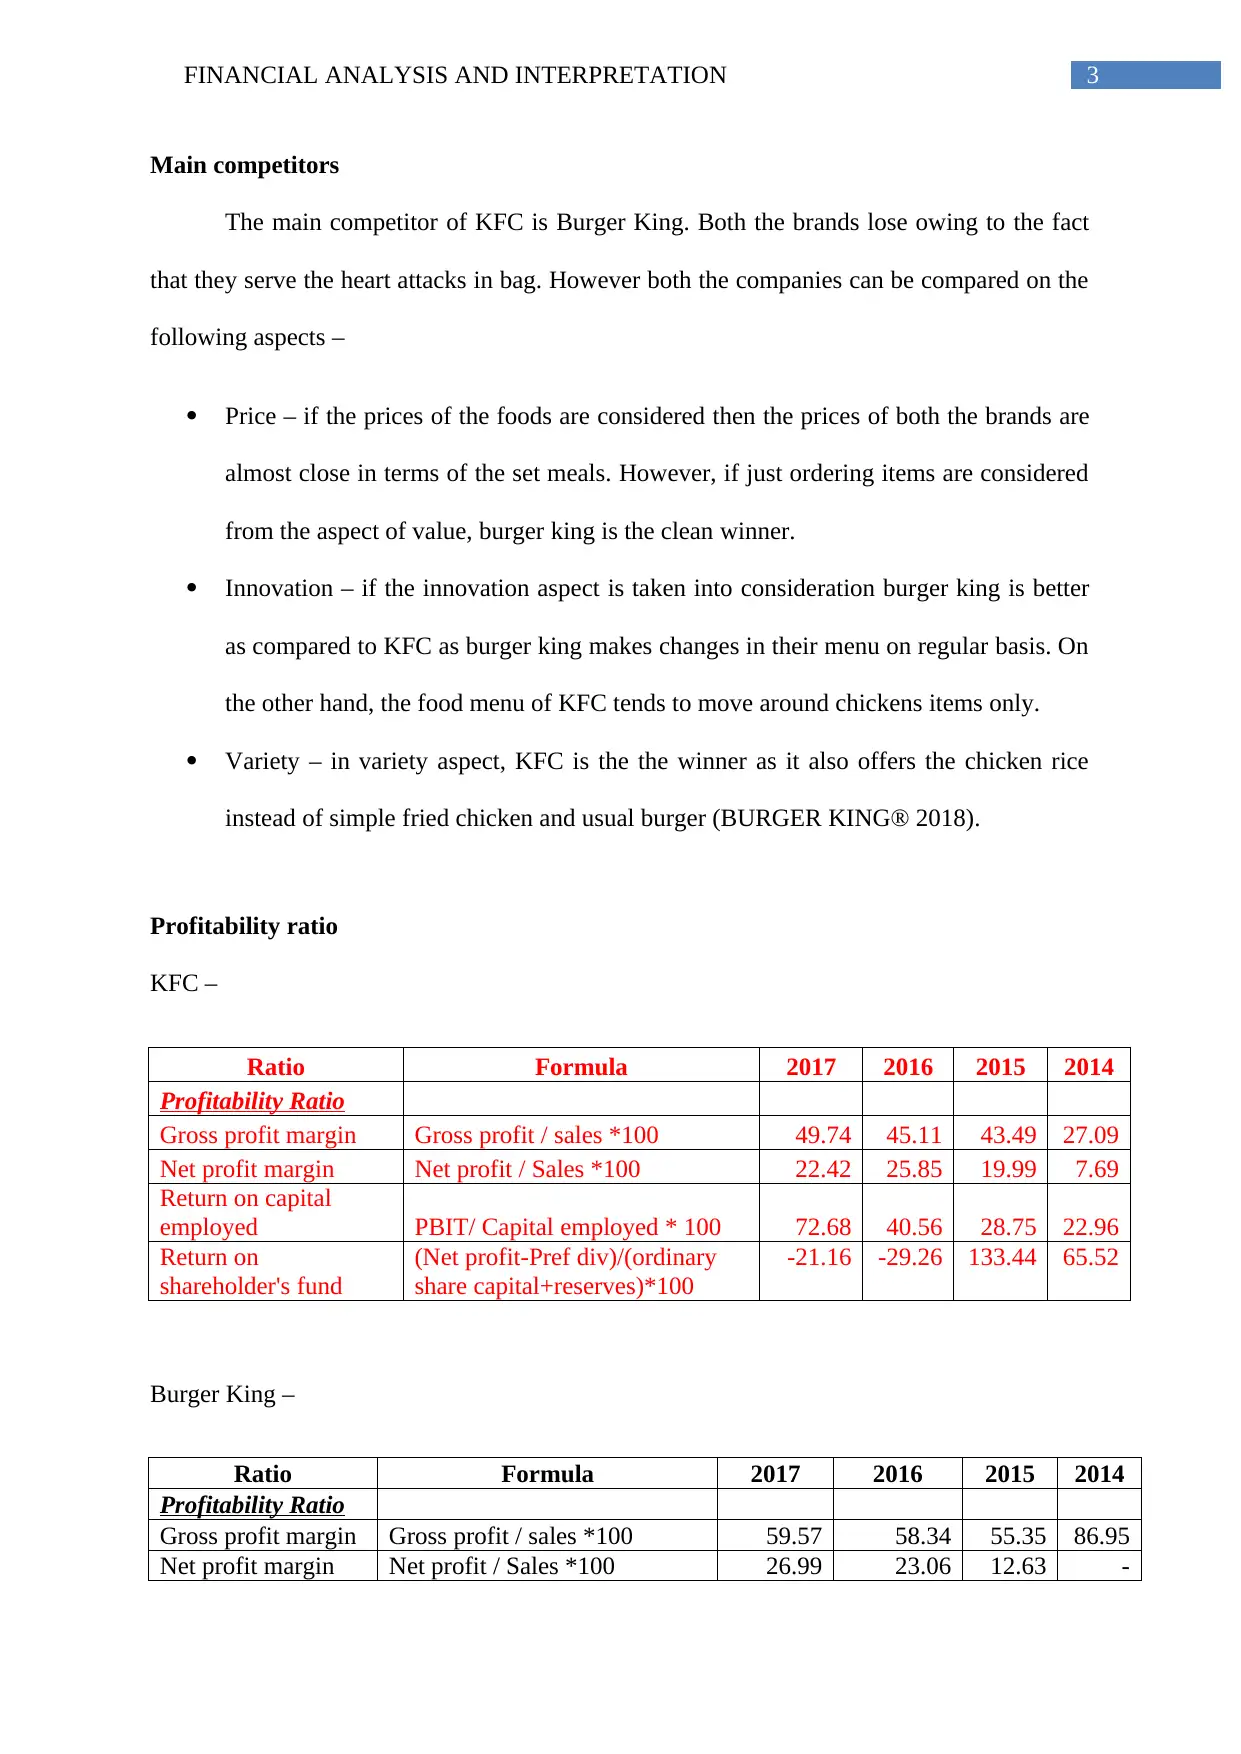
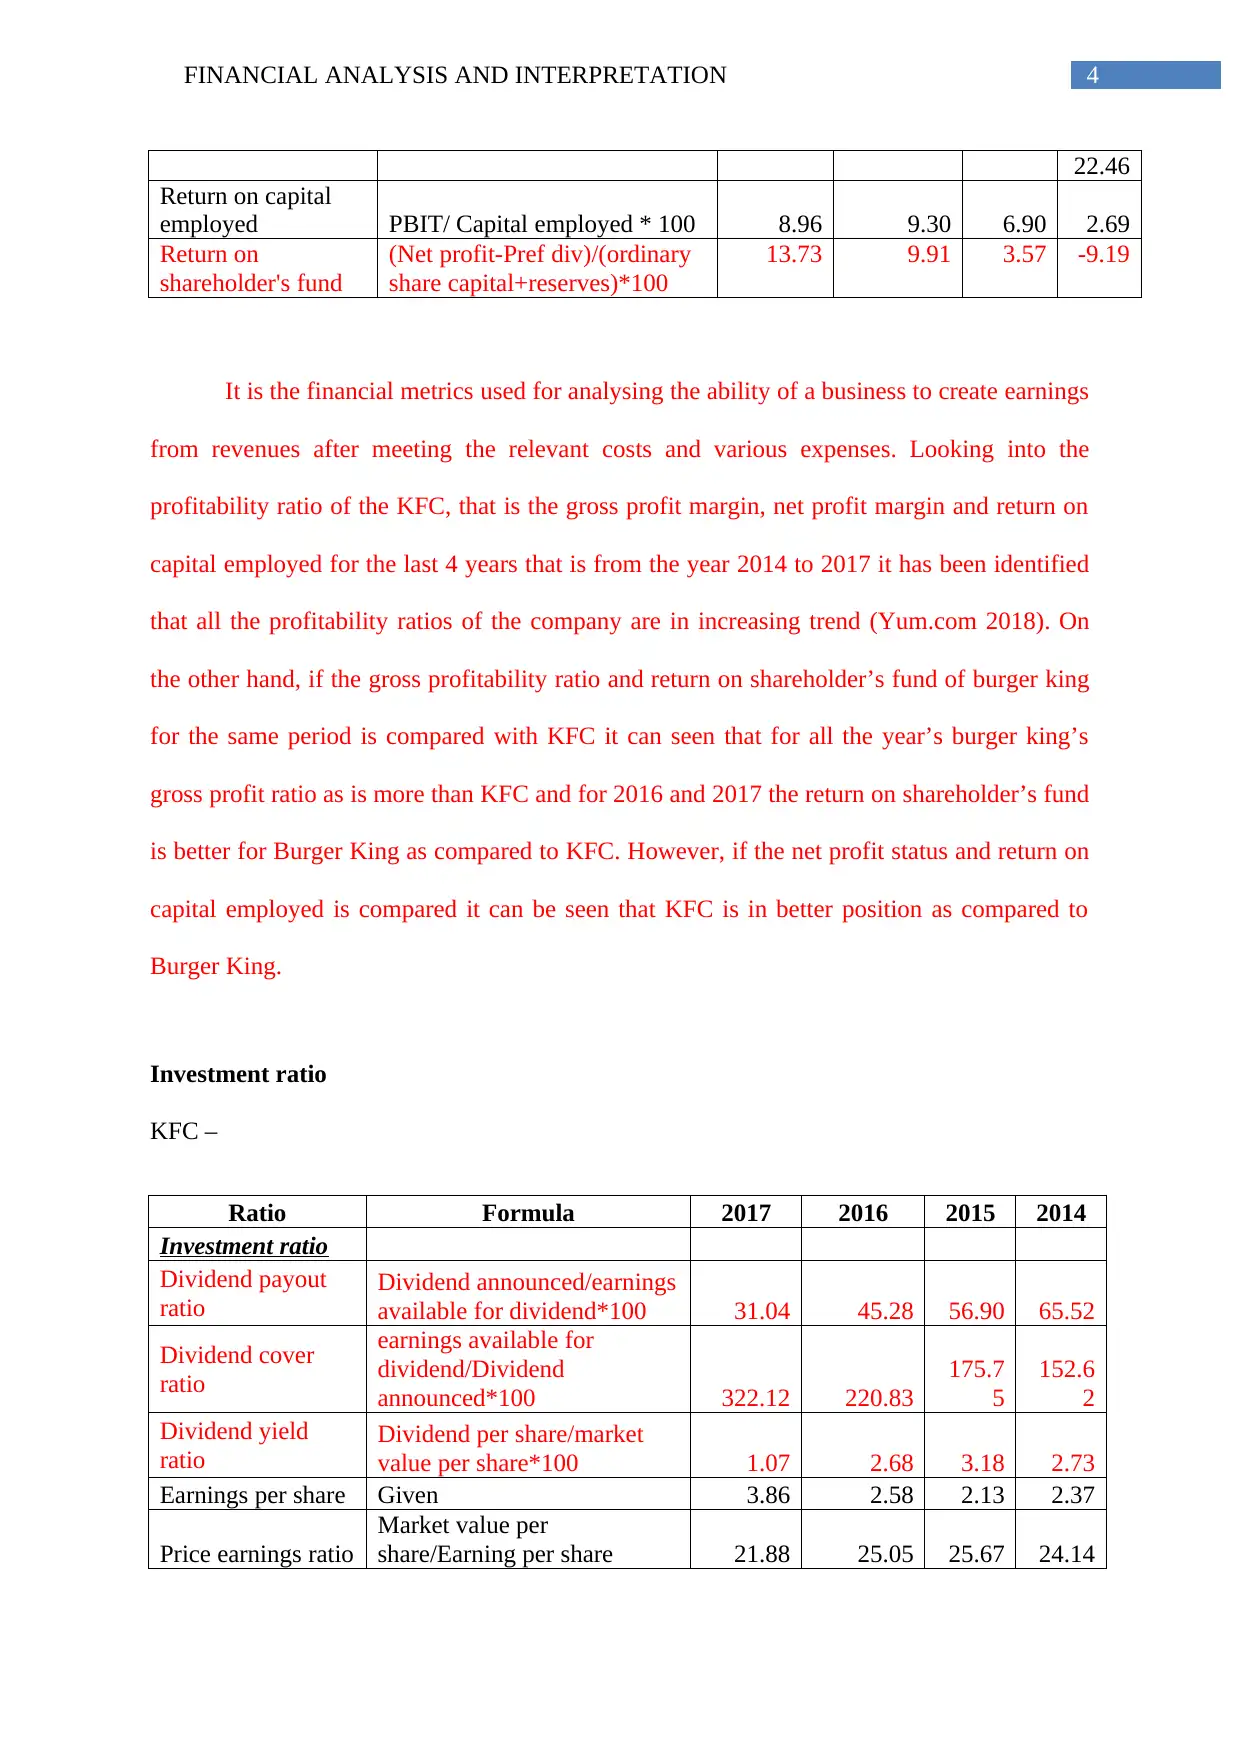
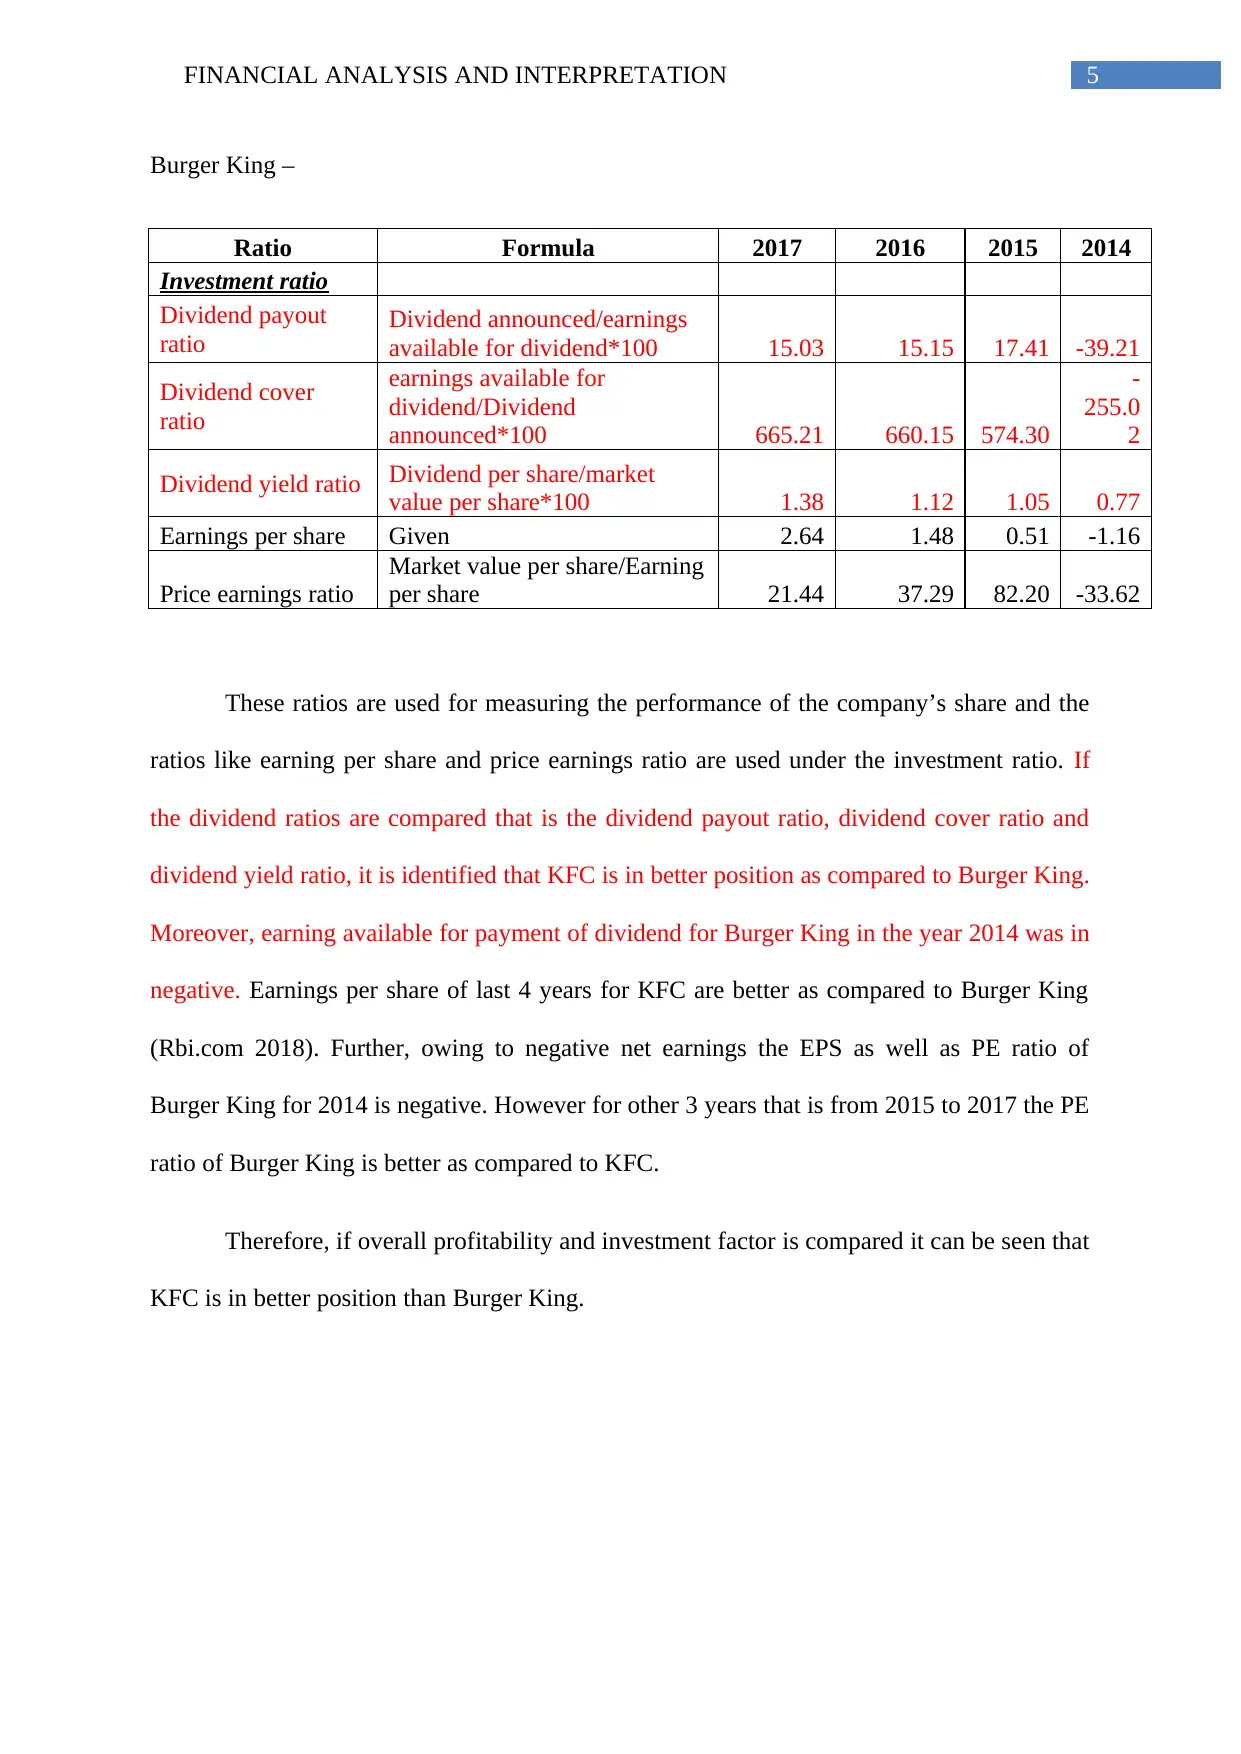
This report provides a financial analysis and interpretation of KFC, comparing it to its main competitor, Burger King. The analysis focuses on profitability ratios (gross profit margin, net profit margin, return on capital employed, and return on shareholder's fund) and investment ratios (dividend payout ratio, dividend cover ratio, dividend yield, earnings per share, and price earnings ratio) for the period of 2014-2017. The report finds that while Burger King has a higher gross profit margin and return on shareholder's fund in some years, KFC generally demonstrates better net profit, return on capital employed, and dividend ratios. Overall, the analysis suggests that KFC is in a stronger financial position than Burger King. The report also includes a reflection on the group work process, highlighting the importance of clear communication and task allocation for successful collaboration. Desklib provides access to similar past papers and solved assignments for students.
Document Page
Running head: FINANCIAL ANALYSIS AND INTERPRETATION
Financial analysis and interpretation
Name of the student
Name of the university
Student ID
Author note
tabler-icon-diamond-filled.svg

Paraphrase This Document

Need a fresh take? Get an instant paraphrase of this document with our AI Paraphraser
Document Page
1FINANCIAL ANALYSIS AND INTERPRETATION
Table of Contents
Business sector...........................................................................................................................2
Main competitors.......................................................................................................................2
Profitability ratio........................................................................................................................2
Investment ratio..........................................................................................................................3
Reflection...................................................................................................................................5
Reference....................................................................................................................................6
Document Page
2FINANCIAL ANALYSIS AND INTERPRETATION
Business sector
KFC is the fast food brand that is specialized in chicken. It has more than 19,500 units
all over 115 nations and territories. It is the 2nd largest restaurant chain in world after
McDonald. Main menus of KFC include fried chicken and side dishes include chicken
sandwiches, grilled chicken, desserts, hot wings and chicken strips. KFC is the subsidiary of
Yum Brands that also owns Taco Bell and Pizza Hut (KFC®: Finger Lickin’ Good® 2018).
It is supported through the Yum that offers support and programmes including customer
attraction, brand recognition, competitive advantage, economic stability, multi-unit growth,
solid business support, training and access to finance. Despite of drop in the consumer
spending, restaurant sector survived recession efficiently. Further, the franchisees of KFC are
allowed to use (i) some trademarks of KFC, service marks, trade names and commercial
symbols that includes Kentucky Fried Chicken and KFC marks (ii) proprietary formats for
business, procedures, methods, designs, specifications and standards that are authorised by
the franchisor, only in connection with the outlet operation. The company operates more than
70 branches for KFC all over Ireland. However, recently the branches together recorded the
loss amounting to 9 million after writing down 4.5 million for inter-company loan. The
company marginally employed 230 staffs (Irishtimes.com 2018). Further, the company is
evaluating the offers for banking facilities as the directors are confident regarding sealing the
new deal soon. The company uses various sales promotions for reaching to the potential
customers. It includes exhibits, coupon and various entertainment promotions for promoting
their products and increasing the level of sales.
Document Page
3FINANCIAL ANALYSIS AND INTERPRETATION
Main competitors
The main competitor of KFC is Burger King. Both the brands lose owing to the fact
that they serve the heart attacks in bag. However both the companies can be compared on the
following aspects –
Price – if the prices of the foods are considered then the prices of both the brands are
almost close in terms of the set meals. However, if just ordering items are considered
from the aspect of value, burger king is the clean winner.
Innovation – if the innovation aspect is taken into consideration burger king is better
as compared to KFC as burger king makes changes in their menu on regular basis. On
the other hand, the food menu of KFC tends to move around chickens items only.
Variety – in variety aspect, KFC is the the winner as it also offers the chicken rice
instead of simple fried chicken and usual burger (BURGER KING® 2018).
Profitability ratio
KFC –
Ratio Formula 2017 2016 2015 2014
Profitability Ratio
Gross profit margin Gross profit / sales *100 49.74 45.11 43.49 27.09
Net profit margin Net profit / Sales *100 22.42 25.85 19.99 7.69
Return on capital
employed PBIT/ Capital employed * 100 72.68 40.56 28.75 22.96
Return on
shareholder's fund
(Net profit-Pref div)/(ordinary
share capital+reserves)*100
-21.16 -29.26 133.44 65.52
Burger King –
Ratio Formula 2017 2016 2015 2014
Profitability Ratio
Gross profit margin Gross profit / sales *100 59.57 58.34 55.35 86.95
Net profit margin Net profit / Sales *100 26.99 23.06 12.63 -
tabler-icon-diamond-filled.svg

Paraphrase This Document

Need a fresh take? Get an instant paraphrase of this document with our AI Paraphraser
Document Page
4FINANCIAL ANALYSIS AND INTERPRETATION
22.46
Return on capital
employed PBIT/ Capital employed * 100 8.96 9.30 6.90 2.69
Return on
shareholder's fund
(Net profit-Pref div)/(ordinary
share capital+reserves)*100
13.73 9.91 3.57 -9.19
It is the financial metrics used for analysing the ability of a business to create earnings
from revenues after meeting the relevant costs and various expenses. Looking into the
profitability ratio of the KFC, that is the gross profit margin, net profit margin and return on
capital employed for the last 4 years that is from the year 2014 to 2017 it has been identified
that all the profitability ratios of the company are in increasing trend (Yum.com 2018). On
the other hand, if the gross profitability ratio and return on shareholder’s fund of burger king
for the same period is compared with KFC it can seen that for all the year’s burger king’s
gross profit ratio as is more than KFC and for 2016 and 2017 the return on shareholder’s fund
is better for Burger King as compared to KFC. However, if the net profit status and return on
capital employed is compared it can be seen that KFC is in better position as compared to
Burger King.
Investment ratio
KFC –
Ratio Formula 2017 2016 2015 2014
Investment ratio
Dividend payout
ratio
Dividend announced/earnings
available for dividend*100 31.04 45.28 56.90 65.52
Dividend cover
ratio
earnings available for
dividend/Dividend
announced*100 322.12 220.83
175.7
5
152.6
2
Dividend yield
ratio
Dividend per share/market
value per share*100 1.07 2.68 3.18 2.73
Earnings per share Given 3.86 2.58 2.13 2.37
Price earnings ratio
Market value per
share/Earning per share 21.88 25.05 25.67 24.14
Document Page
5FINANCIAL ANALYSIS AND INTERPRETATION
Burger King –
Ratio Formula 2017 2016 2015 2014
Investment ratio
Dividend payout
ratio Dividend announced/earnings
available for dividend*100 15.03 15.15 17.41 -39.21
Dividend cover
ratio
earnings available for
dividend/Dividend
announced*100 665.21 660.15 574.30
-
255.0
2
Dividend yield ratio Dividend per share/market
value per share*100 1.38 1.12 1.05 0.77
Earnings per share Given 2.64 1.48 0.51 -1.16
Price earnings ratio
Market value per share/Earning
per share 21.44 37.29 82.20 -33.62
These ratios are used for measuring the performance of the company’s share and the
ratios like earning per share and price earnings ratio are used under the investment ratio. If
the dividend ratios are compared that is the dividend payout ratio, dividend cover ratio and
dividend yield ratio, it is identified that KFC is in better position as compared to Burger King.
Moreover, earning available for payment of dividend for Burger King in the year 2014 was in
negative. Earnings per share of last 4 years for KFC are better as compared to Burger King
(Rbi.com 2018). Further, owing to negative net earnings the EPS as well as PE ratio of
Burger King for 2014 is negative. However for other 3 years that is from 2015 to 2017 the PE
ratio of Burger King is better as compared to KFC.
Therefore, if overall profitability and investment factor is compared it can be seen that
KFC is in better position than Burger King.
Document Page
6FINANCIAL ANALYSIS AND INTERPRETATION
Reflection
Our group was formed for working on the assignment of ‘Financial analysis and
interpretation’. The assignment was regarding the critical analysis of famous fast food chain
KFC and it’s comparison with the competitor Burger King and finally providing conclusion
on which one is better in comparison to other. The purpose of the report was to reflect our
experience on the group work. In this reflection part I will state my experience with regard to
formation of the group, organizing the group work and managing of our group work.
Formation of group is the primary stage and under this stage it was decided that
which member will do which part of the task. We have formed our own group after
conducting a discussion with other students. As we all were familiar to each other it was easy
to form the group and allocate the task. Among all I was the leader and therefore I was
responsible for smooth communication among the group members. I was also responsible for
discussion regarding the assignment and make it clear to each member regarding his part.
However, if I was to do it again, I will try to avoid the delay at the initial level.
Further, I will summarize the assignment task to avoid any kind of unnecessary confusion
among the group members. It will also minimize the issues among the members regarding the
task and no one will be in a position to blame others for their own mistakes. However, at last
I was happy working with other members as we were able to complete the task on time. It
would not have been possible without mutual cooperation. Further, I expect that if next time
we work together on any other assignment we will have better understanding and
communication that will enhance the quality of task.
tabler-icon-diamond-filled.svg

Paraphrase This Document

Need a fresh take? Get an instant paraphrase of this document with our AI Paraphraser
Document Page
7FINANCIAL ANALYSIS AND INTERPRETATION
Reference
BURGER KING®. 2018. BURGER KING®. [online] Available at: https://www.bk.com/
[Accessed 9 Apr. 2018].
Irishtimes.com. (2018). Kentucky Fried Chicken | The Irish Times. [online] Available at:
https://www.irishtimes.com/topics/topics-7.1213540?
article=true&tag_company=Kentucky+Fried+Chicken&page=2 [Accessed 12 Apr. 2018].
KFC®: Finger Lickin’ Good®. 2018. Sandwiches - KFC.com. [online] Available at:
https://www.kfc.com/menu/sandwiches [Accessed 9 Apr. 2018].
Rbi.com. 2018. Home | Restaurant Brands International ™. [online] Available at:
http://www.rbi.com/ [Accessed 9 Apr. 2018].
Yum.com. 2018. Yum! Brands A World with More Yum!. [online] Available at:
http://www.yum.com/ [Accessed 9 Apr. 2018].
chevron_up_icon
1 out of 8
circle_padding
hide_on_mobile
zoom_out_icon
[object Object]