Kick Shoe Company: Comprehensive Year 13 Shareholder Report Review
VerifiedAdded on 2021/04/21
|20
|2987
|78
Report
AI Summary
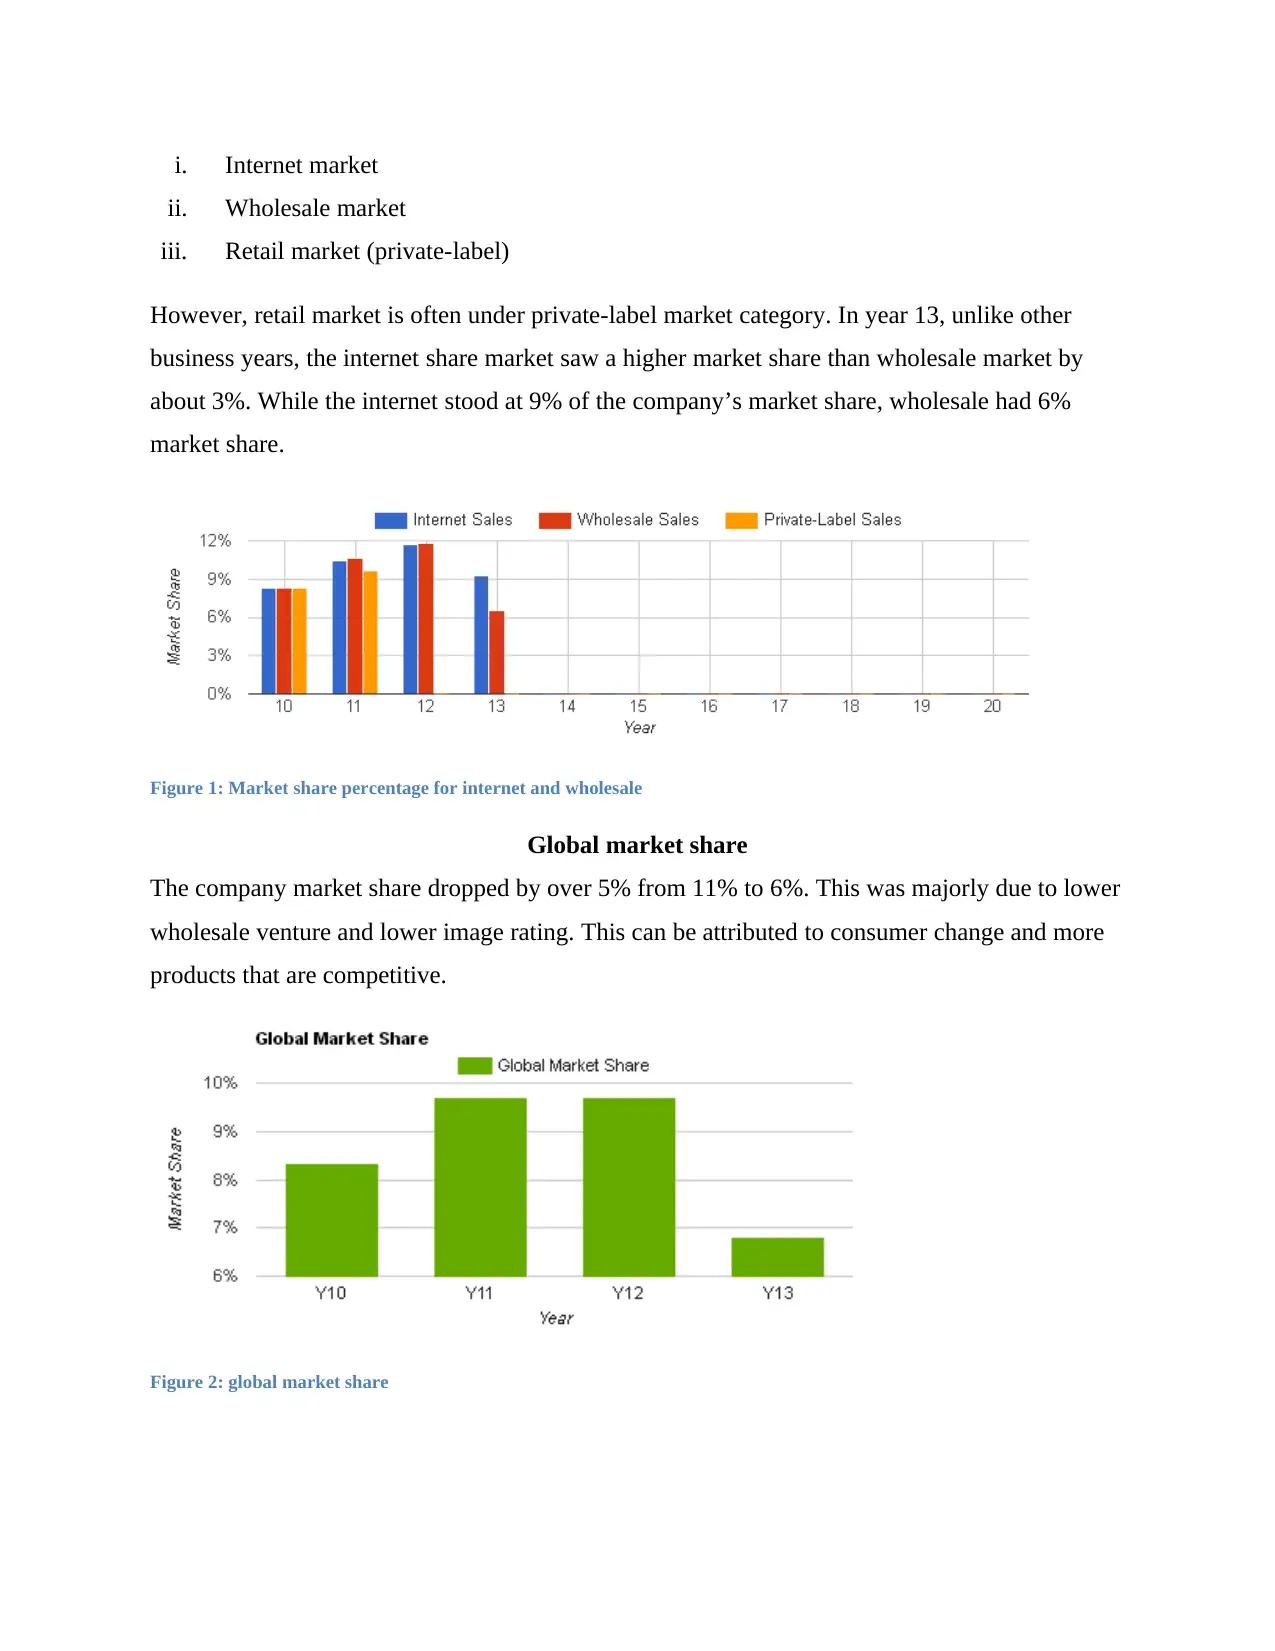
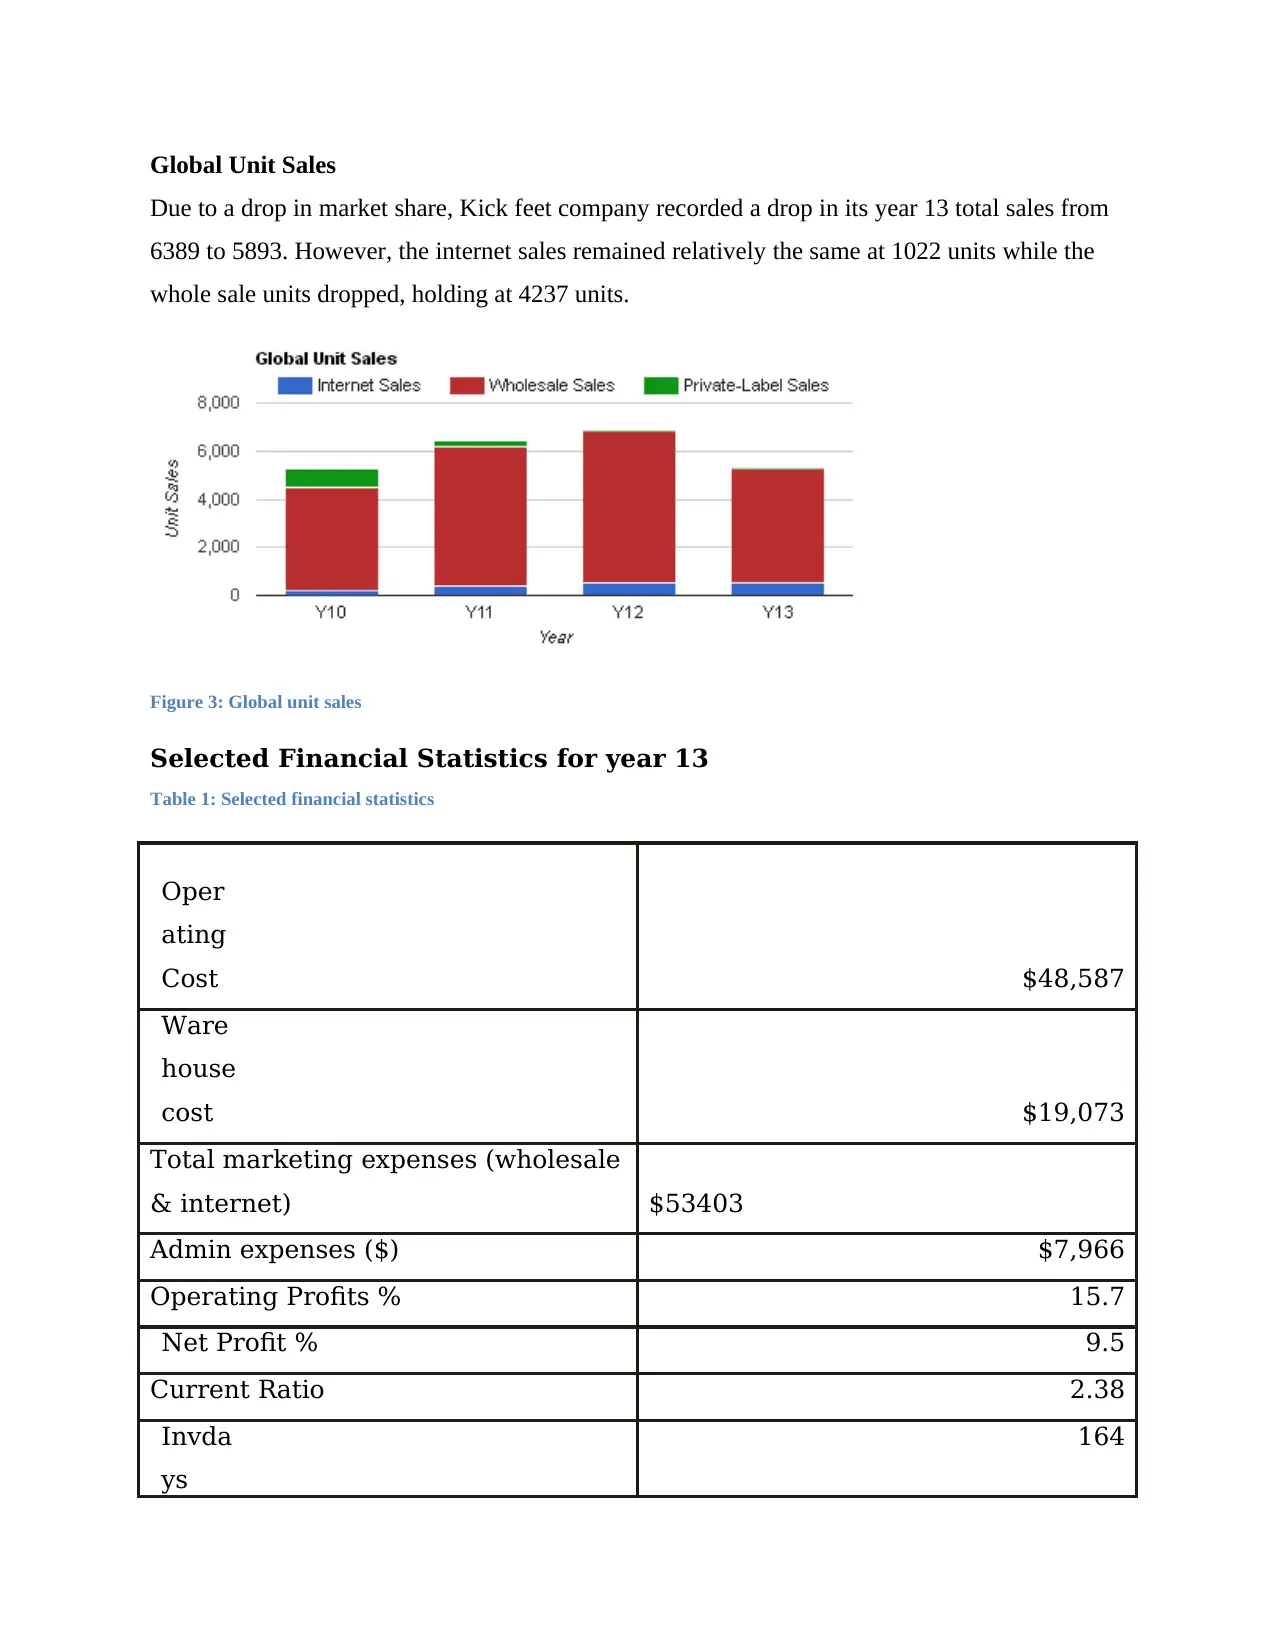
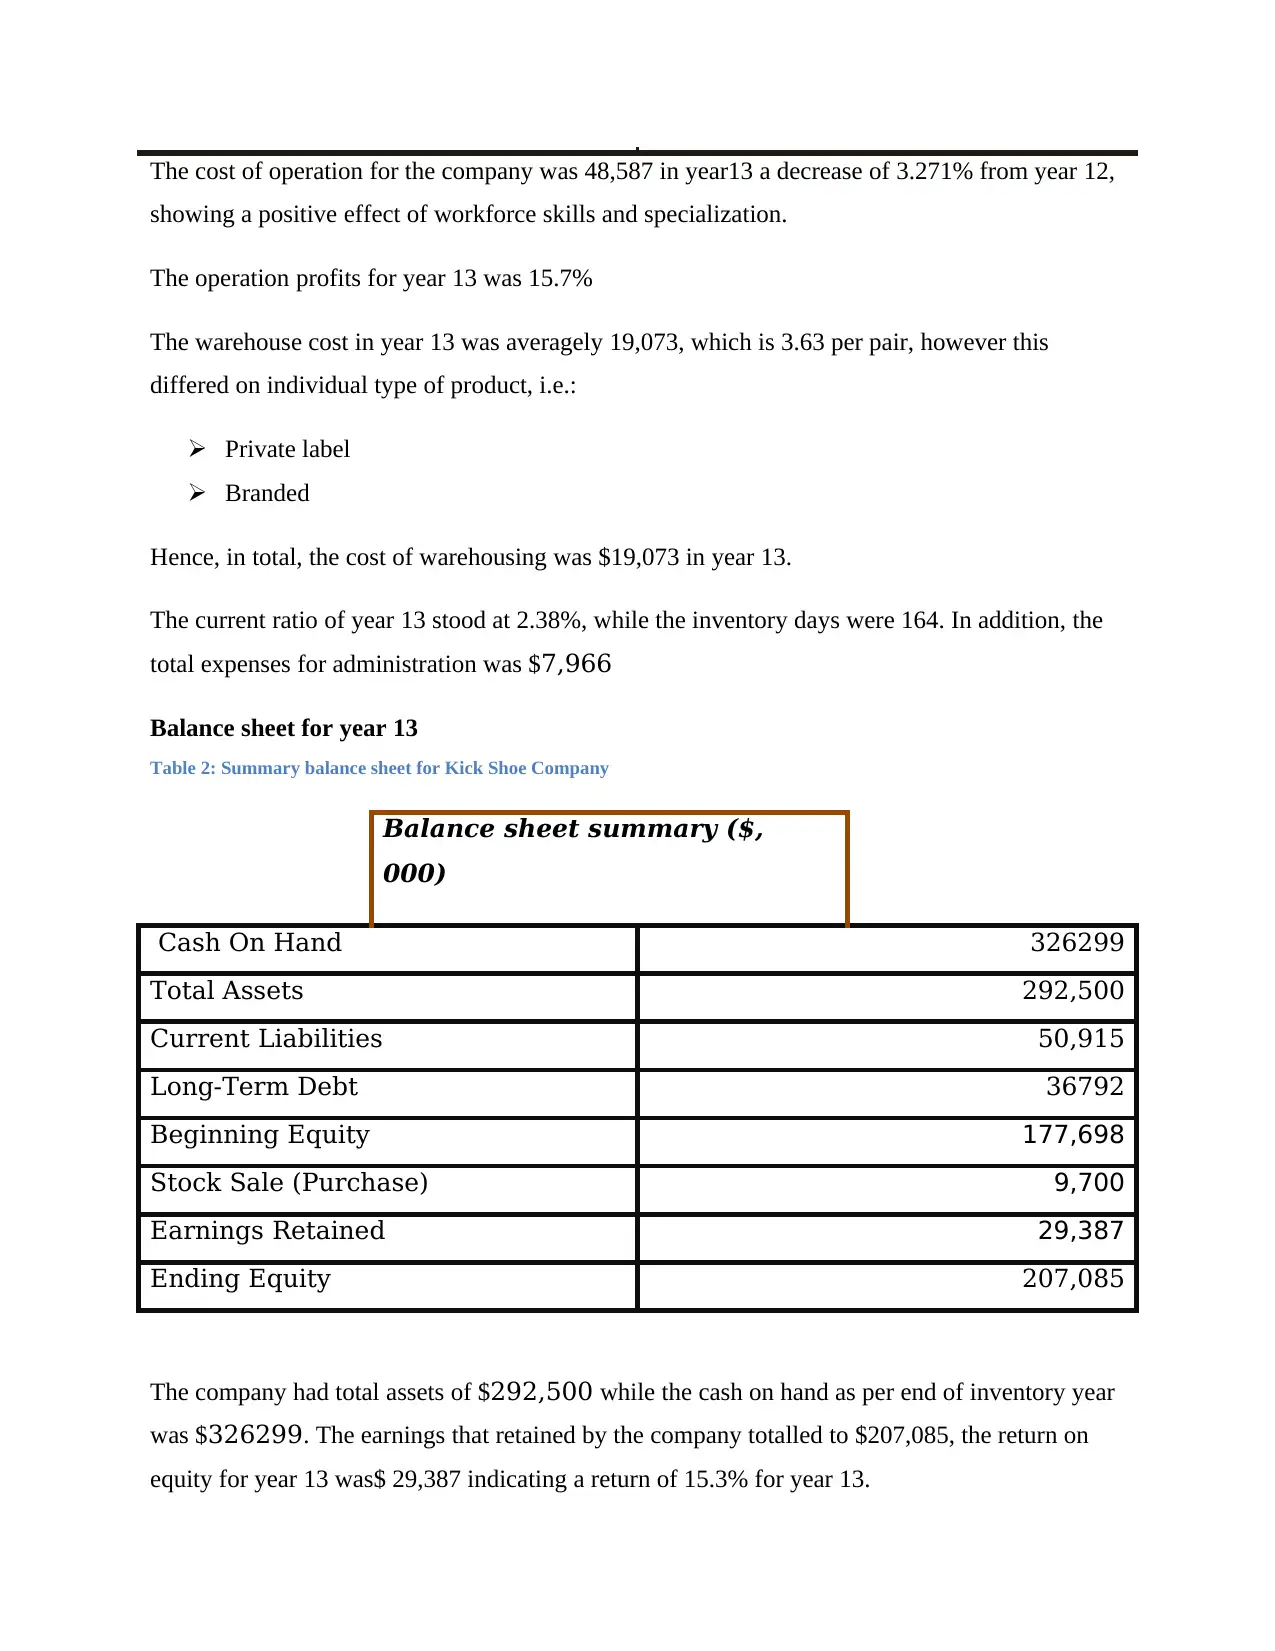
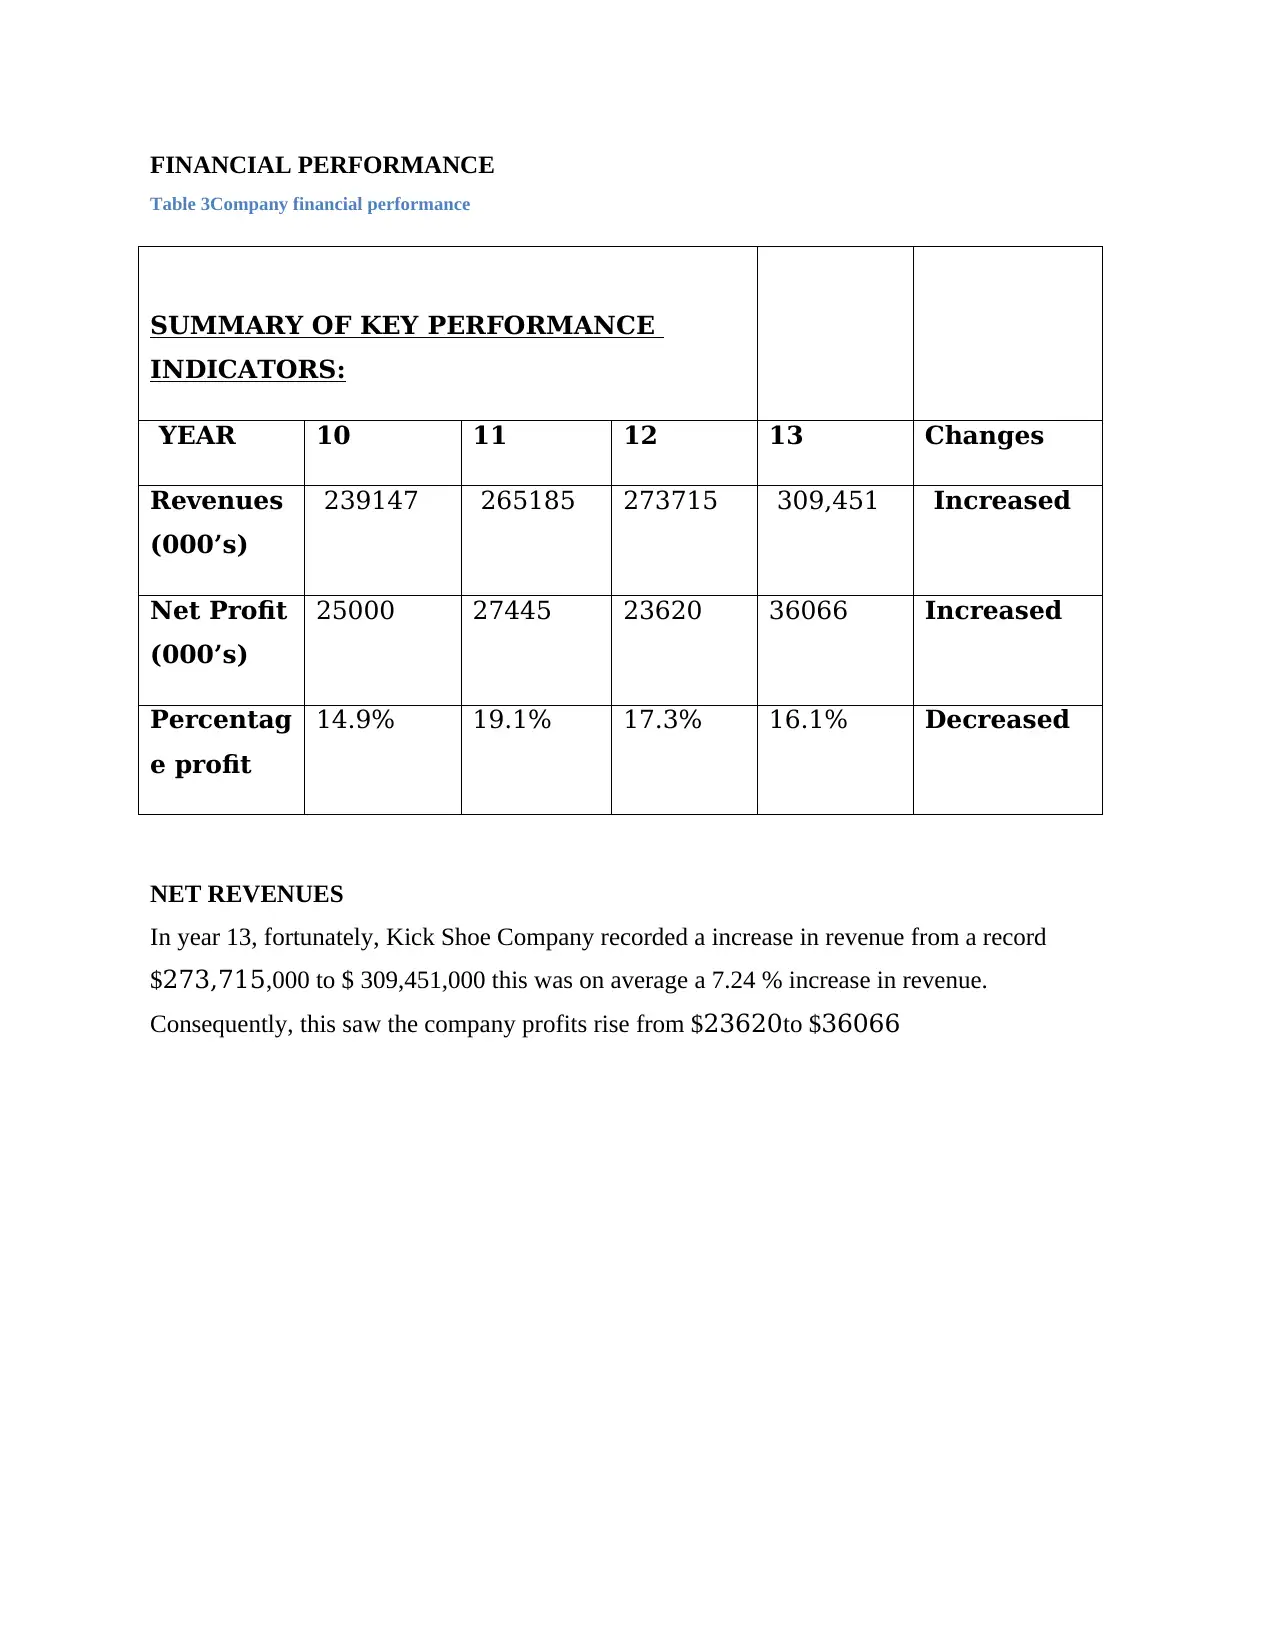
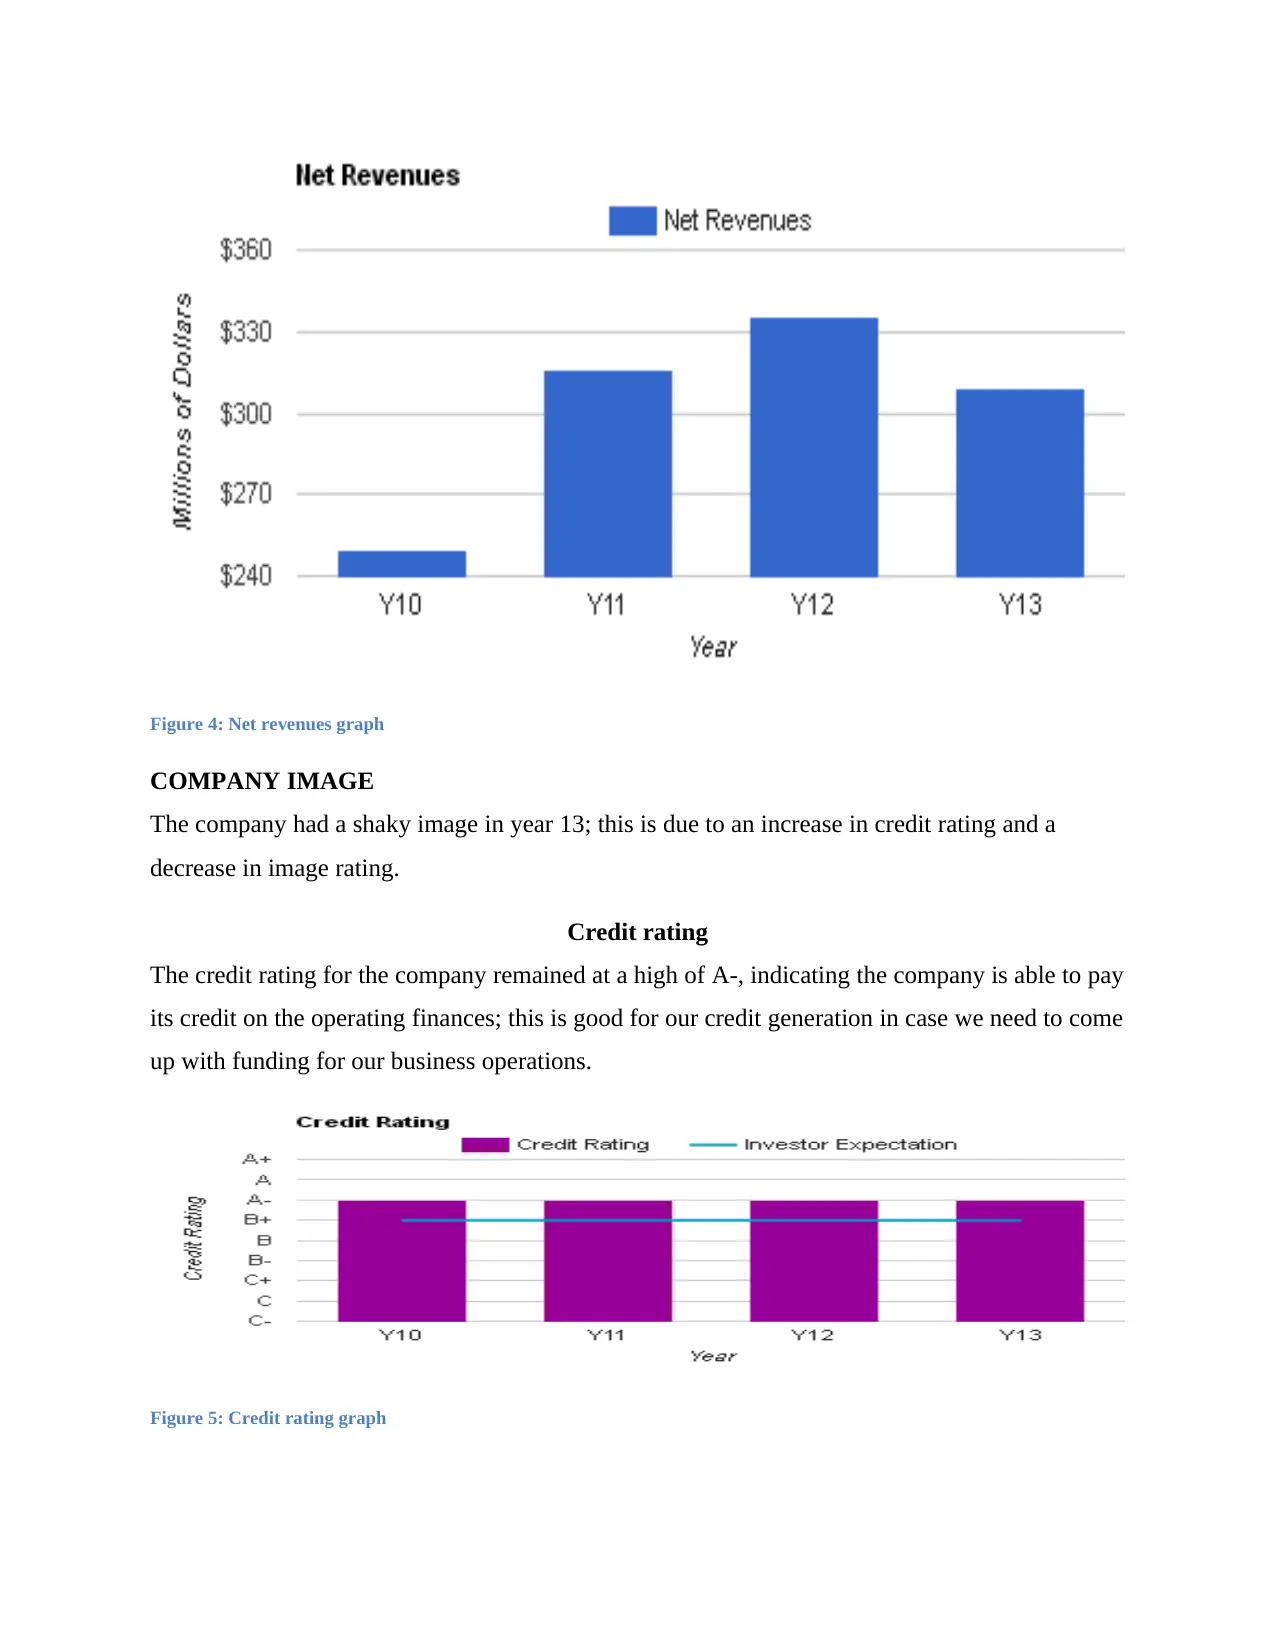
This annual shareholder report for Kick Shoe Company details the company's performance in Year 13, reviewing key financial indicators, market share, and strategic initiatives. The report analyzes revenues, net profits, operating costs, and balance sheet data, including assets, liabilities, and equity. It examines market share across internet, wholesale, and retail channels, and provides insights into global unit sales and financial ratios. The analysis covers financial performance, company image, return on equity, stock prices, and human resources, including worker productivity and training. Additionally, the report evaluates pricing strategies, sales performance across different segments, and advertising efforts. The report concludes with a review of key performance indicators, financial ratios, and human resource metrics, summarizing the company's strengths, weaknesses, and plans for Year 14.

Subject Name: XXX
Subject Code: XXX
Tutor: XXX
Assignment: Annual Shareholder Report for Year 13
Date: XXX
Name: XXX
Student ID: XXX- Finance Manager
Name: XXX
Student ID: XXX- Operations Manager
Name; XXX
Student ID: XXX- Marketing Manager
Subject Code: XXX
Tutor: XXX
Assignment: Annual Shareholder Report for Year 13
Date: XXX
Name: XXX
Student ID: XXX- Finance Manager
Name: XXX
Student ID: XXX- Operations Manager
Name; XXX
Student ID: XXX- Marketing Manager
Paraphrase This Document
Need a fresh take? Get an instant paraphrase of this document with our AI Paraphraser

Year 13
Annual Shareholder
Report
Kick Shoe Company.
Annual Shareholder
Report
Kick Shoe Company.

INTRODUCTION
It has been a long business year, many activities, strategies, plan executions, and most of all, the
fact that we have reached at this point in business. Over the years, we have measured our
progress, learnt from our past, and made plans on how to forge the future as a company and have
established strategies that have made us hold onto business for this while. Some fail, some are
successful and others extremely successful. This is so, because of the structure of our company,
cooperation from all stakeholders and the belief in quality and positively contributing to the
society. Part of our building pillars as a company is responsibility towards stakeholders. This
way we manage to be steadfast to our task and be able to meet our goals. Our stakeholders
include:
i. Government
ii. Shareholders.
iii. Consumers
iv. Workforce
v. Business community.
According to BDC business article, in order to determine whether your business is a success or
not, you need to measure the value of your strategies over the cycle period of your business,
BDC (2018). This has been true for Kick Shoes Company. Each year we generate a report for
our business status, activities, and a plan for the succeeding year. As part of our responsibility to
our investors who need to know whether their money is meeting its value and the progress of the
business they are financing and whether they are benefiting for their financial input.
⊘ This is a preview!⊘
Do you want full access?
Subscribe today to unlock all pages.

Trusted by 1+ million students worldwide

EXECUTIVE SUMMARY
In year 12, Kick Shoes Company outlined plans it intended to see come into fruition in year 13,
this among others included:
i. Increase in the return on equity
ii. Increasing its market share
iii. Lowering the cost of production
iv. Improving its product quality
v. Raising the revenue rates through increase of sales
vi. Increasing worker knowledge and Skills
vii. Increasing its product output
viii. Promoting its image
ix. Raising product awareness through, among other means: advertising and sales support
for retailers
As it is with all plans, not everything planned happens, but the percentage of achieving the ones
stated is what defines success and failure. Kick Shoes achieved a number of the year 12 plans
however it failed in some.
In this report, we will outline the key indicators of business performance, analyze the result,
draw inferences, and reach into conclusions. We will then determine the year 14 plans.
Moreover, strategize on how to achieve them.
We will include graphs to show relationship over the business years and show the change:
whether positive or negative. From the data that gathered over the year, we will outline our
strengths, weaknesses and seek to use our strengths and heal our weaknesses.
DATA AND INTERPRETATION
MARKET SHARE
Company Market distribution
Kick Shoe company ventures the sale of its footwear products in three distinctive markets:
Paraphrase This Document
Need a fresh take? Get an instant paraphrase of this document with our AI Paraphraser

i. Internet market
ii. Wholesale market
iii. Retail market (private-label)
However, retail market is often under private-label market category. In year 13, unlike other
business years, the internet share market saw a higher market share than wholesale market by
about 3%. While the internet stood at 9% of the company’s market share, wholesale had 6%
market share.
Figure 1: Market share percentage for internet and wholesale
Global market share
The company market share dropped by over 5% from 11% to 6%. This was majorly due to lower
wholesale venture and lower image rating. This can be attributed to consumer change and more
products that are competitive.
Figure 2: global market share

Global Unit Sales
Due to a drop in market share, Kick feet company recorded a drop in its year 13 total sales from
6389 to 5893. However, the internet sales remained relatively the same at 1022 units while the
whole sale units dropped, holding at 4237 units.
Figure 3: Global unit sales
Selected Financial Statistics for year 13
Table 1: Selected financial statistics
Oper
ating
Cost $48,587
Ware
house
cost $19,073
Total marketing expenses (wholesale
& internet) $53403
Admin expenses ($) $7,966
Operating Profits % 15.7
Net Profit % 9.5
Current Ratio 2.38
Invda
ys
164
⊘ This is a preview!⊘
Do you want full access?
Subscribe today to unlock all pages.

Trusted by 1+ million students worldwide

The cost of operation for the company was 48,587 in year13 a decrease of 3.271% from year 12,
showing a positive effect of workforce skills and specialization.
The operation profits for year 13 was 15.7%
The warehouse cost in year 13 was averagely 19,073, which is 3.63 per pair, however this
differed on individual type of product, i.e.:
Private label
Branded
Hence, in total, the cost of warehousing was $19,073 in year 13.
The current ratio of year 13 stood at 2.38%, while the inventory days were 164. In addition, the
total expenses for administration was $7,966
Balance sheet for year 13
Table 2: Summary balance sheet for Kick Shoe Company
Balance sheet summary ($,
000)
Cash On Hand 326299
Total Assets 292,500
Current Liabilities 50,915
Long-Term Debt 36792
Beginning Equity 177,698
Stock Sale (Purchase) 9,700
Earnings Retained 29,387
Ending Equity 207,085
The company had total assets of $292,500 while the cash on hand as per end of inventory year
was $326299. The earnings that retained by the company totalled to $207,085, the return on
equity for year 13 was$ 29,387 indicating a return of 15.3% for year 13.
Paraphrase This Document
Need a fresh take? Get an instant paraphrase of this document with our AI Paraphraser

FINANCIAL PERFORMANCE
Table 3Company financial performance
SUMMARY OF KEY PERFORMANCE
INDICATORS:
YEAR 10 11 12 13 Changes
Revenues
(000’s)
239147 265185 273715 309,451 Increased
Net Profit
(000’s)
25000 27445 23620 36066 Increased
Percentag
e profit
14.9% 19.1% 17.3% 16.1% Decreased
NET REVENUES
In year 13, fortunately, Kick Shoe Company recorded a increase in revenue from a record
$273,715,000 to $ 309,451,000 this was on average a 7.24 % increase in revenue.
Consequently, this saw the company profits rise from $23620to $36066

Figure 4: Net revenues graph
COMPANY IMAGE
The company had a shaky image in year 13; this is due to an increase in credit rating and a
decrease in image rating.
Credit rating
The credit rating for the company remained at a high of A-, indicating the company is able to pay
its credit on the operating finances; this is good for our credit generation in case we need to come
up with funding for our business operations.
Figure 5: Credit rating graph
⊘ This is a preview!⊘
Do you want full access?
Subscribe today to unlock all pages.

Trusted by 1+ million students worldwide

Image rating
Despite a good credit rating, the company recorded a drop in its image rating by almost 5 points;
this is attributed to a lower advertisement strategy adopted in year 12 for year 13.
Figure 6: Image rating graph
Return on equity (R.O.E)
In year 13 Kick Shoe company saw a decrease on its average return on equity from 18.7% to
15.3%, this indicates that the market shares for each stock dropped in the dividend attraction.
Figure 7: return on equity.
Stock Price
Due to the seemingly slump on return on equity, the company’s stock quote on the stock market
went down from $51.35 to $34.48. However, the investor expectation was still up, expecting an
increase stock price to get back their profits.
Paraphrase This Document
Need a fresh take? Get an instant paraphrase of this document with our AI Paraphraser

Figure 8: Stock price for year 10-13
Terms Year 10 Year 11 Year 12 Year 13
Changes in
year 13
Earning
s per
Share
(EPS)
$3.89
3.21 3.17 3.03
Increased
Return
on
Equity
%(ROE)
17.3
19.7 17.7 15.3
Increased
Credit
Rating
B+ A- A- A - Same
Image
Rating
70 76 74 66 Decreased
Stock
Price
55.57 61.35 51.35 34.48 Decreased
FINANCIAL RATIO ANALYSES
Table 4: Company financial ratio

The company had a positive financial ratio in the year 13, where the interest coverage ratio
increased by 4.08% from 5.87% in year 12 to 9.95% in year 13. However, the debt to asset ratio
went down a little by 7% from 29% in Y-12 to 22% in Y-13 this was due to increased borrowing
and in-flexible asset expansion policy for the year 13 while the company was adopting an
increased production policy per worker, hence had to put in more resources into worker-
expenditure other than asset acquisition. In line of financial ratio, the company default risk ratio
decreased by 0.9%, this indicates a positive improvement in tender acquisition and insurance.
HUMAN RESOURCES
One of the company strategic plans for the year 13 was to increase worker productivity through
training, motivation i.e. by increase of incentives and increased supply to key markets. This was
a success for the company.
Table 5: Company statistics on worker productivity and investment
Year 10 11 12 13 Changes
Workers Productivity pairs
per worker (000’s)
6, 857 6,687 6,579 6,564 Increased
RATIOS/
YEAR
10 11 12 13 Changes
Interest
Coverage
Ratio
4.74% 5.94% 5.87% 9.95% Increased
Debt to Asset
Ratio
38% 33% 29% 22% Decreased
Default Risk
Ratio
1.96
(medium)
1.94
(medium)
2.57
(high)
1.60
(medium
)
Decreased
Credit Rating B+ B A- A- Same
⊘ This is a preview!⊘
Do you want full access?
Subscribe today to unlock all pages.

Trusted by 1+ million students worldwide
1 out of 20
Related Documents
Your All-in-One AI-Powered Toolkit for Academic Success.
+13062052269
info@desklib.com
Available 24*7 on WhatsApp / Email
Unlock your academic potential
Copyright © 2020–2025 A2Z Services. All Rights Reserved. Developed and managed by ZUCOL.


