KICK SHOES LTD: Year 13 Shareholders' Report Performance Review

Verified

Added on  2021/04/22

|16
|579
|31
Report
AI Summary
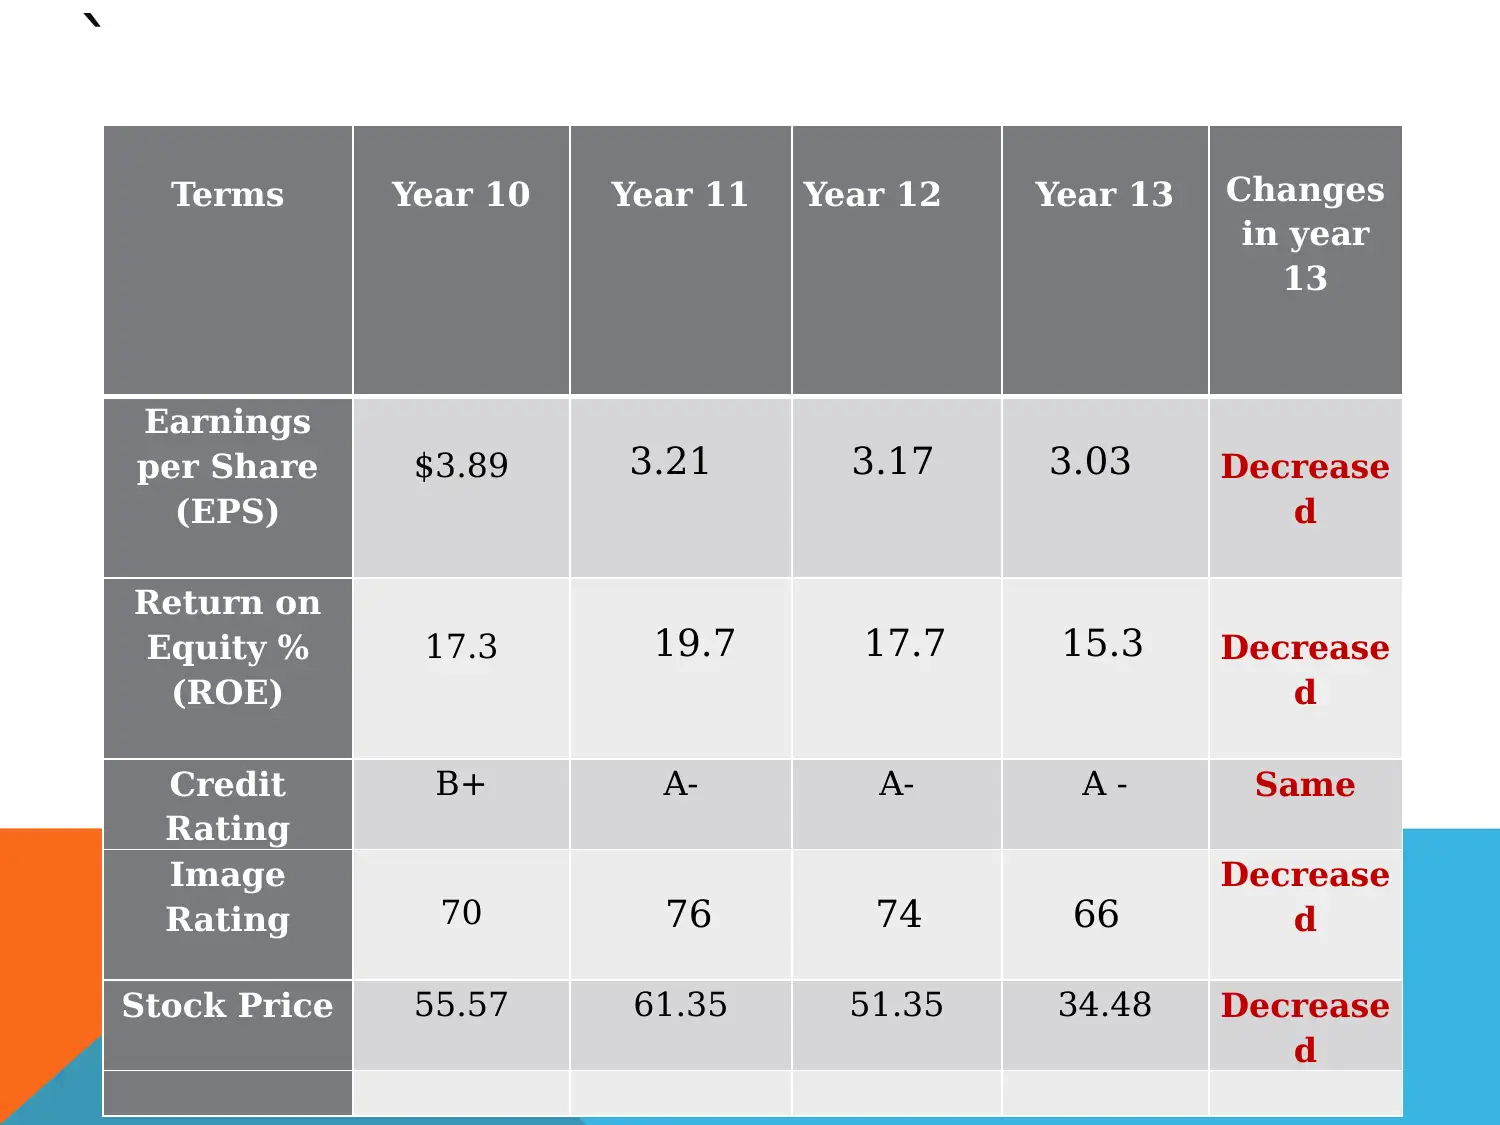
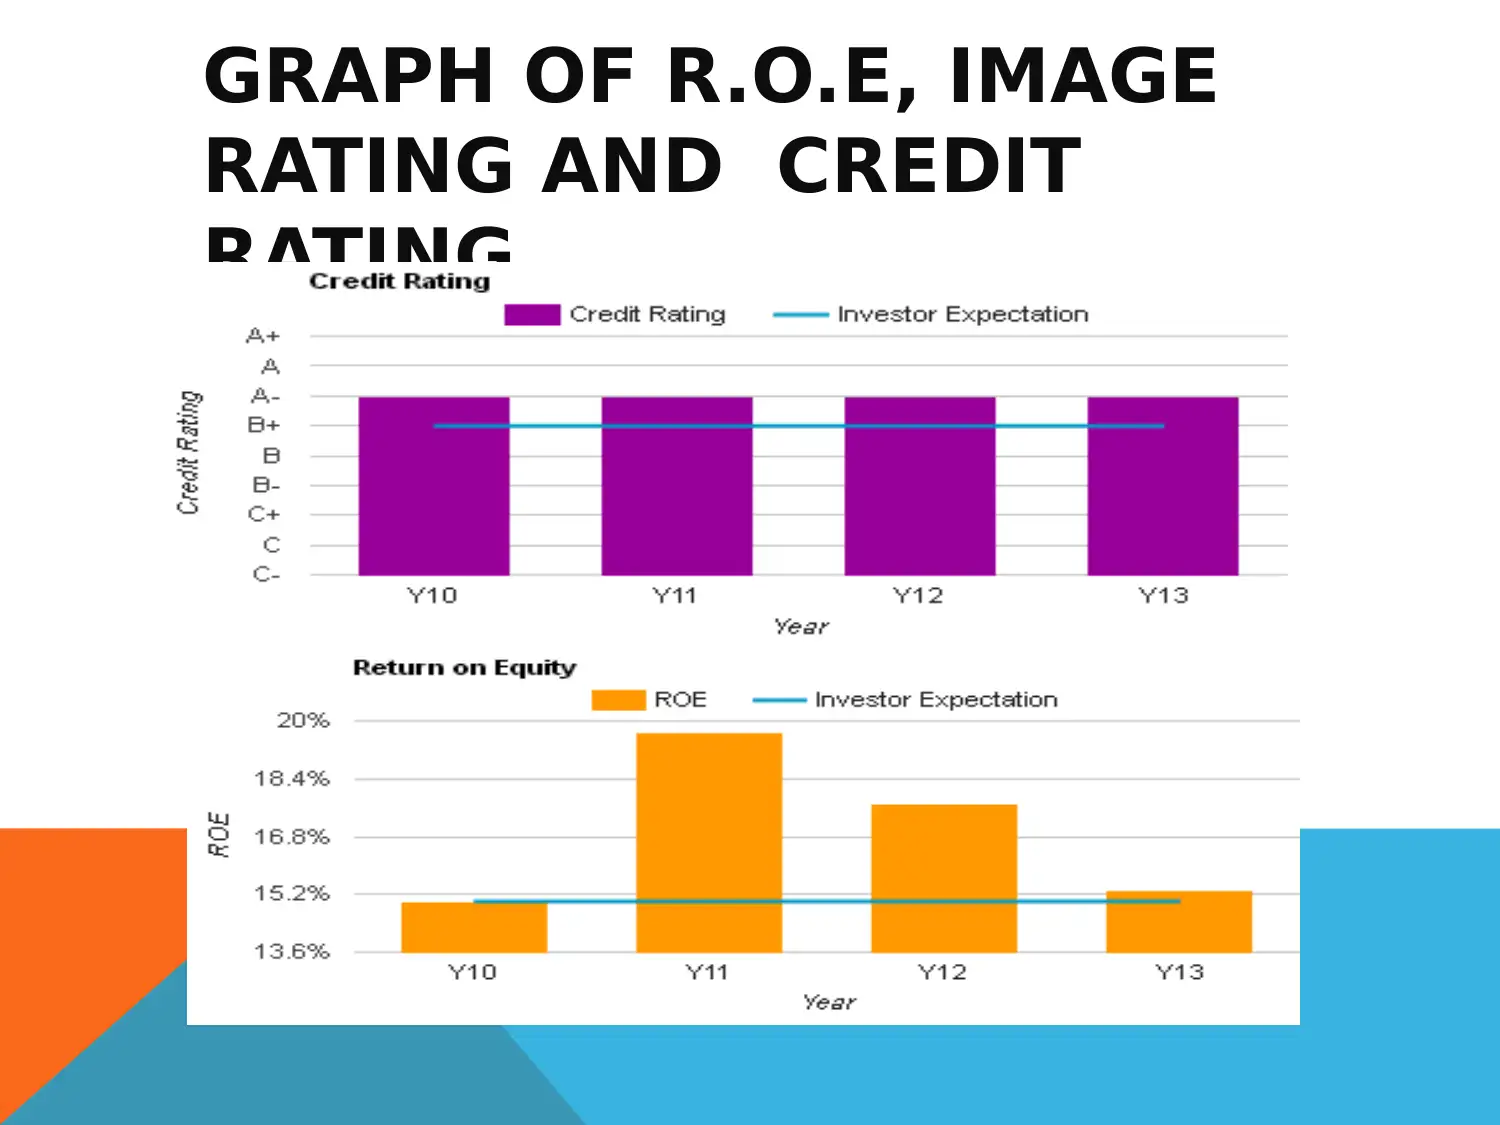
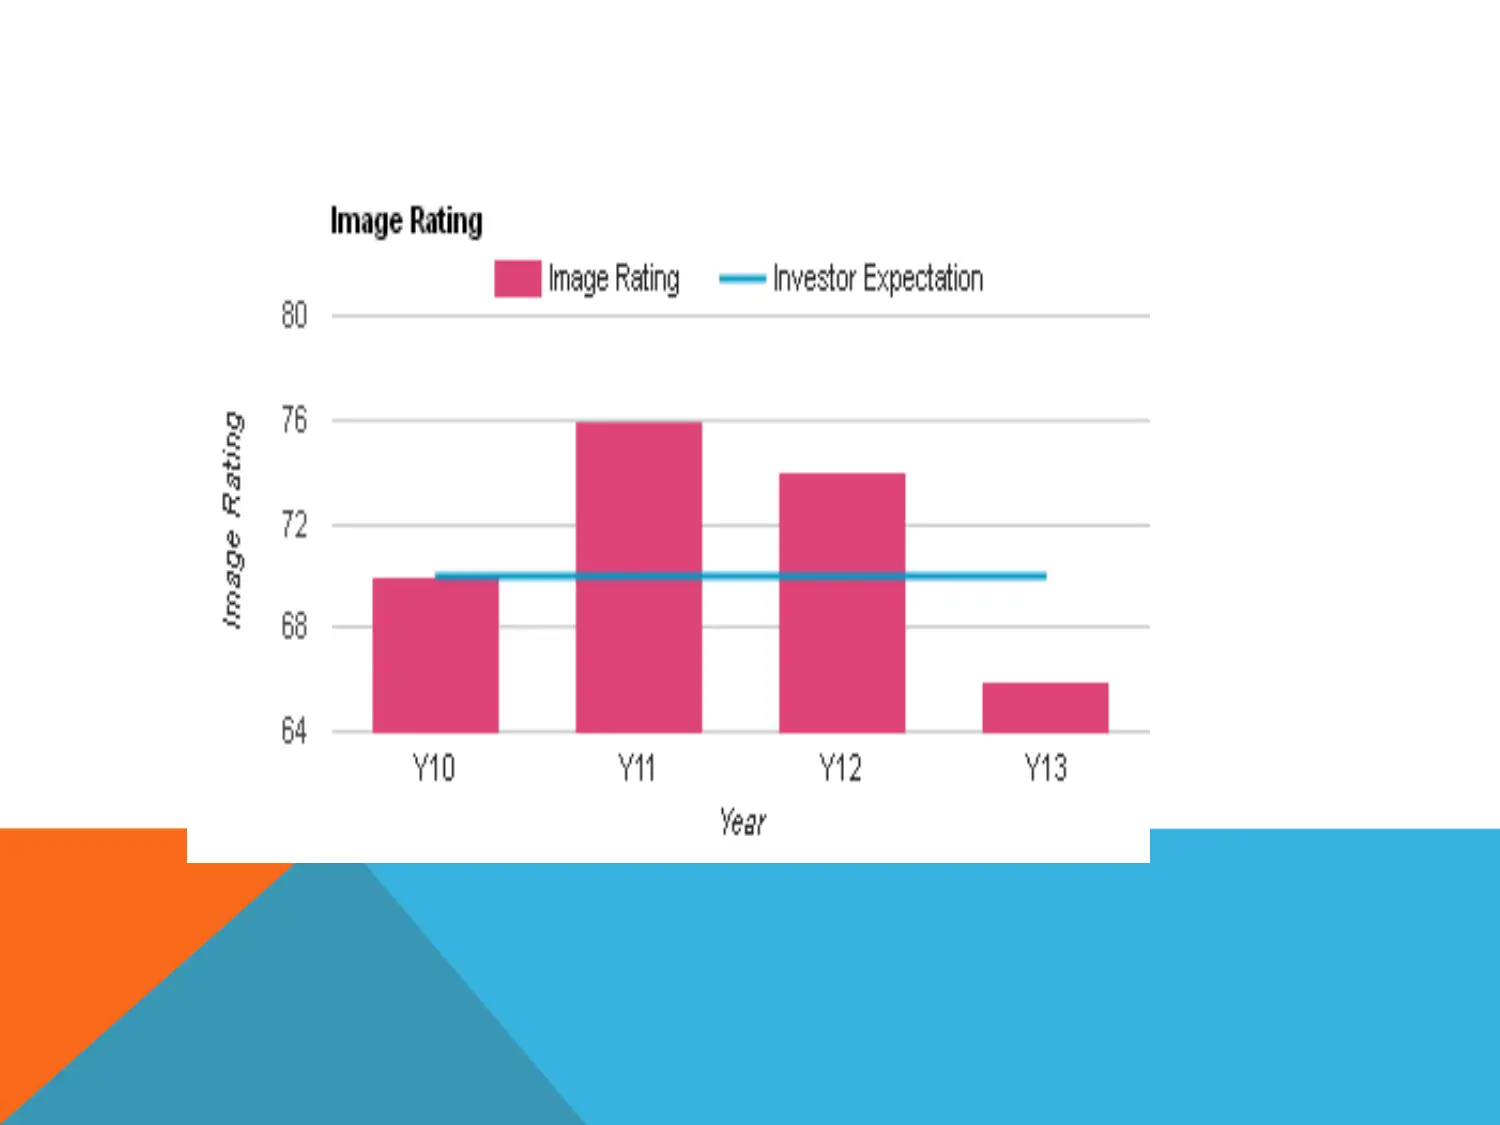
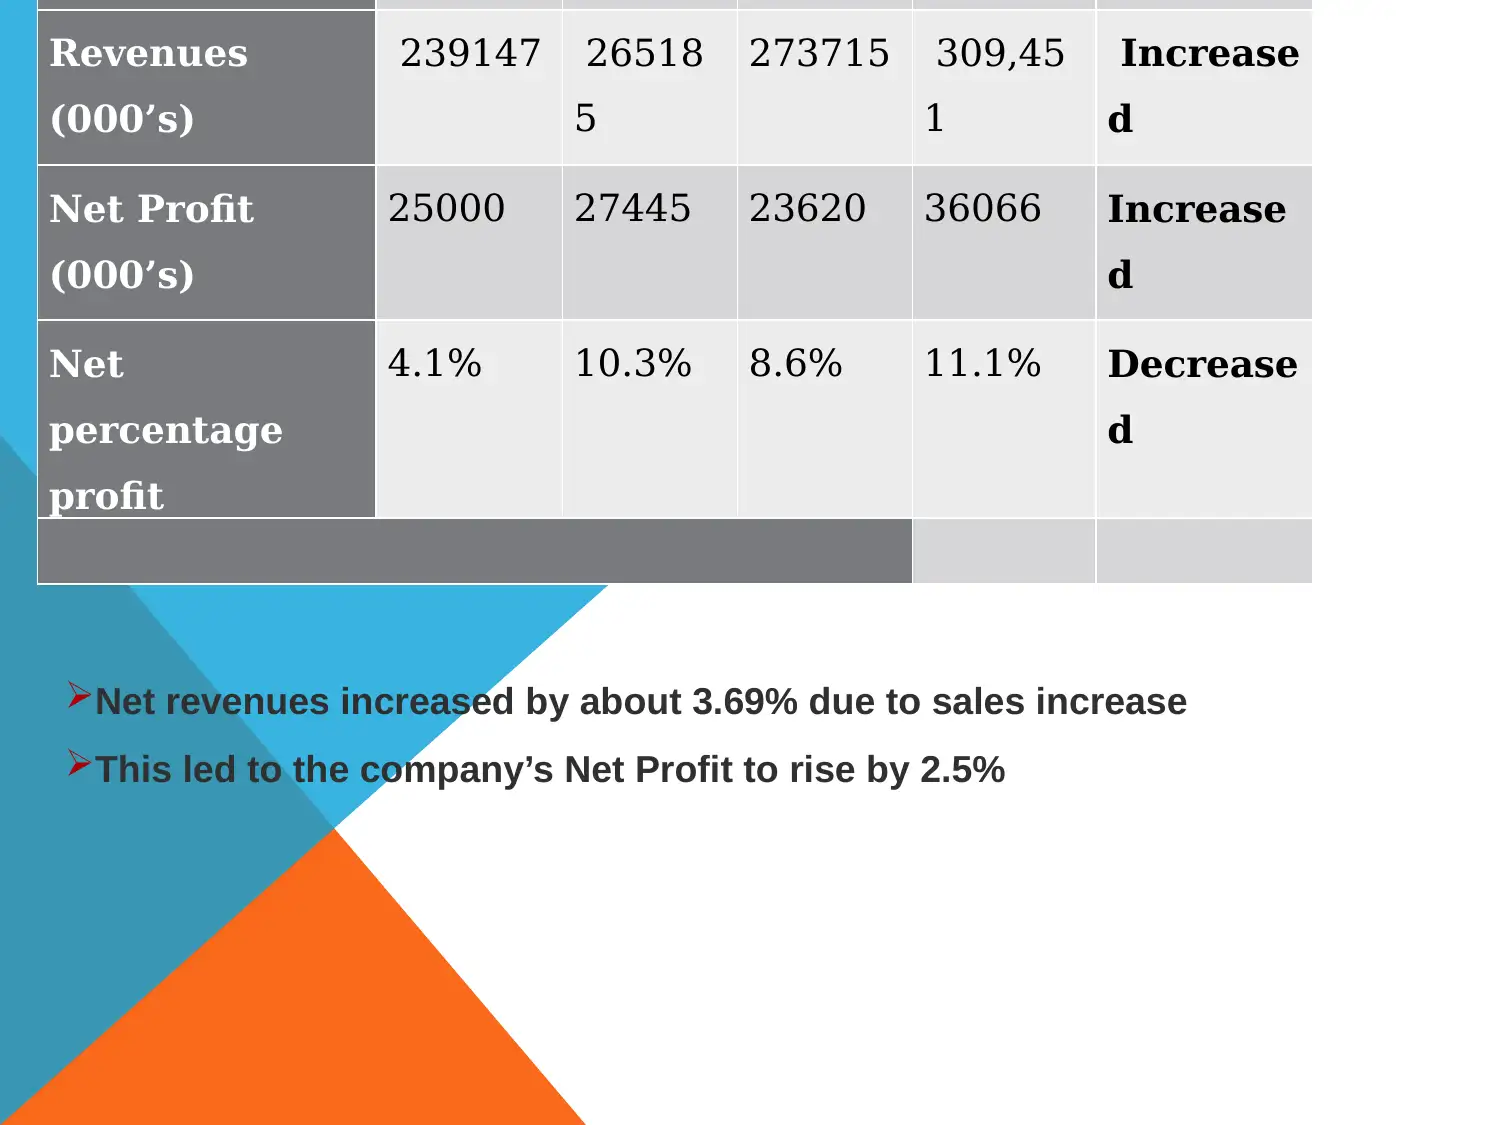
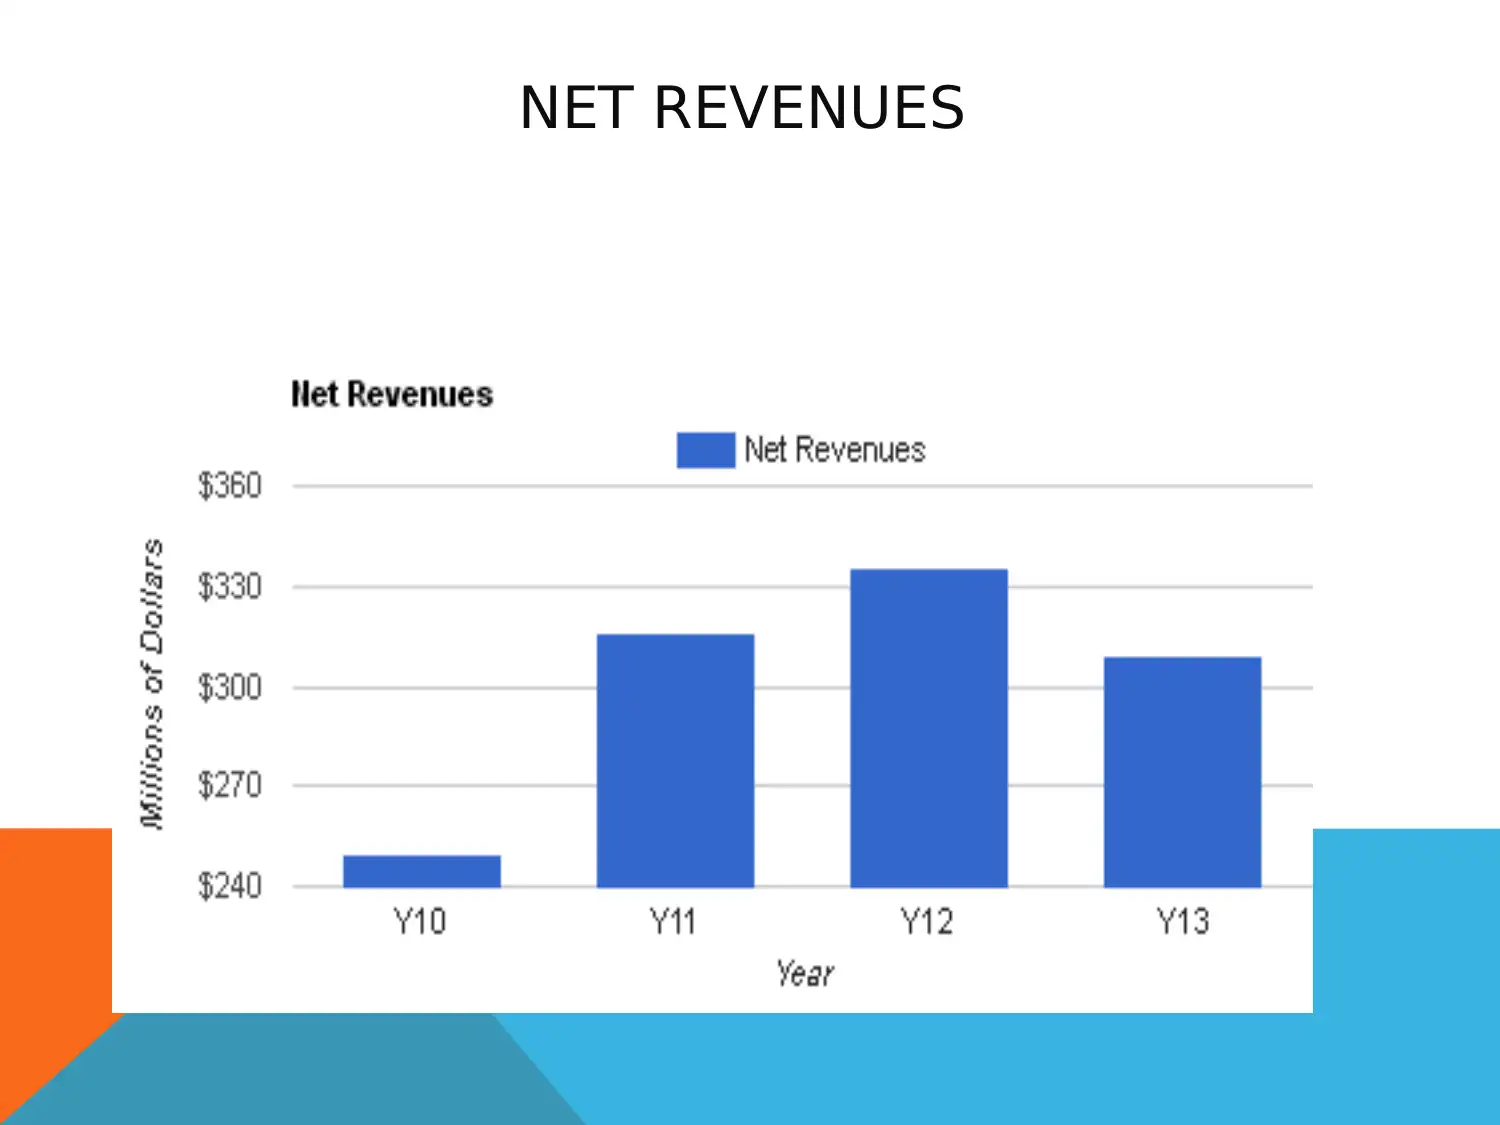
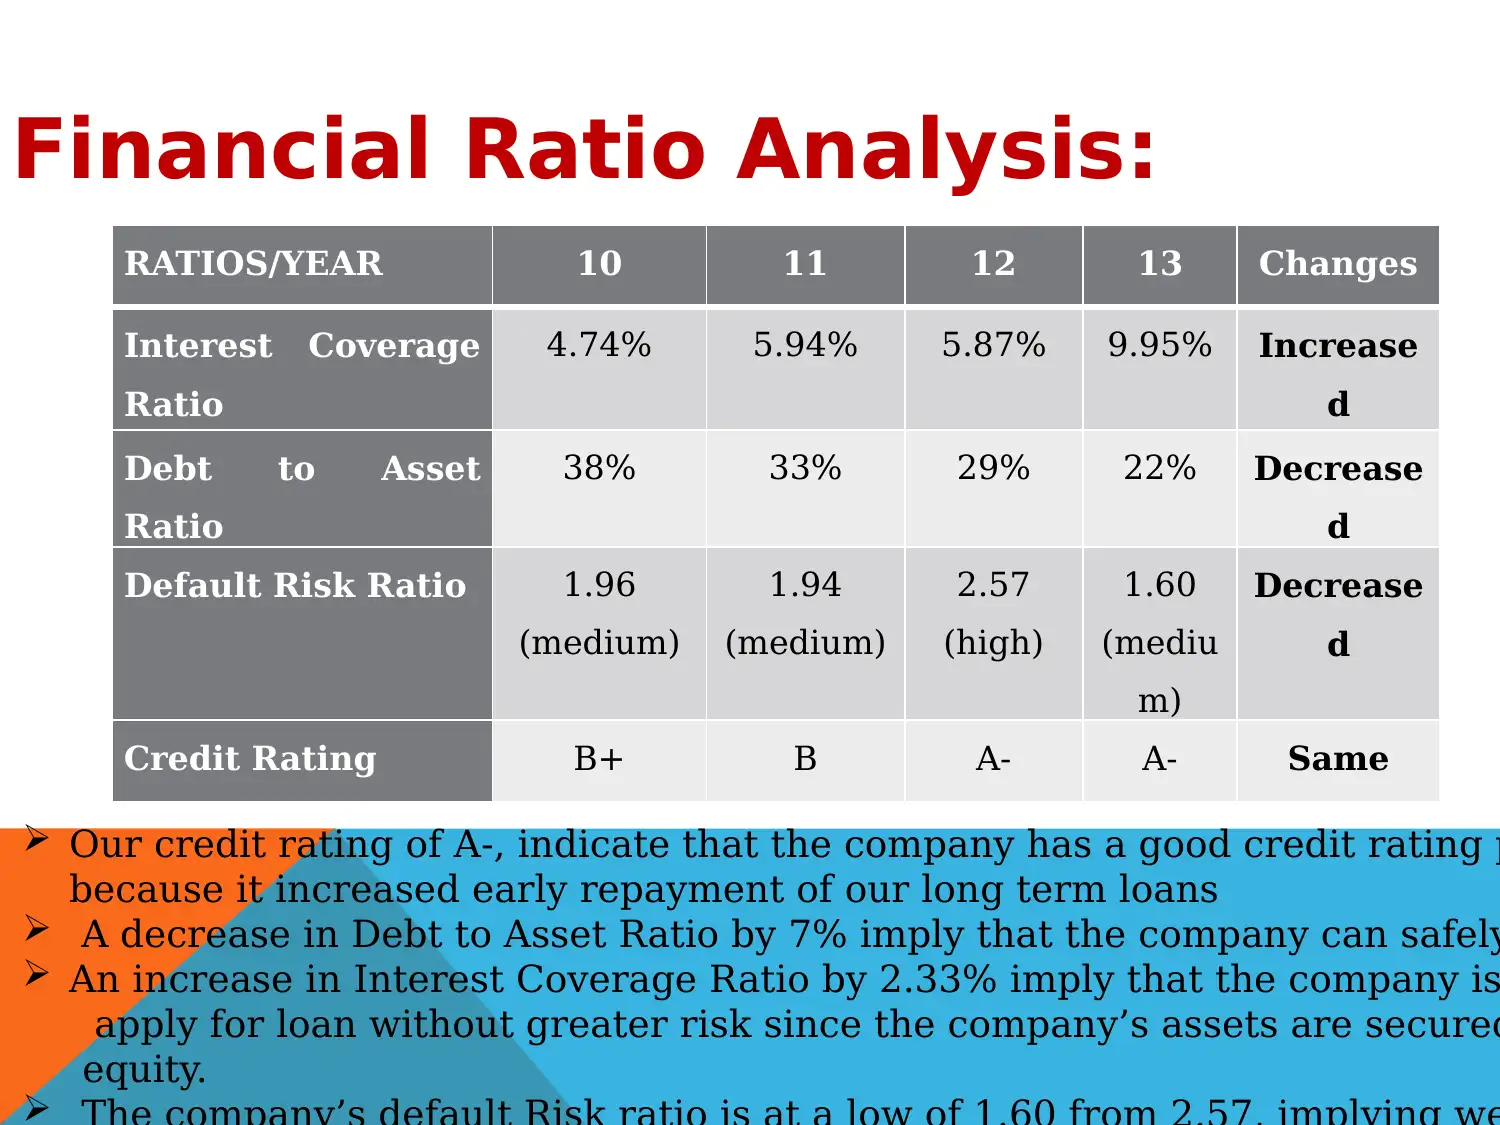
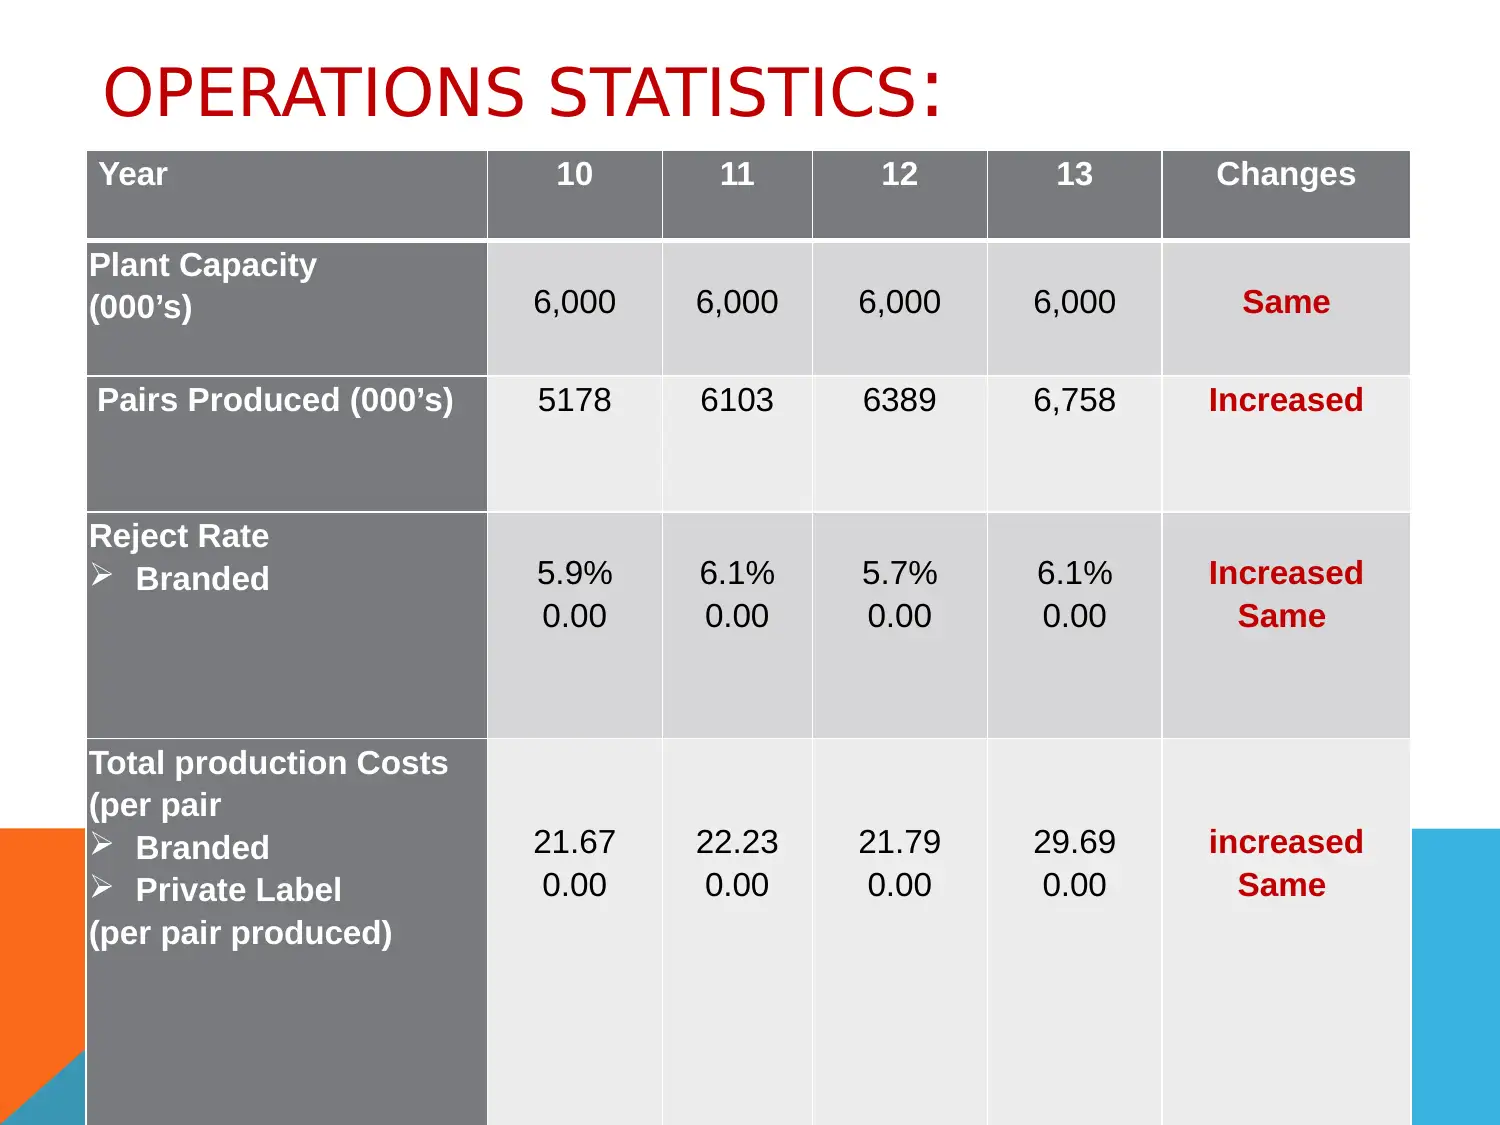
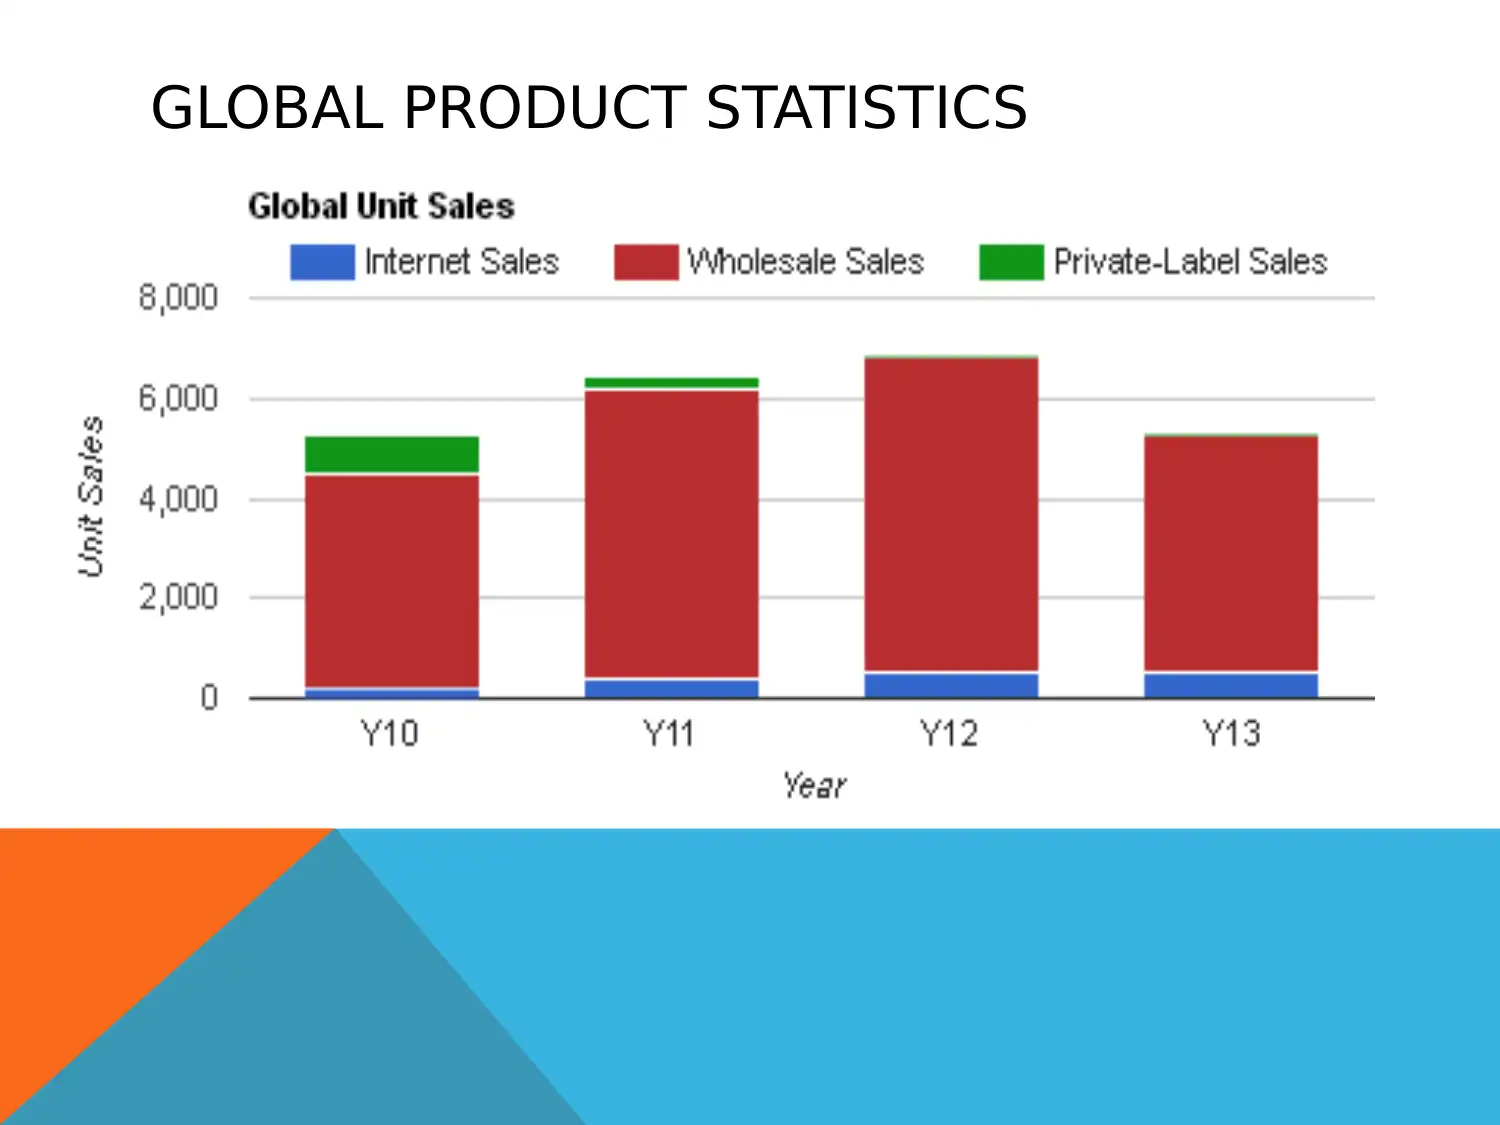
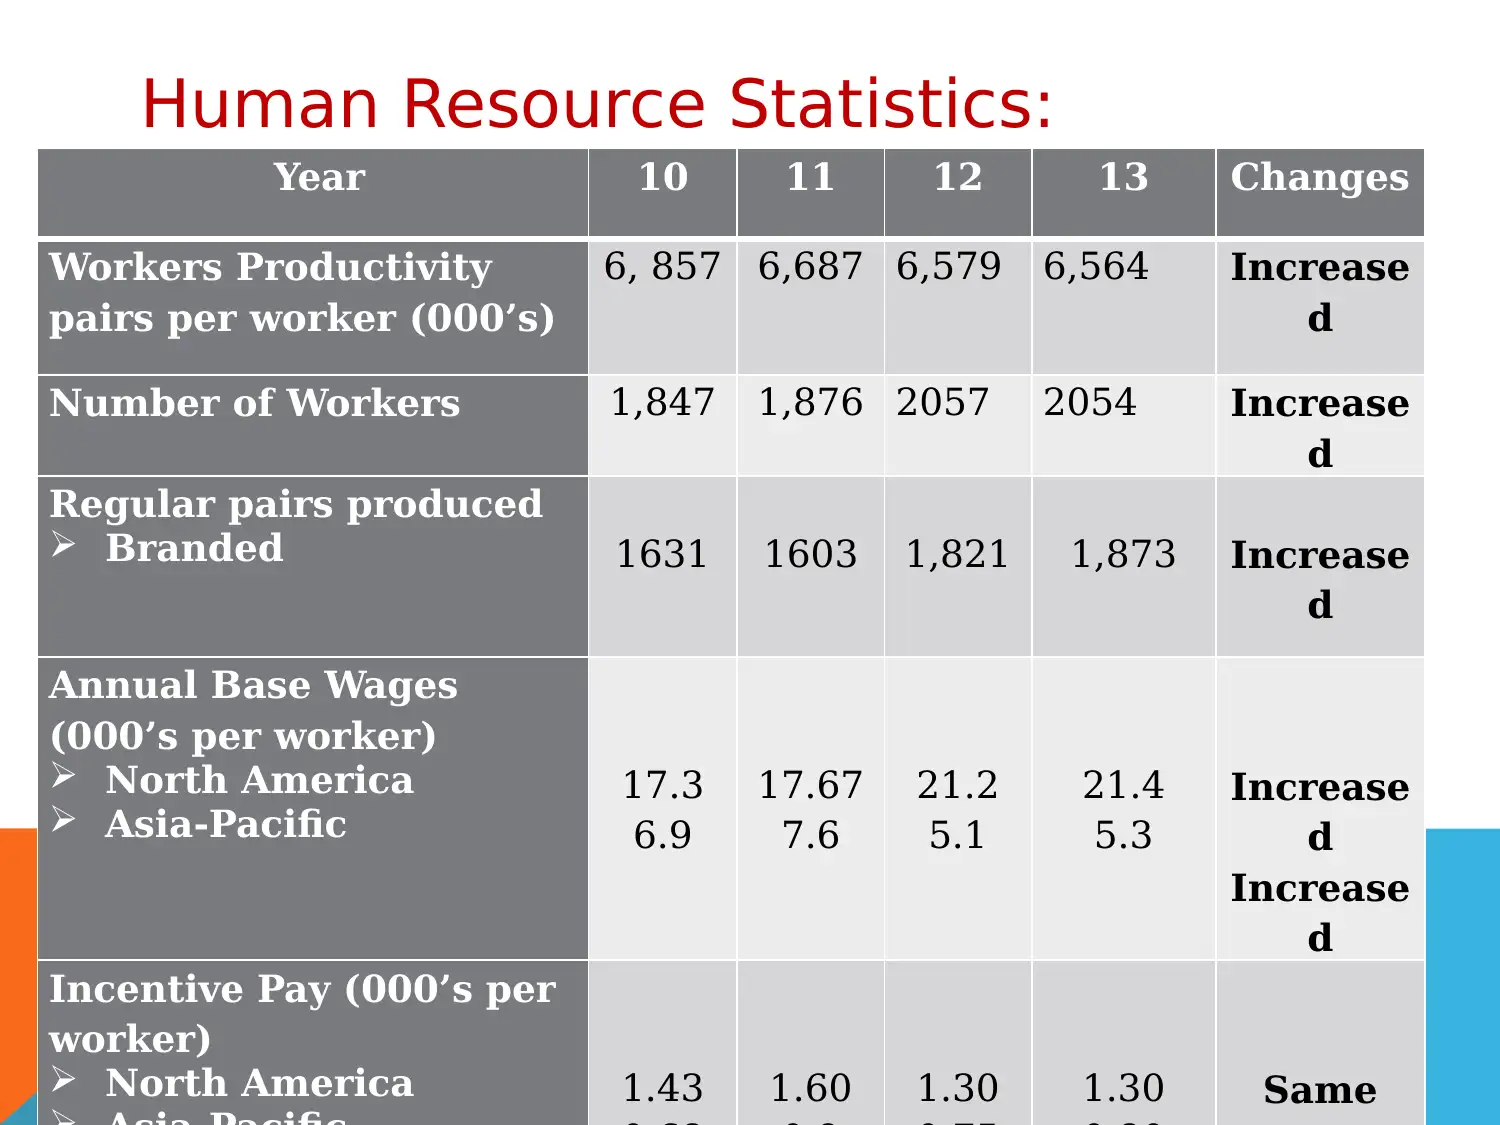
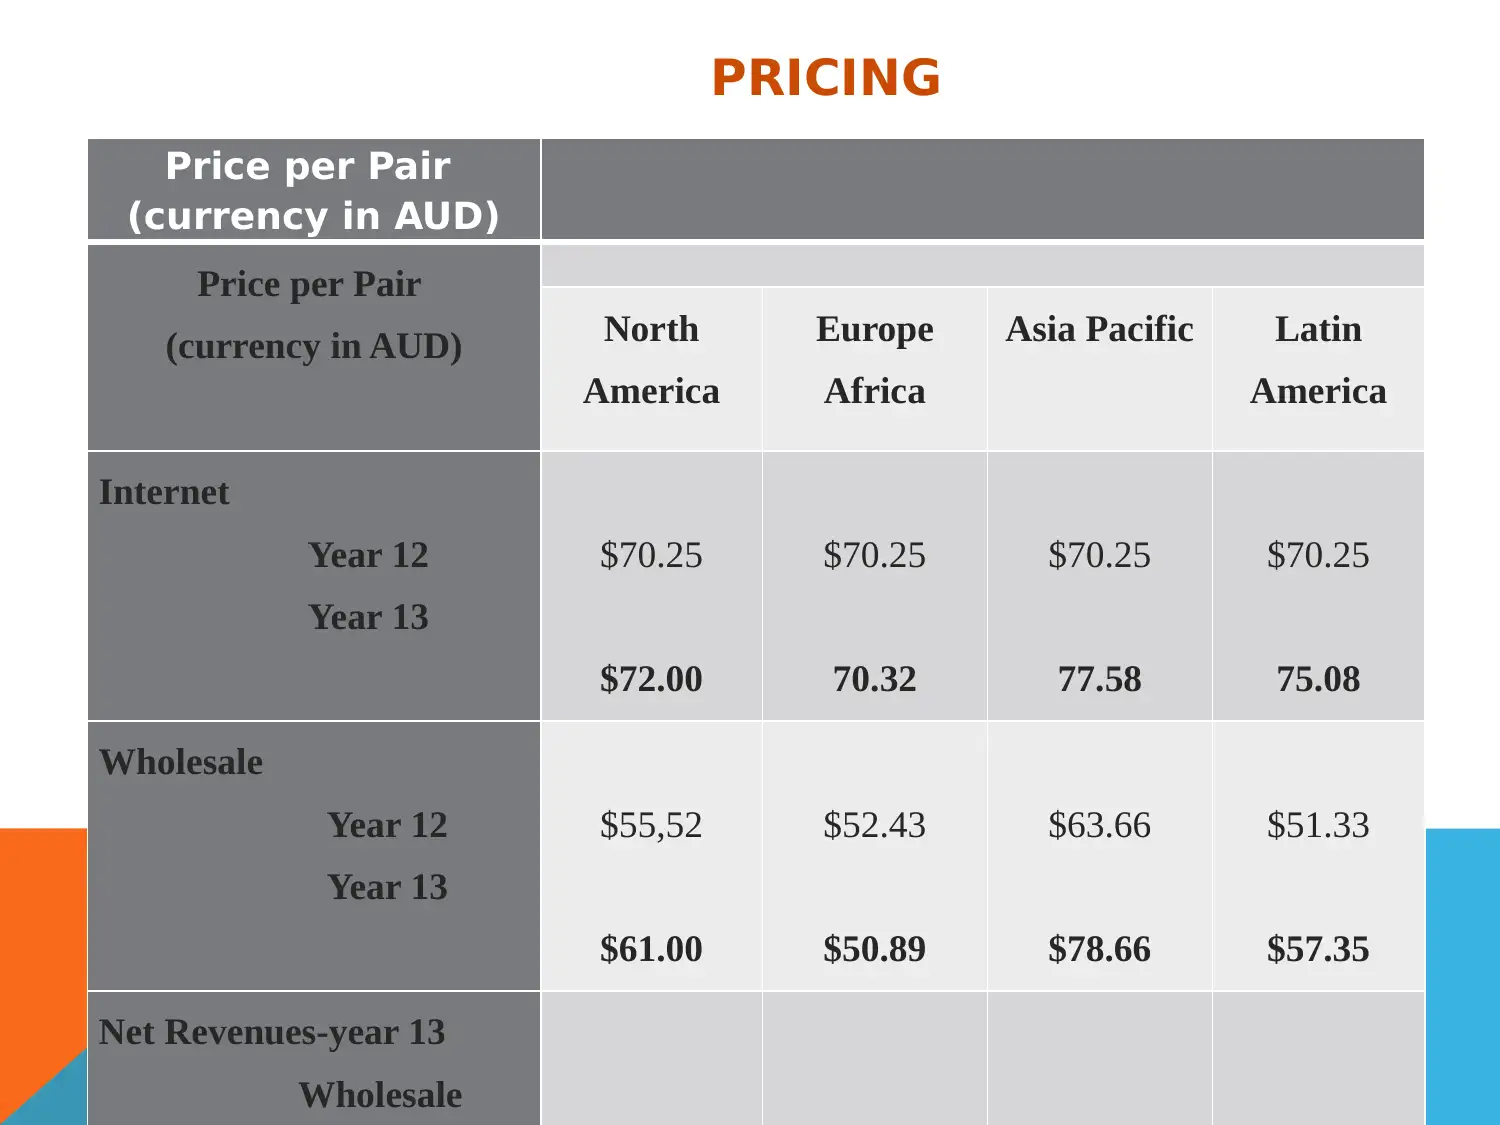
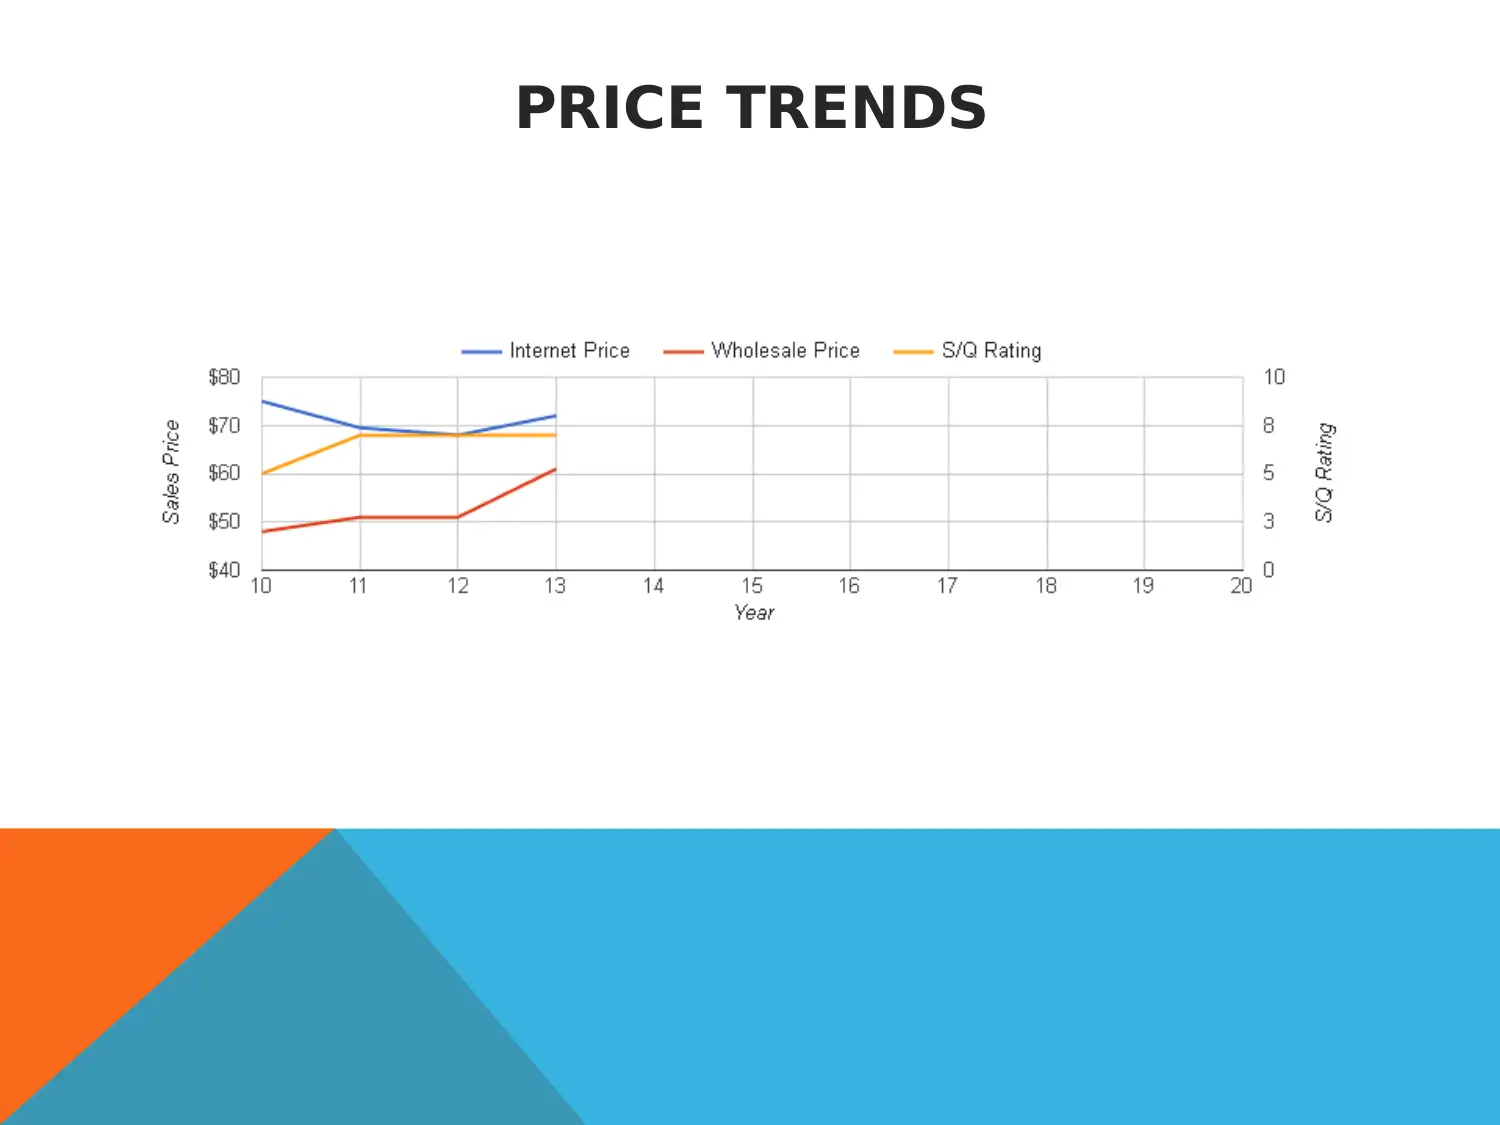
This report analyzes the Year 13 Shareholders' Report for Kick Shoes Limited, covering financial performance, operational statistics, and future strategies. Key financial highlights include a 3.69% increase in net revenues, a 2.5% rise in net profit, and a decrease in EPS. The company's credit rating remained high at A-, while the Debt to Asset Ratio decreased by 7%. Operational statistics reveal fully utilized plant capacity, an increased rejection rate in branded labels, and changes in production costs. Human resource statistics show increased worker productivity and employee numbers. The report also details pricing trends, advertising expenses, sales performance, and future strategies such as regulating prices, increasing worker training, and improving product quality. The report concludes with a financial team's overview of the company's performance and future plans to increase shareholder value.
Document Page
KICK SHOES LIMITED
S H A R E H O L D E R S ’ R E P O R T
Y E A R 1 3
Name: - Finance Manager*
Name: - Operations Manager*
Name: - Marketing Manager*
tabler-icon-diamond-filled.svg

Paraphrase This Document

Need a fresh take? Get an instant paraphrase of this document with our AI Paraphraser
Document Page
`
Terms Year 10 Year 11 Year 12 Year 13 Changes
in year
13
Earnings
per Share
(EPS)
$3.89 3.21 3.17 3.03 Decrease
d
Return on
Equity %
(ROE)
17.3 19.7 17.7 15.3 Decrease
d
Credit
Rating
B+ A- A- A - Same
Image
Rating 70 76 74 66
Decrease
d
Stock Price 55.57 61.35 51.35 34.48 Decrease
d
Document Page
GRAPH OF R.O.E, IMAGE
RATING AND CREDIT
RATING
Document Page
tabler-icon-diamond-filled.svg

Paraphrase This Document

Need a fresh take? Get an instant paraphrase of this document with our AI Paraphraser
Document Page
FINANCIAL PERFORMANCE:
Net revenues increased by about 3.69% due to sales increase
This led to the company’s Net Profit to rise by 2.5%
Revenues
(000’s)
239147 26518
5
273715 309,45
1
Increase
d
Net Profit
(000’s)
25000 27445 23620 36066 Increase
d
Net
percentage
profit
4.1% 10.3% 8.6% 11.1% Decrease
d
Document Page
NET REVENUES
Document Page
RATIOS/YEAR 10 11 12 13 Changes
Interest Coverage
Ratio
4.74% 5.94% 5.87% 9.95% Increase
d
Debt to Asset
Ratio
38% 33% 29% 22% Decrease
d
Default Risk Ratio 1.96
(medium)
1.94
(medium)
2.57
(high)
1.60
(mediu
m)
Decrease
d
Credit Rating B+ B A- A- Same
Financial Ratio Analysis:
Our credit rating of A-, indicate that the company has a good credit rating p
because it increased early repayment of our long term loans
A decrease in Debt to Asset Ratio by 7% imply that the company can safely
An increase in Interest Coverage Ratio by 2.33% imply that the company is
apply for loan without greater risk since the company’s assets are secured
equity.
tabler-icon-diamond-filled.svg

Paraphrase This Document

Need a fresh take? Get an instant paraphrase of this document with our AI Paraphraser
Document Page
Year 10 11 12 13 Changes
Plant Capacity
(000’s) 6,000 6,000 6,000 6,000 Same
Pairs Produced (000’s) 5178 6103 6389 6,758 Increased
Reject Rate
Branded 5.9%
0.00
6.1%
0.00
5.7%
0.00
6.1%
0.00
Increased
Same
Total production Costs
(per pair
Branded
Private Label
(per pair produced)
21.67
0.00
22.23
0.00
21.79
0.00
29.69
0.00
increased
Same
OPERATIONS STATISTICS:
Document Page
GLOBAL PRODUCT STATISTICS
Document Page
Human Resource Statistics:
Year 10 11 12 13 Changes
Workers Productivity
pairs per worker (000’s)
6, 857 6,687 6,579 6,564 Increase
d
Number of Workers 1,847 1,876 2057 2054 Increase
d
Regular pairs produced
Branded 1631 1603 1,821 1,873 Increase
d
Annual Base Wages
(000’s per worker)
North America
Asia-Pacific
17.3
6.9
17.67
7.6
21.2
5.1
21.4
5.3
Increase
d
Increase
d
Incentive Pay (000’s per
worker)
North America 1.43 1.60 1.30 1.30 Same
tabler-icon-diamond-filled.svg

Paraphrase This Document

Need a fresh take? Get an instant paraphrase of this document with our AI Paraphraser
Document Page
Price per Pair
(currency in AUD)
Price per Pair
(currency in AUD) North
America
Europe
Africa
Asia Pacific Latin
America
Internet
Year 12
Year 13
$70.25
$72.00
$70.25
70.32
$70.25
77.58
$70.25
75.08
Wholesale
Year 12
Year 13
$55,52
$61.00
$52.43
$50.89
$63.66
$78.66
$51.33
$57.35
Net Revenues-year 13
Wholesale
PRICING
Document Page
PRICE TRENDS
chevron_up_icon
1 out of 16
circle_padding
hide_on_mobile
zoom_out_icon
[object Object]