Kingfisher Bay Real Estate Institute: Housing Price and Rent Analysis
VerifiedAdded on 2024/04/24
|7
|2335
|195
Report
AI Summary
This report analyzes housing prices and associated factors in the Kingfisher Bay area of Melbourne, based on data from 120 households. It examines the average and median house prices, finding a slight difference indicating higher-priced homes in the area. The report uses Z-tests to identify significant differences between suburban areas, property conditions, and house prices. Correlation analysis reveals a positive relationship between house prices and rental income, with street appeal and bay views being key influencers. The analysis also finds that average weekly rents are not universally above $600 across all suburbs, though a majority of properties are over 10 years old. Finally, the report compares survey data to initial assumptions about average house prices and vacancy rates, highlighting discrepancies that suggest a need for further investigation. Desklib provides access to this and other solved assignments to aid students in their studies.
Table of Contents
Executive Summary.....................................................................................................................................2
Content........................................................................................................................................................3
Part 1 – Prices available in the city..........................................................................................................3
Part 2 – House prices significantly different with conditions and suburban............................................3
Part 3 – Relationship between the house prices and the factors which influences them..........................4
Part 4 – average rent and age of the property...........................................................................................5
Part 5 – Survey........................................................................................................................................6
Conclusion...................................................................................................................................................6
References...................................................................................................................................................7
Paraphrase This Document
Need a fresh take? Get an instant paraphrase of this document with our AI Paraphraser
Executive Summary
The basic purpose of this assignment is to analyse the data pertaining to the house prices and
associated factors in the Melbourne area. As per this assignment, Sandy is the manager of the
research team in the REIV, which is focused in analysing the various data which includes the
prices of the house, the rental revenues, returns expected from the investment etc. In a recent
project, the manager of the research team has undetaken a pilot survey in the Kingfisher bay, the
research team has began to collage various details pertaining to the prices of houses in the area,
rental costs, returns generated, the REIV is mainly interested in uderstanding the price
movements in the Kingfisher Bay, and the analysis is more focused in analysing the suburban
areas of the chosen city.
The main theme of this research is based on the memorandum received from the Director of
Housing Affordability Division in the real estate institute. The director is of the opinion that the
city of Kingfisher bay is one of the most expensive areas in the City of Melbourne and many
individuals finding it difficult to rent as the prices are high. However, the council of the bay feels
that such aspects are not true, so they have decided to investigate this aspects which intends to
focus on the prices of the houses and the rents which is charged across the suburban areas of the
chosen city. The director has posted five key questions which forms the basis of the research
report, they are involved in understanding the average prices of the house and whether the
median prices and the mean prices are the same, the director has also looking to test the
significant differences between the three key variables like conditions, suburban areas and prices
of the household in the Kingfisher bay, the thir question is mainly involved to test the
relationship between the prices of the house and the rental income, also to understand the key
indicators for the higher prices. The next part is to check whether the average retal prices of all
suburbs are more than $600 and the properties in the area are more than 10 years with a
proportion of at least 75%. Finally, the average prices are looking to check if the values are
nearly $50,000 and the vacant propertis in the area is within the range of nearly 3%. The
manager of the research team has collated the data pertaining to 120 houeholds in the locality
and all the analysis is made based on these data.
Content
Part 1 – Prices available in the city
The first part of the analysis is to understand the average prices of the houses in the Kingifsher
bay, based on the data which is collated from 120 households. The director has posted to the
researcher that the median prices are being stated in the newspaper, the director is of the opinion
that the mean price and the median prices are the same. But it should be noted that the average
price and the median price are different, the mean price is computed by suming up all the values
and dividing it by the total number of values, however the median price is the middle value, this
states that exactly half of the houses are stated as the price above and half the houses are stated
above these price. (Witte, 2010)
The median is considered as the set of values which is the half the numbers above and the half
the numbers are below the price, these values are stated to be more reliable as these values are in
the middle, whereas the average price is the values computed as the sum of all the numbers
dividing by total number of values, the average price is dependent on all the values which is
considered for the analysis. Based on the analysis it is identified that the average price of the
house is $868,580 whereas the median price is $852,000, so the prices which is stated in the
newspaper is of median values however the average price is marginally higher than the average
price. If the average values in the given area are higher than the media value, it states that the
area contains more significantly higher prices of the houses. It is observed that median is
considered as the intrinsically easy and understandable as these values are not affected by any
outliers.
Part 2 – House prices significantly different with conditions and suburban
Based on the overall analysis it is idenified that the 12.5% of the houses were in a very poor
condition, 33.33% of the houses were in a state of poor condition in the Kingfisher bay area,
however 35% of the households possess good conditions and the remaining 19.17% of the
houses were having excellent conditions. (Sarah, 2012)
The next step is to measure the significant differences between the suburb and the conditions of
the households. For this purpose, Z test is being conducted, this is used to measure the two
populations of the means when the variances are known. The researcher has made a null
assumption that there is no significant differences between the suburban and the conditions, It is
⊘ This is a preview!⊘
Do you want full access?
Subscribe today to unlock all pages.
Trusted by 1+ million students worldwide
noted that the p value computed (p two tail value) is 0.00 which is less than the significance
value of 0.05, therefore the null hypothesis is rejected and alternate hypothesis is accepted. So, it
is conncluded that there exists a significant difference among the variables. The z test is used as
it enables in assuming that the data is normally distributed and other parameters
The researcher is also interested to measure the significant difference between the prices of the
house and the conditions in the Kingfisher bay. The null hypothesis is stated that there is no
significant difference betwee the prices of the house and the conditions, from the analysis it is
identified that the p value computed (p two tail value) is 0.00 which is less than the significance
value of 0.05, therefore alternate hypothesis is accepted, Hence, it can be concluded that there is
a significant difference between the variables. (Sincich, 2012)
The last step is to test if there is any significant difference between the conditions and the prices
of the household in the Kingfisher bay. The researcher has placed a null hypothesis as there is no
significant differences between the conditions and the prices of the household, from the
computation it is identified that the p value computed (p two tail value) is 0.00 which is less than
the significance value of 0.05, therefore alternate hypothesis is accepted, Hence, it can be
concluded that there is a significant difference between the variables.
Part 3 – Relationship between the house prices and the factors which influences them
The researcher has intend to understand the relationship between the price of the house and the
factors which influences them, the other variables which is considered are: Rooms; LotSizesqm;
Age; Areasqm; Material; ToTrainkm; ToBuskm; ToShopskm; Street; Storeys; Style; Bedrooms;
Bathrooms; Kitchen; Heating; AirCon; BayViews and Suburb. Also, the director of the research
team is also interested to know whether the prices are good rental investment, so to measure
these relationship correlation analyses is used. (Freedman, 2010)
The correlation analysis is a method of statistical analysis used to test the strength of two
consecutive variables in numerical terms (eg length and weight). This type of analysis is useful if
a researcher wants to know if there are potential variables among the variables. It is often
misunderstood that the correlation analysis determines the cause and effect; However, this is not
because other variables that are not included in the survey can affect the results. If the
relationship between two variables means that if a variable periodic change occurs, then the other
Paraphrase This Document
Need a fresh take? Get an instant paraphrase of this document with our AI Paraphraser
changes systematically. The correlation between Pearson product moment and between intervals
(depending on correlacciol) at -1 and +1 indicates the strongest possible positive correlation and
-1 indicates the strongest possible negative correlation. Therefore, the higher the coefficient
relative to one or more numbers , the greater is the correlation between the data they represent. In
this scale, 0 shows no correlation, so the values closer to zero show a weaker / lower correlation
than close to + 1 / -1.
From the analysis it is identified that the correlation between the weekly rent is 0.66 which is a
positive coefficient, this shows that when the prices of the houshold is increasing the rental
prices also tends to increase, this reveals that the higher prices is being driven based on the rental
investments. As per the requirements, the other variables which influences the higher house
prices is noted as
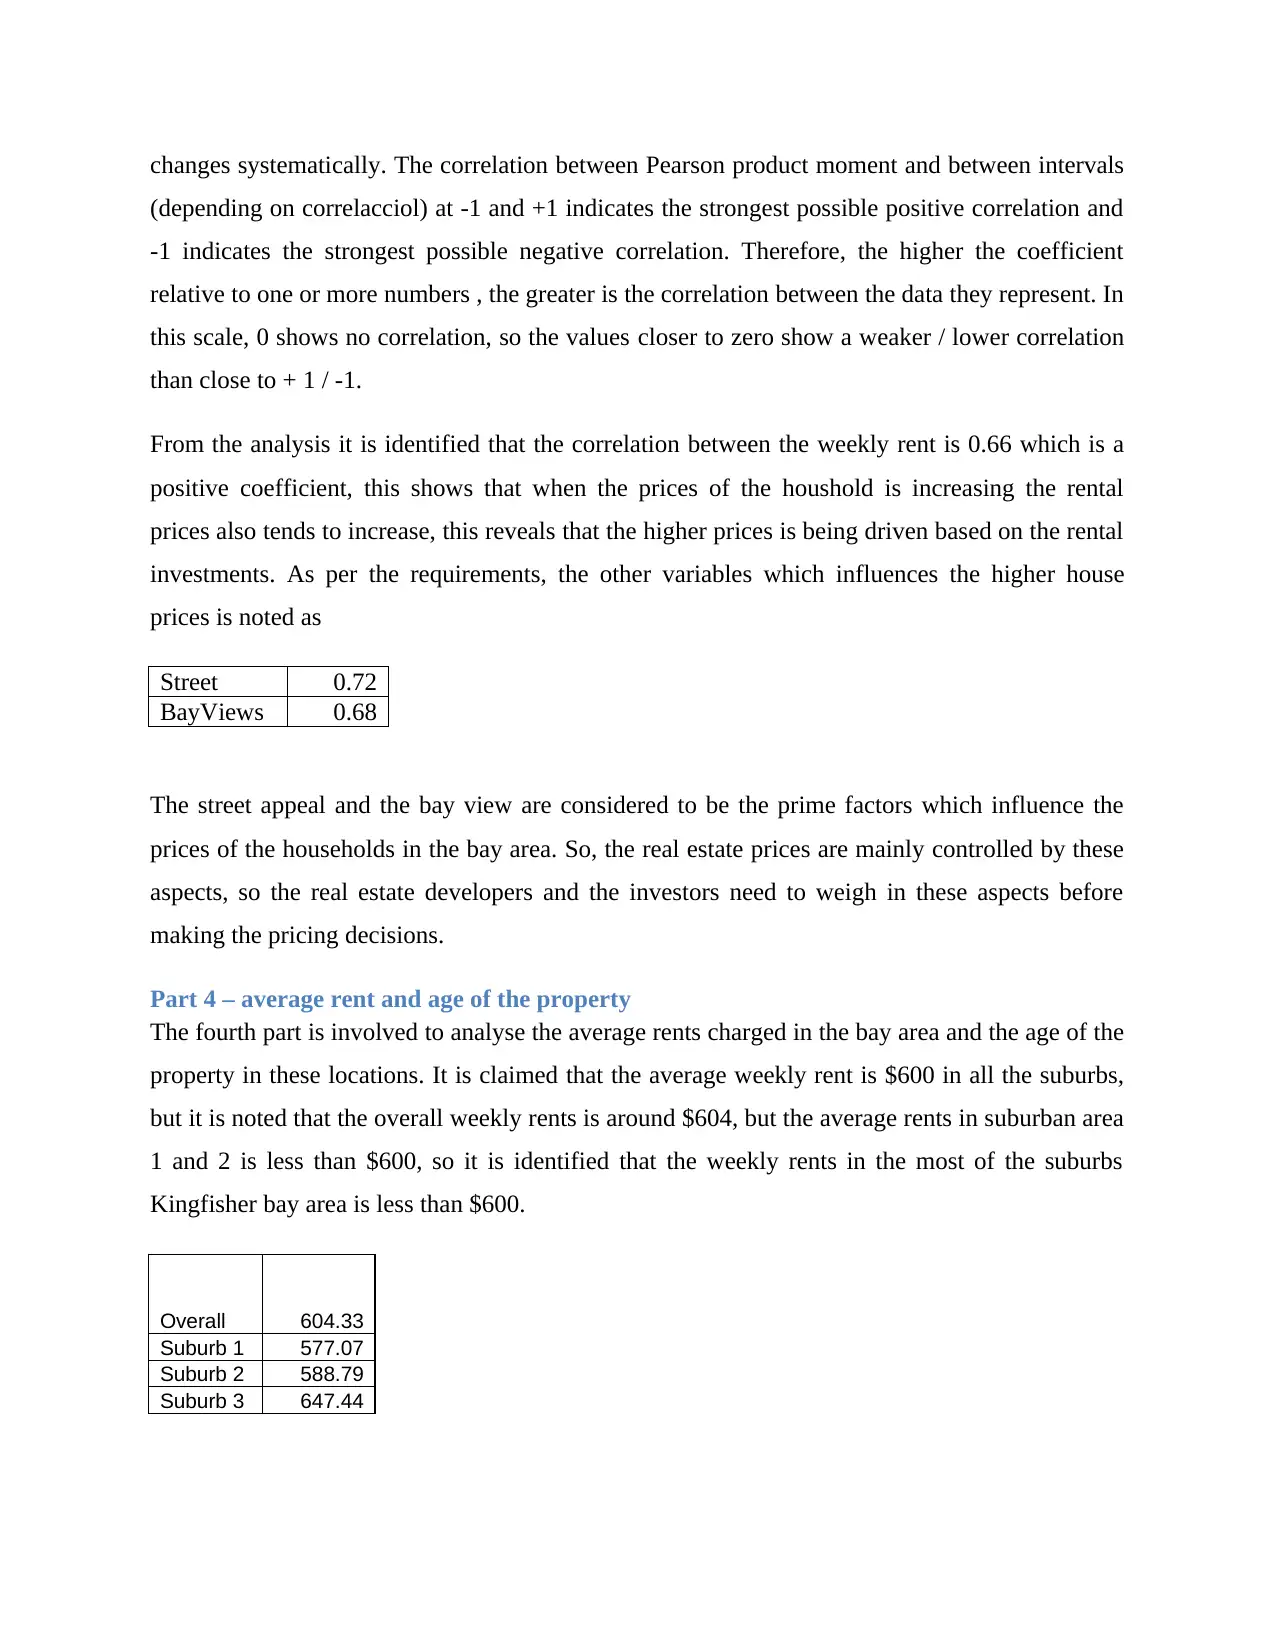
Street 0.72
BayViews 0.68
The street appeal and the bay view are considered to be the prime factors which influence the
prices of the households in the bay area. So, the real estate prices are mainly controlled by these
aspects, so the real estate developers and the investors need to weigh in these aspects before
making the pricing decisions.
Part 4 – average rent and age of the property
The fourth part is involved to analyse the average rents charged in the bay area and the age of the
property in these locations. It is claimed that the average weekly rent is $600 in all the suburbs,
but it is noted that the overall weekly rents is around $604, but the average rents in suburban area
1 and 2 is less than $600, so it is identified that the weekly rents in the most of the suburbs
Kingfisher bay area is less than $600.
Overall 604.33
Suburb 1 577.07
Suburb 2 588.79
Suburb 3 647.44
(depending on correlacciol) at -1 and +1 indicates the strongest possible positive correlation and
-1 indicates the strongest possible negative correlation. Therefore, the higher the coefficient
relative to one or more numbers , the greater is the correlation between the data they represent. In
this scale, 0 shows no correlation, so the values closer to zero show a weaker / lower correlation
than close to + 1 / -1.
From the analysis it is identified that the correlation between the weekly rent is 0.66 which is a
positive coefficient, this shows that when the prices of the houshold is increasing the rental
prices also tends to increase, this reveals that the higher prices is being driven based on the rental
investments. As per the requirements, the other variables which influences the higher house
prices is noted as
Street 0.72
BayViews 0.68
The street appeal and the bay view are considered to be the prime factors which influence the
prices of the households in the bay area. So, the real estate prices are mainly controlled by these
aspects, so the real estate developers and the investors need to weigh in these aspects before
making the pricing decisions.
Part 4 – average rent and age of the property
The fourth part is involved to analyse the average rents charged in the bay area and the age of the
property in these locations. It is claimed that the average weekly rent is $600 in all the suburbs,
but it is noted that the overall weekly rents is around $604, but the average rents in suburban area
1 and 2 is less than $600, so it is identified that the weekly rents in the most of the suburbs
Kingfisher bay area is less than $600.
Overall 604.33
Suburb 1 577.07
Suburb 2 588.79
Suburb 3 647.44
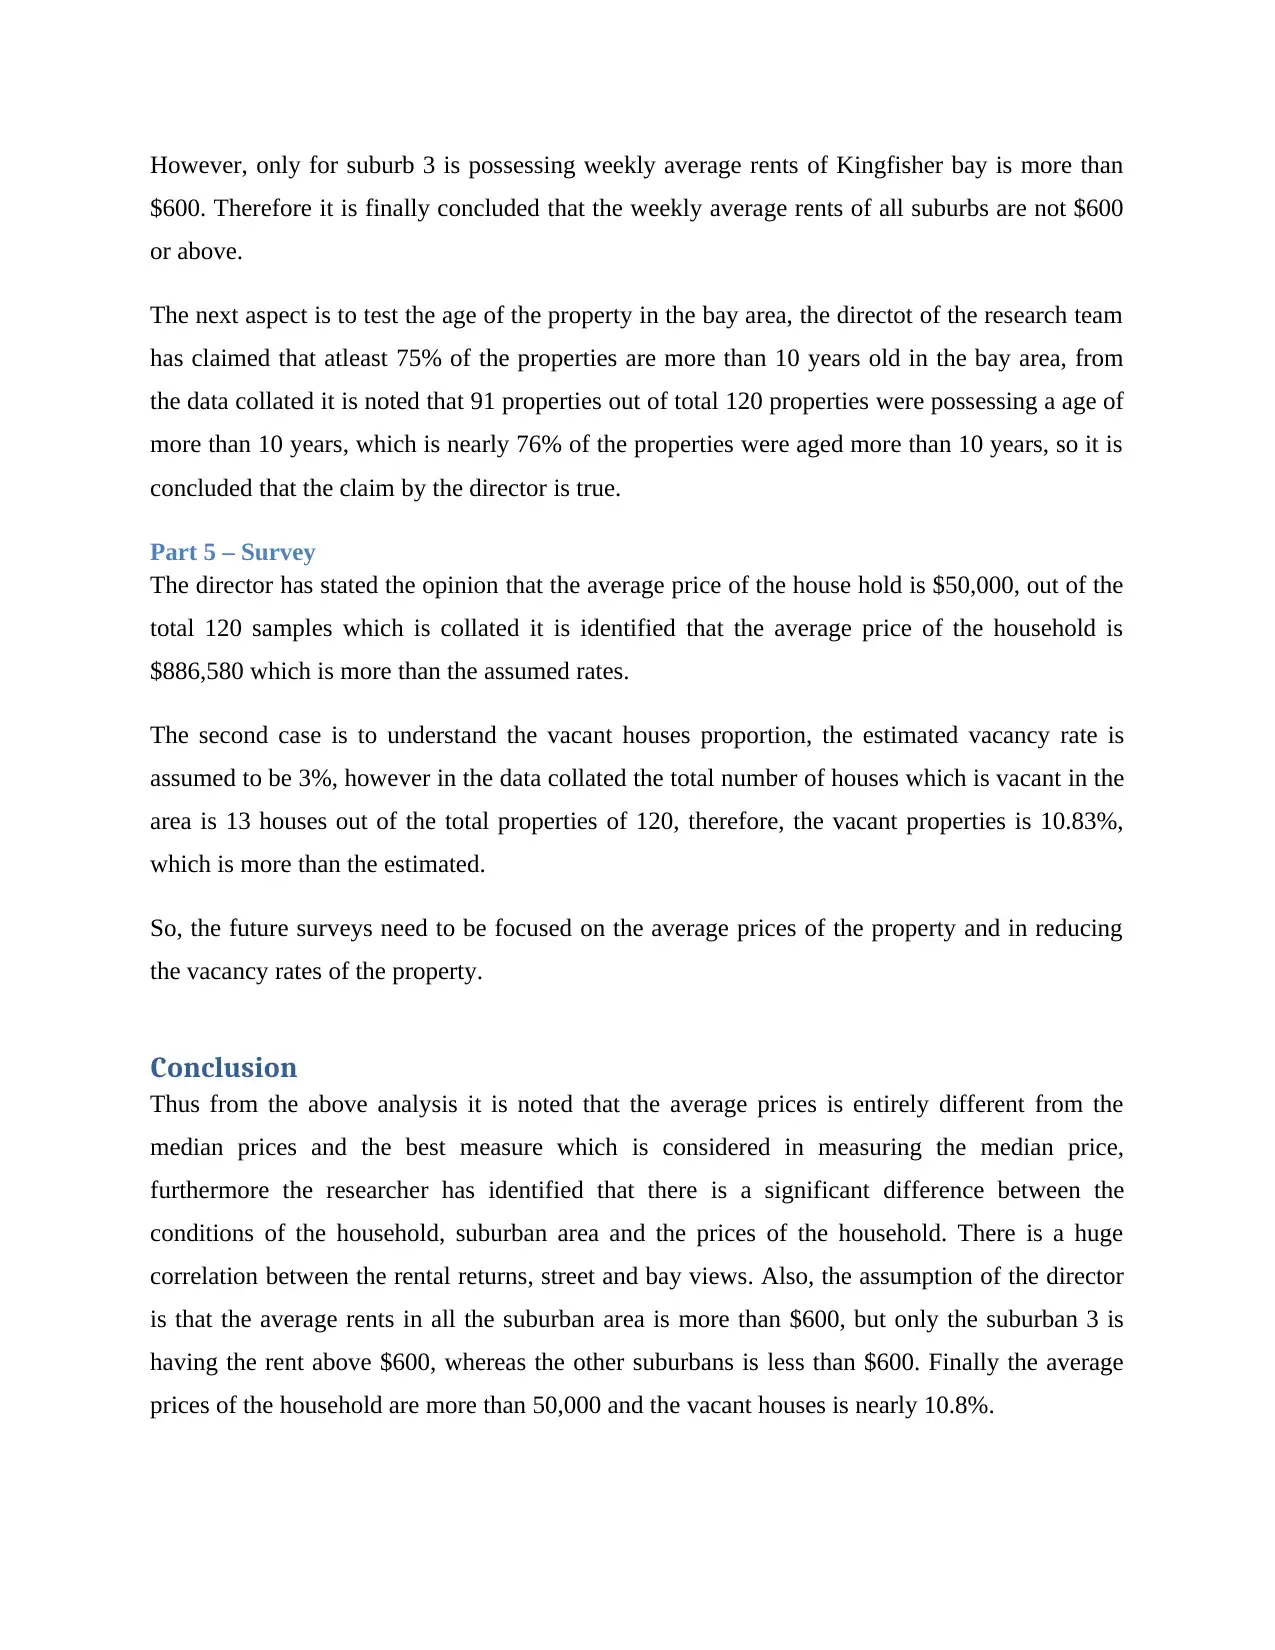
However, only for suburb 3 is possessing weekly average rents of Kingfisher bay is more than
$600. Therefore it is finally concluded that the weekly average rents of all suburbs are not $600
or above.
The next aspect is to test the age of the property in the bay area, the directot of the research team
has claimed that atleast 75% of the properties are more than 10 years old in the bay area, from
the data collated it is noted that 91 properties out of total 120 properties were possessing a age of
more than 10 years, which is nearly 76% of the properties were aged more than 10 years, so it is
concluded that the claim by the director is true.
Part 5 – Survey
The director has stated the opinion that the average price of the house hold is $50,000, out of the
total 120 samples which is collated it is identified that the average price of the household is
$886,580 which is more than the assumed rates.
The second case is to understand the vacant houses proportion, the estimated vacancy rate is
assumed to be 3%, however in the data collated the total number of houses which is vacant in the
area is 13 houses out of the total properties of 120, therefore, the vacant properties is 10.83%,
which is more than the estimated.
So, the future surveys need to be focused on the average prices of the property and in reducing
the vacancy rates of the property.
Conclusion
Thus from the above analysis it is noted that the average prices is entirely different from the
median prices and the best measure which is considered in measuring the median price,
furthermore the researcher has identified that there is a significant difference between the
conditions of the household, suburban area and the prices of the household. There is a huge
correlation between the rental returns, street and bay views. Also, the assumption of the director
is that the average rents in all the suburban area is more than $600, but only the suburban 3 is
having the rent above $600, whereas the other suburbans is less than $600. Finally the average
prices of the household are more than 50,000 and the vacant houses is nearly 10.8%.
⊘ This is a preview!⊘
Do you want full access?
Subscribe today to unlock all pages.
Trusted by 1+ million students worldwide
References
1. Freedman, David (2010). Statistics. 4th Edition. Cengage Publishing
2. Sarah Boslaugh (2012). Statistics in a Nutshell. Cengage Publishing
3. Sincich T. Terry (2012). Statistics. 12th Edition.
4. Witte S. Robert, (2010). Statistics. 5th Edition. McGraw Hill
5. Triola (2014). Essentials of Statistics. 5th Edition. McGraw Hill
1 out of 7
Related Documents


Your All-in-One AI-Powered Toolkit for Academic Success.
+13062052269
info@desklib.com
Available 24*7 on WhatsApp / Email
![[object Object]](/_next/static/media/star-bottom.7253800d.svg)
Unlock your academic potential
Copyright © 2020–2025 A2Z Services. All Rights Reserved. Developed and managed by ZUCOL.