Kingfisher PLC: Financial Performance and Competitor Analysis

Verified

Added on  2020/10/04

|16
|4484
|103
Report
AI Summary
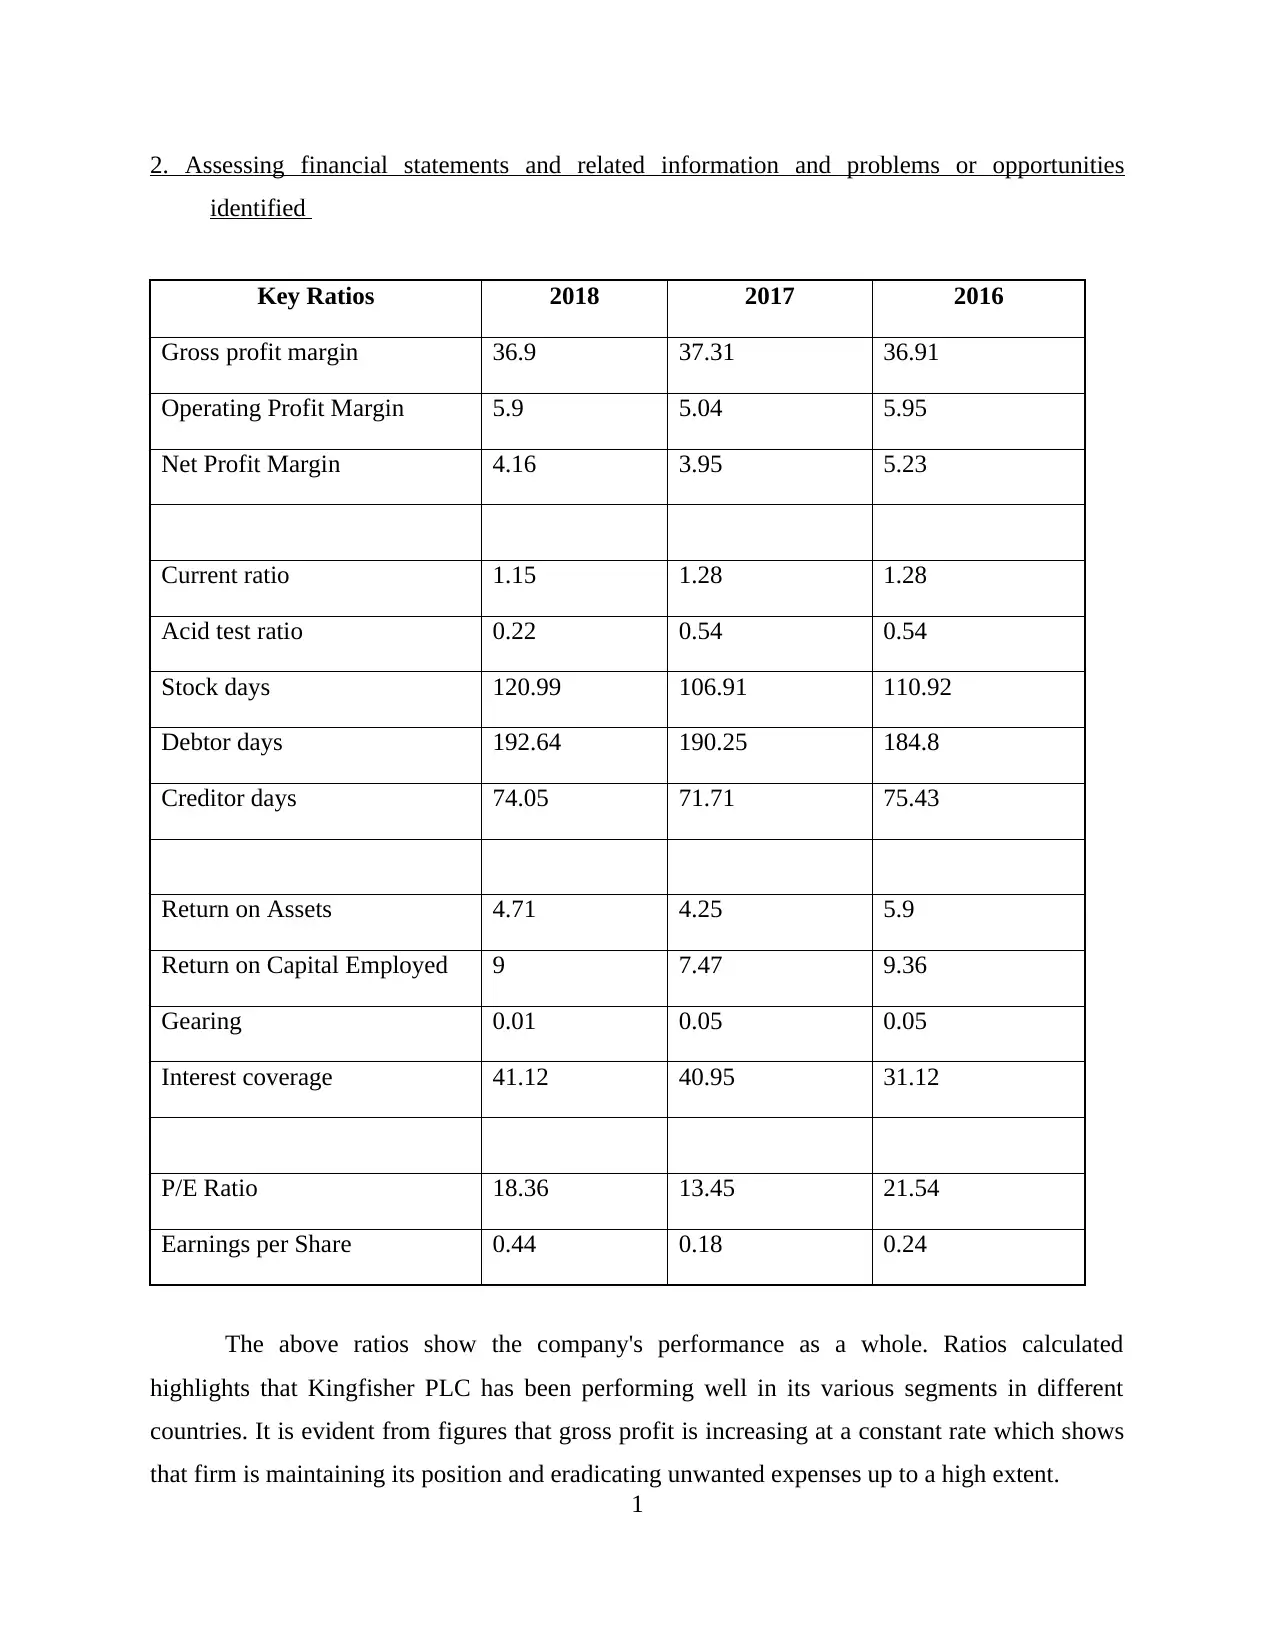
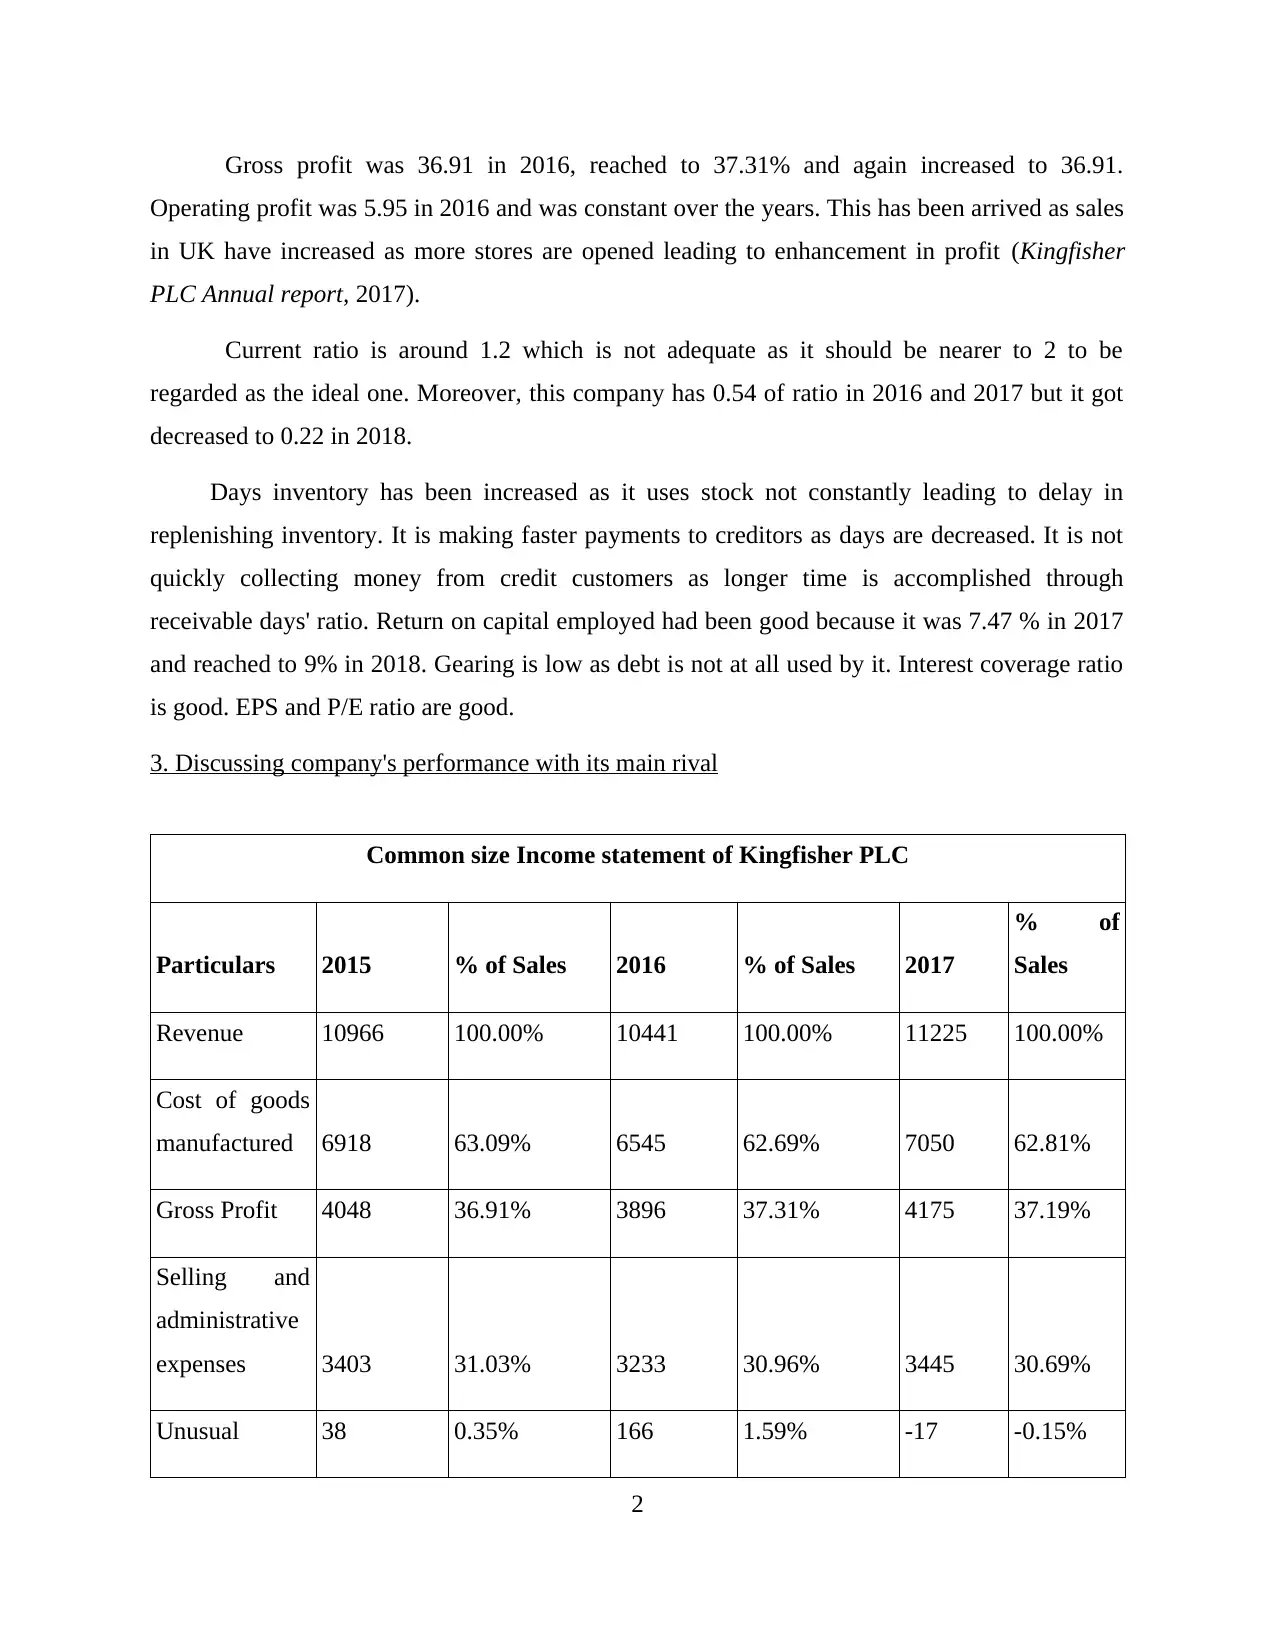
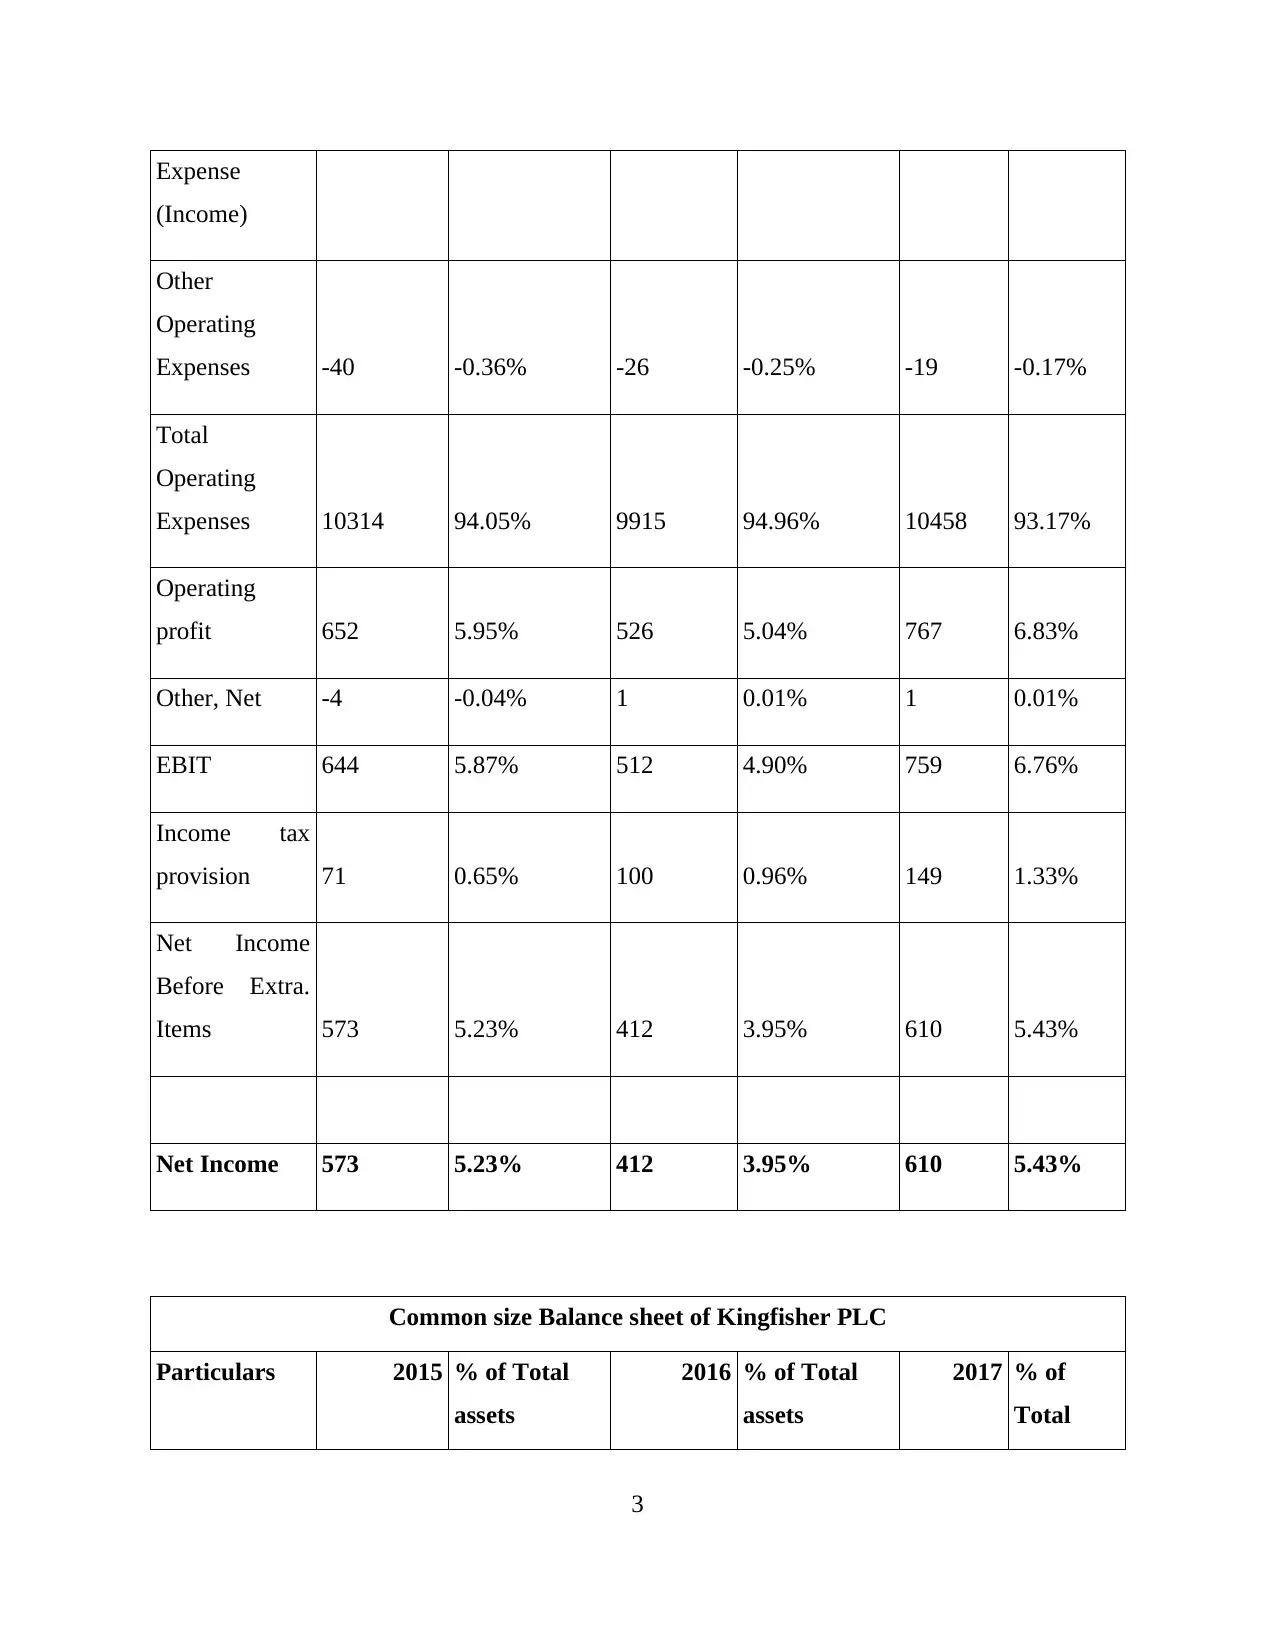
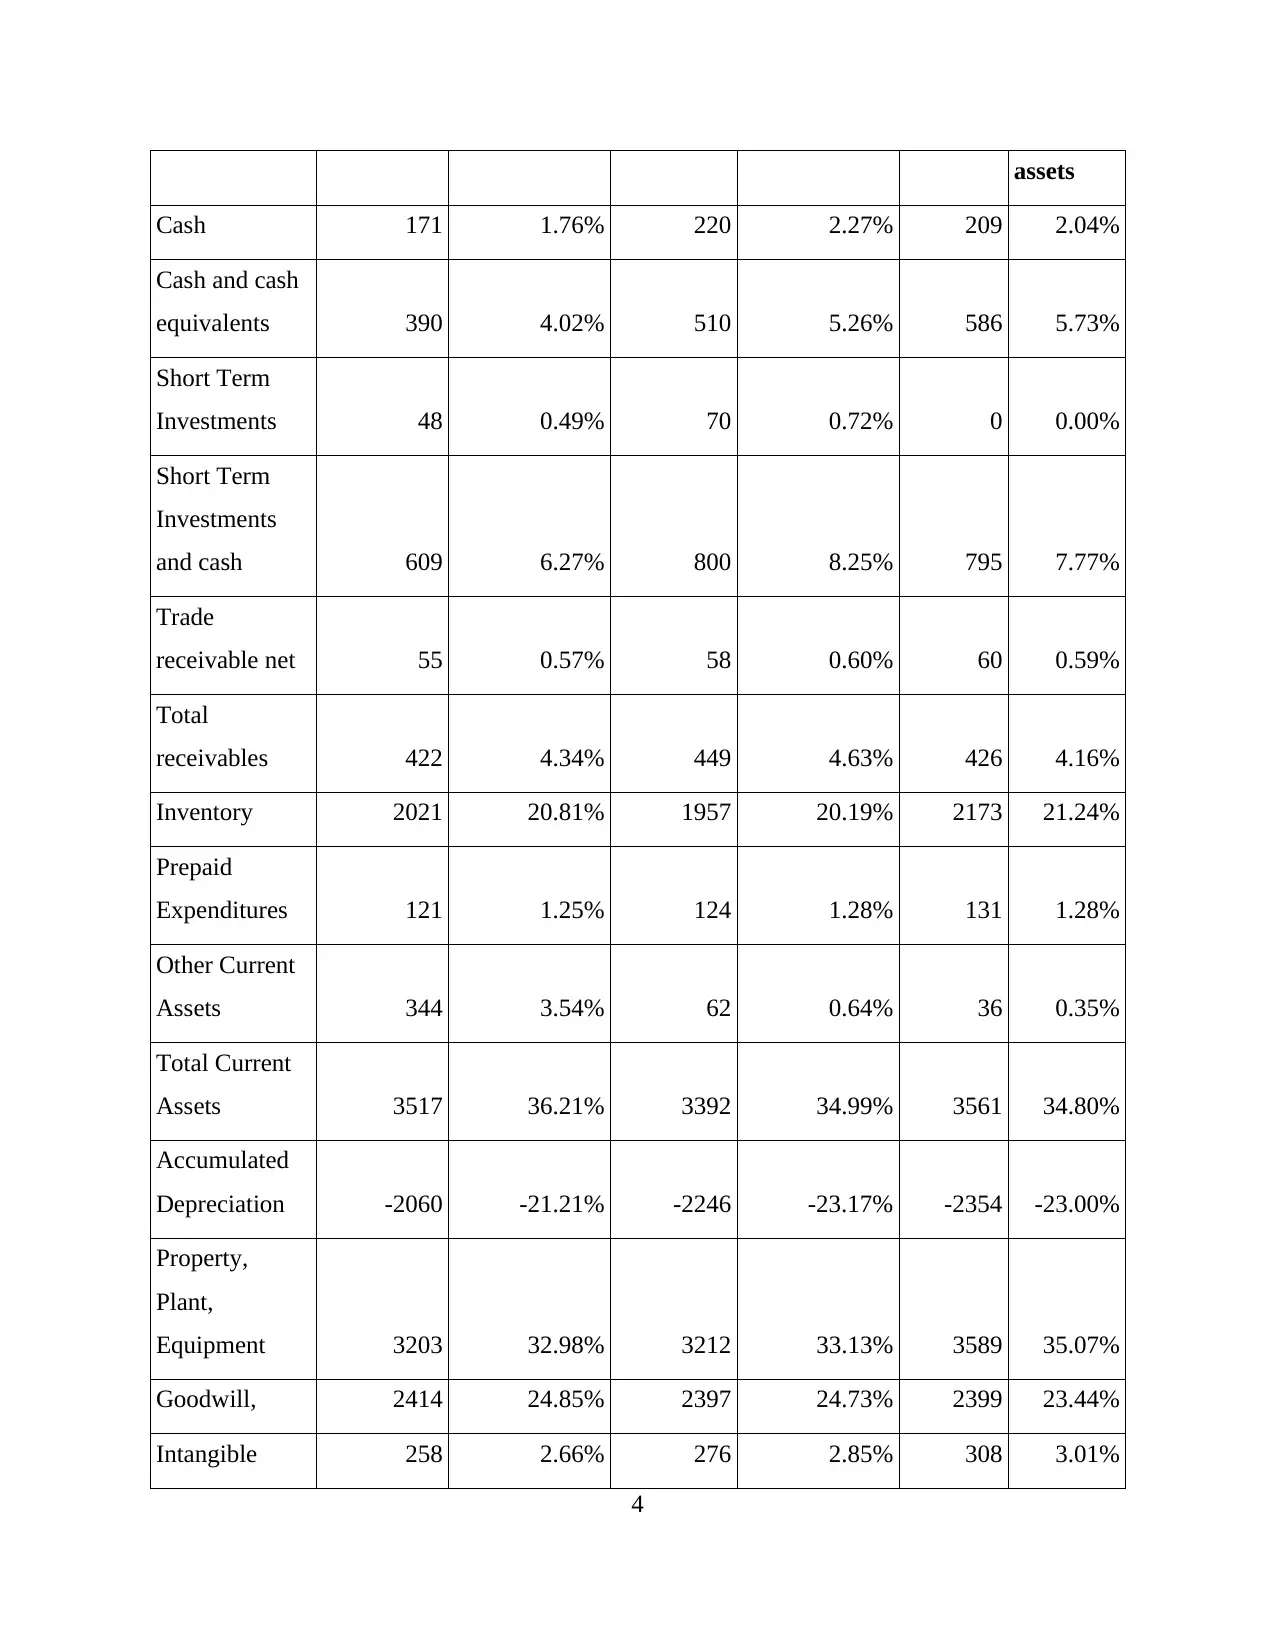
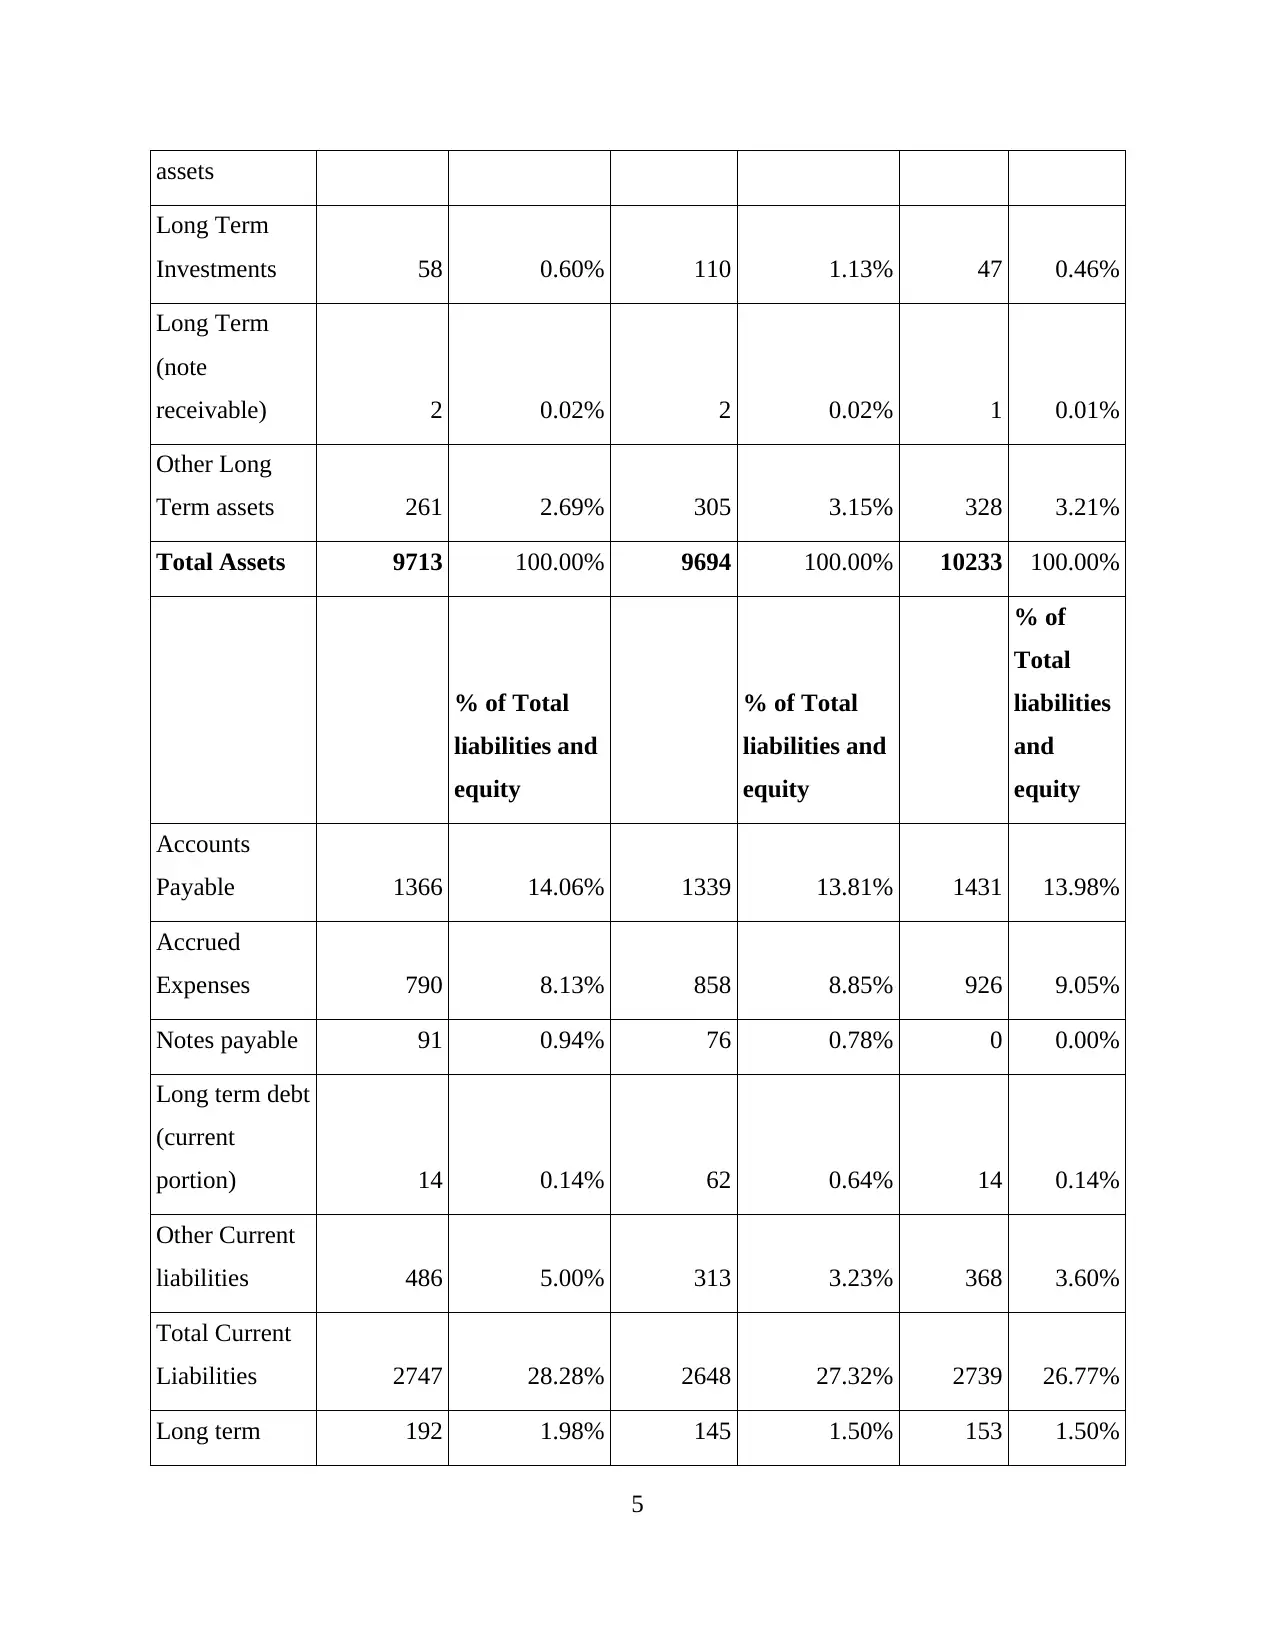
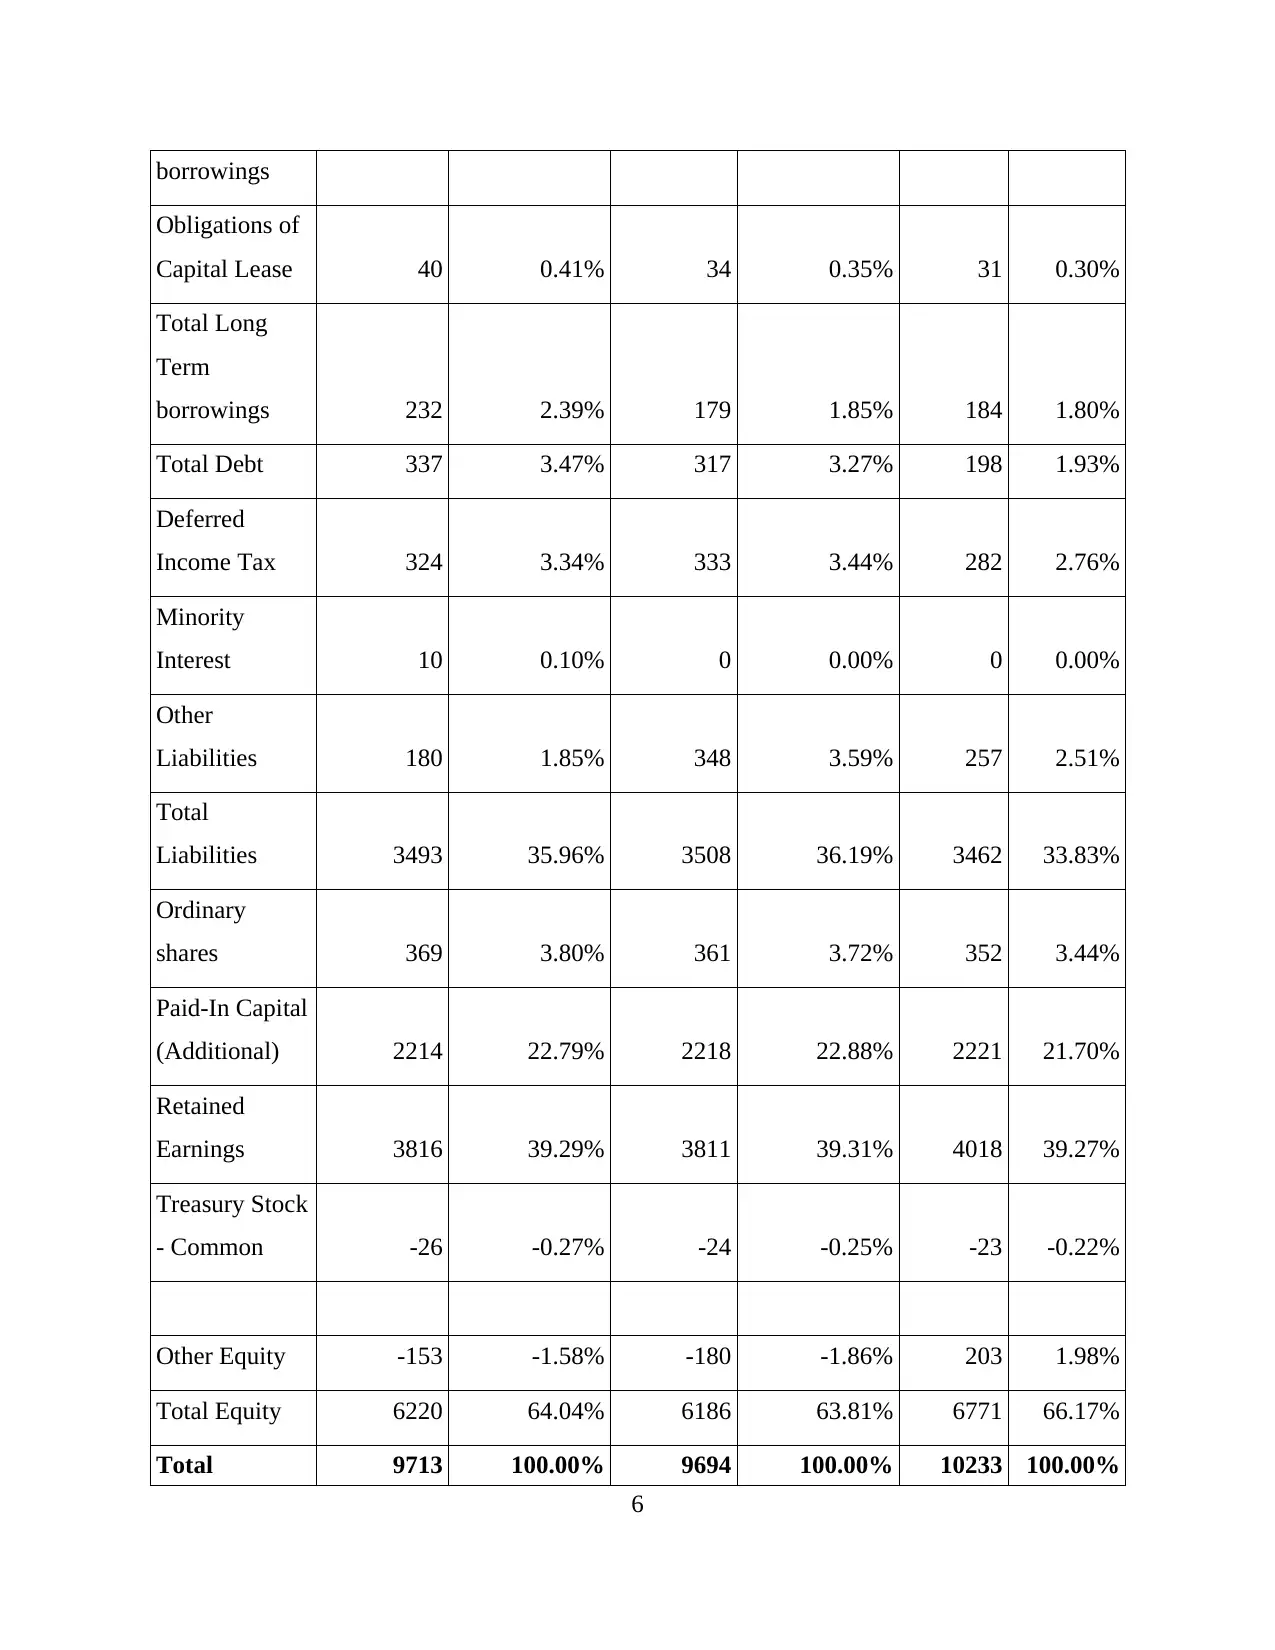
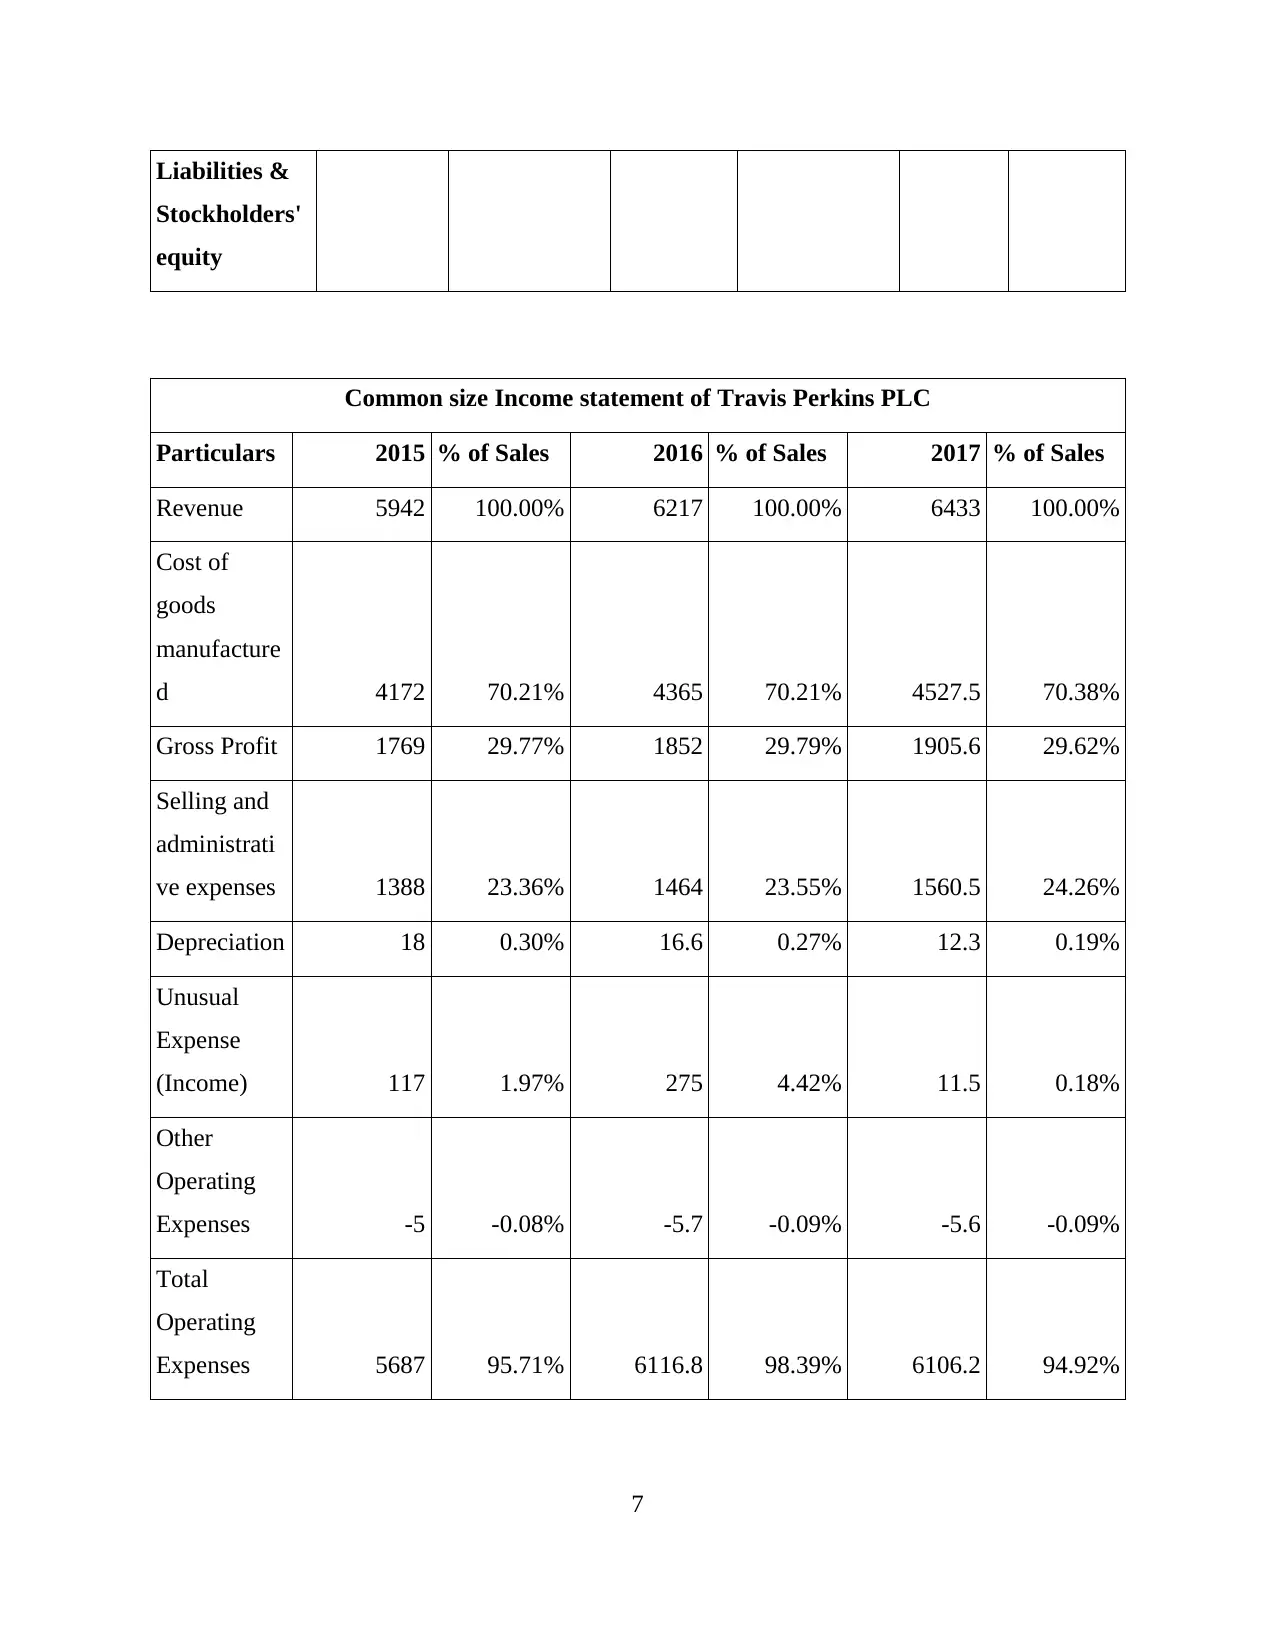
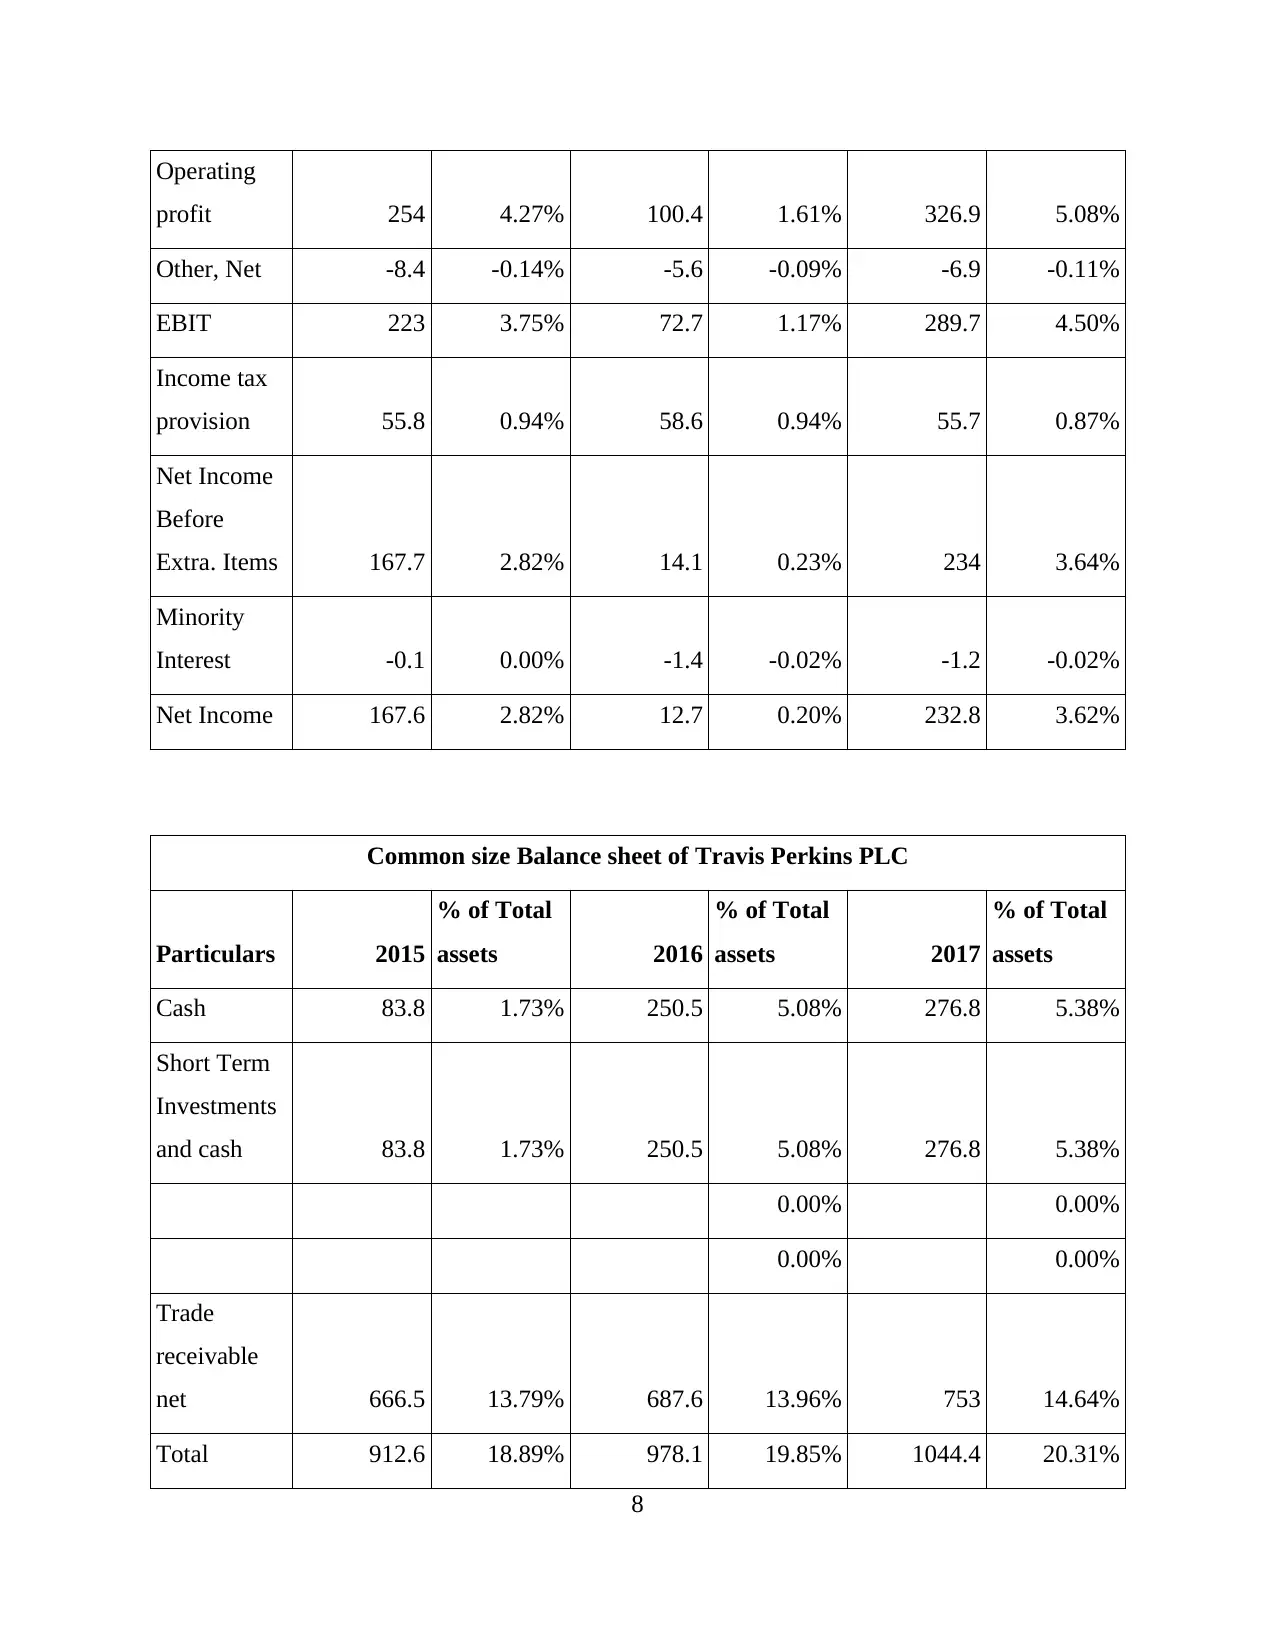
This report provides a detailed financial analysis of Kingfisher PLC, a major British multinational corporation in the retail sector. The analysis begins with an overview of the company's background, corporate objectives, and significant changes that occurred over the past three years, including store closures, openings, and strategic expansions. The report assesses Kingfisher's financial statements, examining key ratios such as gross profit margin, operating profit margin, and return on assets to identify strengths, weaknesses, opportunities, and threats. A comparison with its main competitor, Travis Perkins PLC, is conducted using common-size income statements and balance sheets to evaluate relative performance. The analysis highlights areas such as increasing gross profit, challenges related to rising manpower costs, and the impact of e-commerce growth. The report concludes by summarizing the financial performance, key findings, and their implications for Kingfisher PLC's strategic direction and future growth prospects. The report also identifies key opportunities and problems of both companies that have any similarities between them.
Document Page
KINGFISHER PLC
tabler-icon-diamond-filled.svg

Paraphrase This Document

Need a fresh take? Get an instant paraphrase of this document with our AI Paraphraser
Document Page
TABLE OF CONTENTS
INTRODUCTION...........................................................................................................................1
1. Company background by discussing corporate objectives and changes occurred in past
three years...............................................................................................................................1
2. Assessing financial statements and related information and problems or opportunities
identified ................................................................................................................................1
3. Discussing company's performance with its main rival.....................................................2
CONCLUSION..............................................................................................................................10
REFERENCES................................................................................................................................1
Document Page
INTRODUCTION
Expansion is one of the important elements for company in seeking to tap into new
markets. The present report deals with Kingfisher PLC headquartered at UK and engaged in the
retail sector. Its main competitors, Travis Perkins PLC will be also discussed with financial
statements and comparisons to be made with reference to financials of both organisations as
which one is performing well in the last three years.
Moreover, opportunities and problems of both companies are identified that have any
similarities between them. Conclusion will be made with reference to corporate objectives that
are formulated by Kingfisher PLC and also the report on the financial performance will be send
to Board of Directors to make a joint venture with listed firm.
1. Company background by discussing corporate objectives and changes occurred in past three
years
Kingfisher PLC is one of the largest British multinational corporations engaged in retail
industry. It is earning good quantum of profits in accordance to stated objectives. The corporate
objectives of company are to expand in every country by which it may be able to garner more
sales and equivalent profits in the best possible manner. This is particularly important as business
is operating in Poland, France, UK and Ireland in attaining profits from various segments quite
effectually.
The corporate objectives have significantly changed as business in 2015 closed 30 B&Q
stores which was divestiture. On the other hand, it had opened 42 new stores which is greater
change as observed leading to attain objectives. It made announcement for opening new
Screwfix stores in the UK of nearly 200. In the same year, 60 stores were shut down in UK and
Ireland. In relation to this, 70 % of stake were being sold to Wumei Holdings for whopping GBP
140 million (Kingfisher PLC, 2018).
Kingfisher PLC announced in 2017 to acquire Praktiker Romania which would double
the power in the best possible manner. Corporate expansion was taken place in February 2017 as
500th store under brand name of Screwfix which was opened in London. Apart from it,
distribution centre was opened in Poland leading to enhancement of profits of company quite
effectually. It has made corporate objectives of 2019 financial year, where B&Q distribution
centre in Swindon would be opened so as to streamline operations.
1
Document Page
The corporate strategy of Kingfisher PLC is to expand operations in different locations to
go ahead in retail sector. It has announced to minimise carbon footprint by effectively conversing
energy in shops. Its objective to meet much power for using and passing surplus if any back grid
would be successfully accomplished.
Key opportunities to Kingfisher PLC is to expand in retail stores in UK. It offers home
improvement products, bathroom commodities, decorating items, bedroom accessories which
clarifies that organisation has pretty presence in UK and as such, it can deploy more staff and
open up new shops in the country quite effectively. In a report furnished, retail sales would be
maximised in near future and would reach to GBP 52,669 million by the end of 2022. Figures are
there to show about company that has more avenues to come (Kingfisher PLC, 2018).
Another major opportunity is that e-commerce has been growing at a faster rate in UK.
Customers have become internet-oriented which has risen online sales quite phenomenally. Web
portals are becoming user-friendly to company and as such, revenue has also maximised.
Kingfisher PLC offers products on various websites such as diy.com, screwfix.com and
bricodepot.fr. It can be said that company would be effectively attaining new markets in the
future course of action.
Apart from opportunities, there are number of problems or issues associated with
organisation which might hinder its stated corporate objectives up to a major extent. Manpower
costs have been raised in the UK. This is particularly important for Kingfisher PLC as it has
more than 78000 employees in the country itself and will be impacted adversely if it does not
come down.
The government has increased wages on hourly basis, GBP 7.2 in 2016 to GBP 7.5 in next
year. Moreover, for all age groups, wages have been maximised that is affecting the company's
cost of operations. Competition is fierce for an organisation in retail industry, various giants
prevail which are a serious threat to firm in attaining desired profits and consecutively market
share. Wolseley PLC, Tesco PLC, Metro AG are the big names in sector. Hence, company has to
make well-structured strategies to outreach rivals.
2
tabler-icon-diamond-filled.svg

Paraphrase This Document

Need a fresh take? Get an instant paraphrase of this document with our AI Paraphraser
Document Page
2. Assessing financial statements and related information and problems or opportunities
identified
Key Ratios 2018 2017 2016
Gross profit margin 36.9 37.31 36.91
Operating Profit Margin 5.9 5.04 5.95
Net Profit Margin 4.16 3.95 5.23
Current ratio 1.15 1.28 1.28
Acid test ratio 0.22 0.54 0.54
Stock days 120.99 106.91 110.92
Debtor days 192.64 190.25 184.8
Creditor days 74.05 71.71 75.43
Return on Assets 4.71 4.25 5.9
Return on Capital Employed 9 7.47 9.36
Gearing 0.01 0.05 0.05
Interest coverage 41.12 40.95 31.12
P/E Ratio 18.36 13.45 21.54
Earnings per Share 0.44 0.18 0.24
The above ratios show the company's performance as a whole. Ratios calculated
highlights that Kingfisher PLC has been performing well in its various segments in different
countries. It is evident from figures that gross profit is increasing at a constant rate which shows
that firm is maintaining its position and eradicating unwanted expenses up to a high extent.
1
Document Page
Gross profit was 36.91 in 2016, reached to 37.31% and again increased to 36.91.
Operating profit was 5.95 in 2016 and was constant over the years. This has been arrived as sales
in UK have increased as more stores are opened leading to enhancement in profit (Kingfisher
PLC Annual report, 2017).
Current ratio is around 1.2 which is not adequate as it should be nearer to 2 to be
regarded as the ideal one. Moreover, this company has 0.54 of ratio in 2016 and 2017 but it got
decreased to 0.22 in 2018.
Days inventory has been increased as it uses stock not constantly leading to delay in
replenishing inventory. It is making faster payments to creditors as days are decreased. It is not
quickly collecting money from credit customers as longer time is accomplished through
receivable days' ratio. Return on capital employed had been good because it was 7.47 % in 2017
and reached to 9% in 2018. Gearing is low as debt is not at all used by it. Interest coverage ratio
is good. EPS and P/E ratio are good.
3. Discussing company's performance with its main rival
Common size Income statement of Kingfisher PLC
Particulars 2015 % of Sales 2016 % of Sales 2017
% of
Sales
Revenue 10966 100.00% 10441 100.00% 11225 100.00%
Cost of goods
manufactured 6918 63.09% 6545 62.69% 7050 62.81%
Gross Profit 4048 36.91% 3896 37.31% 4175 37.19%
Selling and
administrative
expenses 3403 31.03% 3233 30.96% 3445 30.69%
Unusual 38 0.35% 166 1.59% -17 -0.15%
2
Document Page
Expense
(Income)
Other
Operating
Expenses -40 -0.36% -26 -0.25% -19 -0.17%
Total
Operating
Expenses 10314 94.05% 9915 94.96% 10458 93.17%
Operating
profit 652 5.95% 526 5.04% 767 6.83%
Other, Net -4 -0.04% 1 0.01% 1 0.01%
EBIT 644 5.87% 512 4.90% 759 6.76%
Income tax
provision 71 0.65% 100 0.96% 149 1.33%
Net Income
Before Extra.
Items 573 5.23% 412 3.95% 610 5.43%
Net Income 573 5.23% 412 3.95% 610 5.43%
Common size Balance sheet of Kingfisher PLC
Particulars 2015 % of Total
assets
2016 % of Total
assets
2017 % of
Total
3
tabler-icon-diamond-filled.svg

Paraphrase This Document

Need a fresh take? Get an instant paraphrase of this document with our AI Paraphraser
Document Page
assets
Cash 171 1.76% 220 2.27% 209 2.04%
Cash and cash
equivalents 390 4.02% 510 5.26% 586 5.73%
Short Term
Investments 48 0.49% 70 0.72% 0 0.00%
Short Term
Investments
and cash 609 6.27% 800 8.25% 795 7.77%
Trade
receivable net 55 0.57% 58 0.60% 60 0.59%
Total
receivables 422 4.34% 449 4.63% 426 4.16%
Inventory 2021 20.81% 1957 20.19% 2173 21.24%
Prepaid
Expenditures 121 1.25% 124 1.28% 131 1.28%
Other Current
Assets 344 3.54% 62 0.64% 36 0.35%
Total Current
Assets 3517 36.21% 3392 34.99% 3561 34.80%
Accumulated
Depreciation -2060 -21.21% -2246 -23.17% -2354 -23.00%
Property,
Plant,
Equipment 3203 32.98% 3212 33.13% 3589 35.07%
Goodwill, 2414 24.85% 2397 24.73% 2399 23.44%
Intangible 258 2.66% 276 2.85% 308 3.01%
4
Document Page
assets
Long Term
Investments 58 0.60% 110 1.13% 47 0.46%
Long Term
(note
receivable) 2 0.02% 2 0.02% 1 0.01%
Other Long
Term assets 261 2.69% 305 3.15% 328 3.21%
Total Assets 9713 100.00% 9694 100.00% 10233 100.00%
% of Total
liabilities and
equity
% of Total
liabilities and
equity
% of
Total
liabilities
and
equity
Accounts
Payable 1366 14.06% 1339 13.81% 1431 13.98%
Accrued
Expenses 790 8.13% 858 8.85% 926 9.05%
Notes payable 91 0.94% 76 0.78% 0 0.00%
Long term debt
(current
portion) 14 0.14% 62 0.64% 14 0.14%
Other Current
liabilities 486 5.00% 313 3.23% 368 3.60%
Total Current
Liabilities 2747 28.28% 2648 27.32% 2739 26.77%
Long term 192 1.98% 145 1.50% 153 1.50%
5
Document Page
borrowings
Obligations of
Capital Lease 40 0.41% 34 0.35% 31 0.30%
Total Long
Term
borrowings 232 2.39% 179 1.85% 184 1.80%
Total Debt 337 3.47% 317 3.27% 198 1.93%
Deferred
Income Tax 324 3.34% 333 3.44% 282 2.76%
Minority
Interest 10 0.10% 0 0.00% 0 0.00%
Other
Liabilities 180 1.85% 348 3.59% 257 2.51%
Total
Liabilities 3493 35.96% 3508 36.19% 3462 33.83%
Ordinary
shares 369 3.80% 361 3.72% 352 3.44%
Paid-In Capital
(Additional) 2214 22.79% 2218 22.88% 2221 21.70%
Retained
Earnings 3816 39.29% 3811 39.31% 4018 39.27%
Treasury Stock
- Common -26 -0.27% -24 -0.25% -23 -0.22%
Other Equity -153 -1.58% -180 -1.86% 203 1.98%
Total Equity 6220 64.04% 6186 63.81% 6771 66.17%
Total 9713 100.00% 9694 100.00% 10233 100.00%
6
tabler-icon-diamond-filled.svg

Paraphrase This Document

Need a fresh take? Get an instant paraphrase of this document with our AI Paraphraser
Document Page
Liabilities &
Stockholders'
equity
Common size Income statement of Travis Perkins PLC
Particulars 2015 % of Sales 2016 % of Sales 2017 % of Sales
Revenue 5942 100.00% 6217 100.00% 6433 100.00%
Cost of
goods
manufacture
d 4172 70.21% 4365 70.21% 4527.5 70.38%
Gross Profit 1769 29.77% 1852 29.79% 1905.6 29.62%
Selling and
administrati
ve expenses 1388 23.36% 1464 23.55% 1560.5 24.26%
Depreciation 18 0.30% 16.6 0.27% 12.3 0.19%
Unusual
Expense
(Income) 117 1.97% 275 4.42% 11.5 0.18%
Other
Operating
Expenses -5 -0.08% -5.7 -0.09% -5.6 -0.09%
Total
Operating
Expenses 5687 95.71% 6116.8 98.39% 6106.2 94.92%
7
Document Page
Operating
profit 254 4.27% 100.4 1.61% 326.9 5.08%
Other, Net -8.4 -0.14% -5.6 -0.09% -6.9 -0.11%
EBIT 223 3.75% 72.7 1.17% 289.7 4.50%
Income tax
provision 55.8 0.94% 58.6 0.94% 55.7 0.87%
Net Income
Before
Extra. Items 167.7 2.82% 14.1 0.23% 234 3.64%
Minority
Interest -0.1 0.00% -1.4 -0.02% -1.2 -0.02%
Net Income 167.6 2.82% 12.7 0.20% 232.8 3.62%
Common size Balance sheet of Travis Perkins PLC
Particulars 2015
% of Total
assets 2016
% of Total
assets 2017
% of Total
assets
Cash 83.8 1.73% 250.5 5.08% 276.8 5.38%
Short Term
Investments
and cash 83.8 1.73% 250.5 5.08% 276.8 5.38%
0.00% 0.00%
0.00% 0.00%
Trade
receivable
net 666.5 13.79% 687.6 13.96% 753 14.64%
Total 912.6 18.89% 978.1 19.85% 1044.4 20.31%
8
chevron_up_icon
1 out of 16
circle_padding
hide_on_mobile
zoom_out_icon
[object Object]