Kingfisher Plc Financial Statement Analysis and Performance Evaluation
VerifiedAdded on 2020/10/23
|22
|5469
|194
Report
AI Summary
This report presents a financial analysis of Kingfisher Plc, a major retail company operating in the UK, and compares its performance with its competitor Ferguson Plc. The analysis includes an introduction to financial accounting and its importance for organizations. The report then provides background information on Kingfisher Plc, detailing its business operations, products, and financial performance. It uses horizontal analysis to examine trends in the income statement and balance sheet over a three-year period (2015-2017) and provides an interpretation of the changes in revenue, cost of goods, gross profit, and other expenses. The report also includes a common size analysis of the income statement and balance sheet, which helps to evaluate the financial performance of Kingfisher Plc. The report also includes a financial analysis of Ferguson PLC. Finally, the report analyzes the overall performance of the company and discusses its strengths and weaknesses in comparison to its competitors.

COMPANY’S ANALYSIS
Paraphrase This Document
Need a fresh take? Get an instant paraphrase of this document with our AI Paraphraser
TABLE OF CONTENTS
INTRODUCTION...........................................................................................................................1
HORIZONTAL ANALYSIS...........................................................................................................2
VERTICAL ANALYSIS...............................................................................................................10
RATIO ANALYSIS.......................................................................................................................16
CONCLUSION..............................................................................................................................19
REFERENCES..............................................................................................................................20
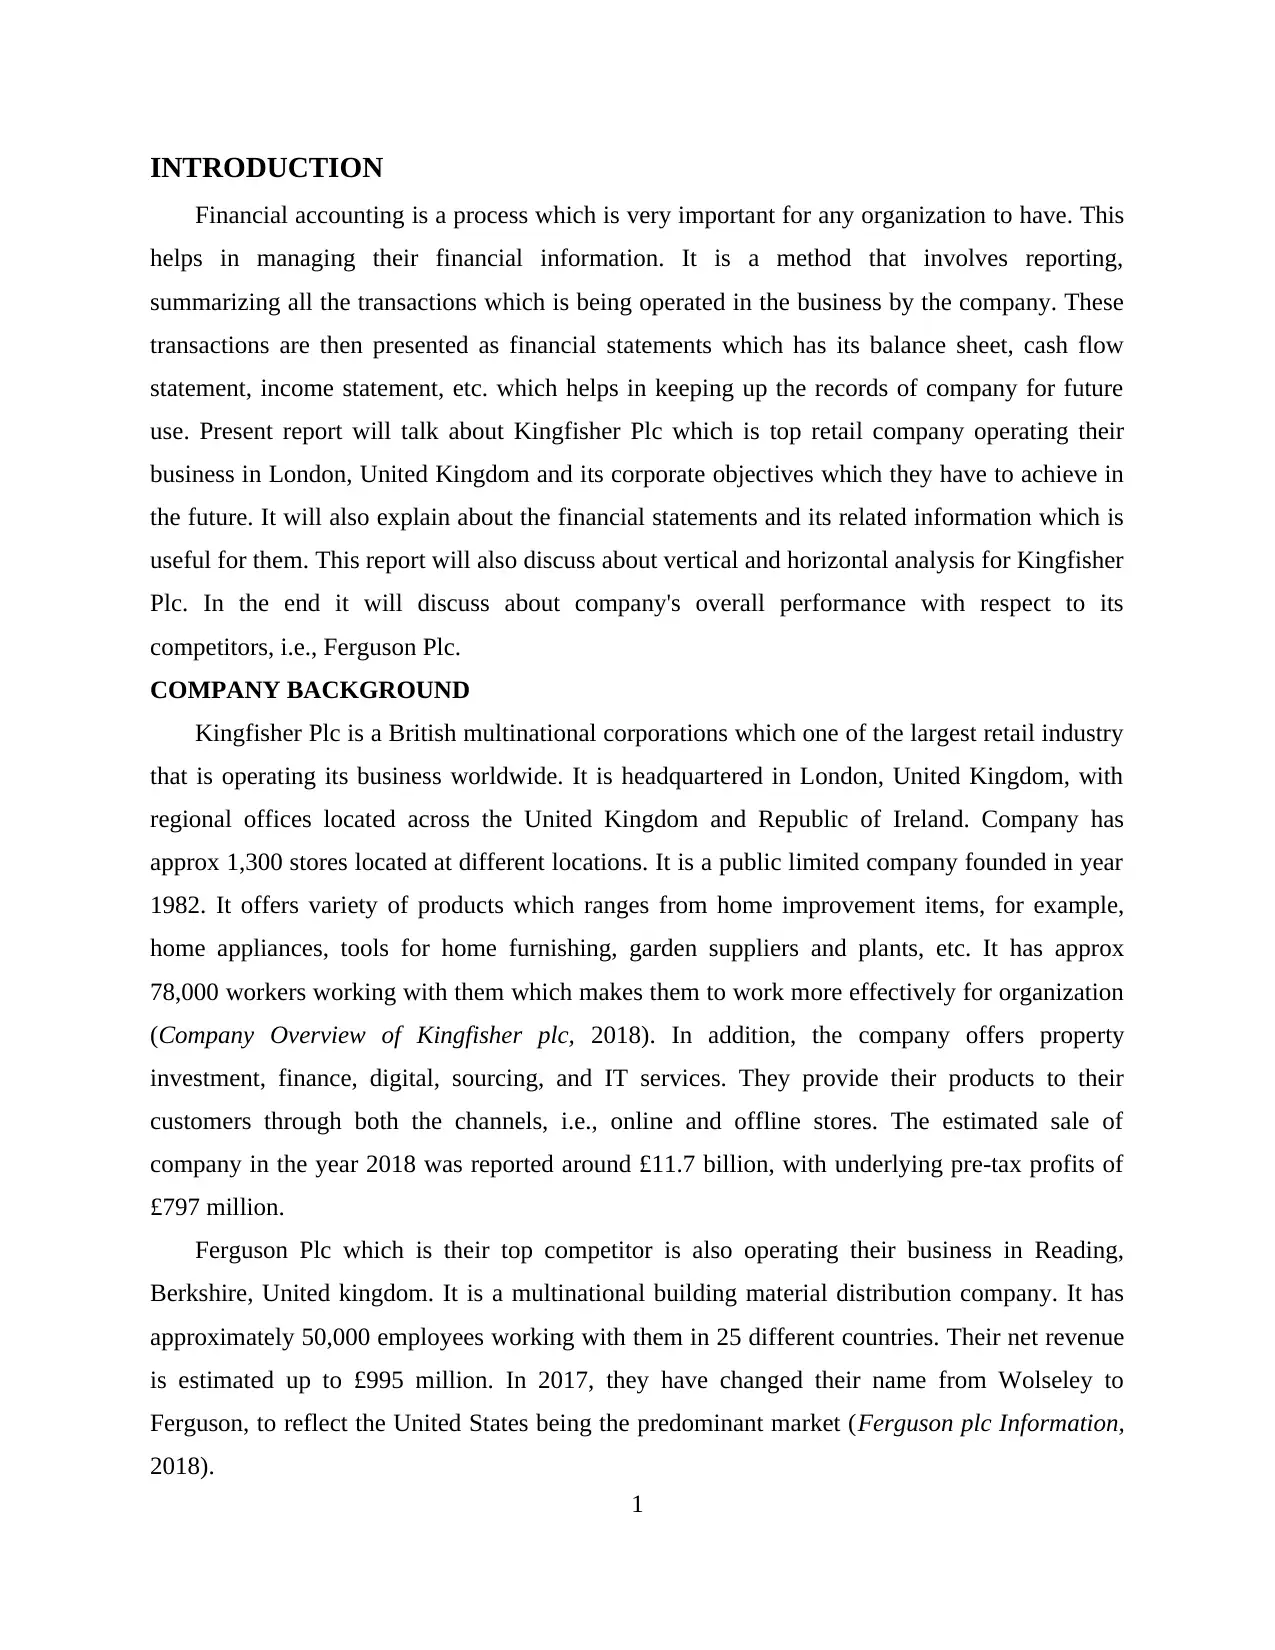
INTRODUCTION
Financial accounting is a process which is very important for any organization to have. This
helps in managing their financial information. It is a method that involves reporting,
summarizing all the transactions which is being operated in the business by the company. These
transactions are then presented as financial statements which has its balance sheet, cash flow
statement, income statement, etc. which helps in keeping up the records of company for future
use. Present report will talk about Kingfisher Plc which is top retail company operating their
business in London, United Kingdom and its corporate objectives which they have to achieve in
the future. It will also explain about the financial statements and its related information which is
useful for them. This report will also discuss about vertical and horizontal analysis for Kingfisher
Plc. In the end it will discuss about company's overall performance with respect to its
competitors, i.e., Ferguson Plc.
COMPANY BACKGROUND
Kingfisher Plc is a British multinational corporations which one of the largest retail industry
that is operating its business worldwide. It is headquartered in London, United Kingdom, with
regional offices located across the United Kingdom and Republic of Ireland. Company has
approx 1,300 stores located at different locations. It is a public limited company founded in year
1982. It offers variety of products which ranges from home improvement items, for example,
home appliances, tools for home furnishing, garden suppliers and plants, etc. It has approx
78,000 workers working with them which makes them to work more effectively for organization
(Company Overview of Kingfisher plc, 2018). In addition, the company offers property
investment, finance, digital, sourcing, and IT services. They provide their products to their
customers through both the channels, i.e., online and offline stores. The estimated sale of
company in the year 2018 was reported around £11.7 billion, with underlying pre-tax profits of
£797 million.
Ferguson Plc which is their top competitor is also operating their business in Reading,
Berkshire, United kingdom. It is a multinational building material distribution company. It has
approximately 50,000 employees working with them in 25 different countries. Their net revenue
is estimated up to £995 million. In 2017, they have changed their name from Wolseley to
Ferguson, to reflect the United States being the predominant market (Ferguson plc Information,
2018).
1
⊘ This is a preview!⊘
Do you want full access?
Subscribe today to unlock all pages.
Trusted by 1+ million students worldwide
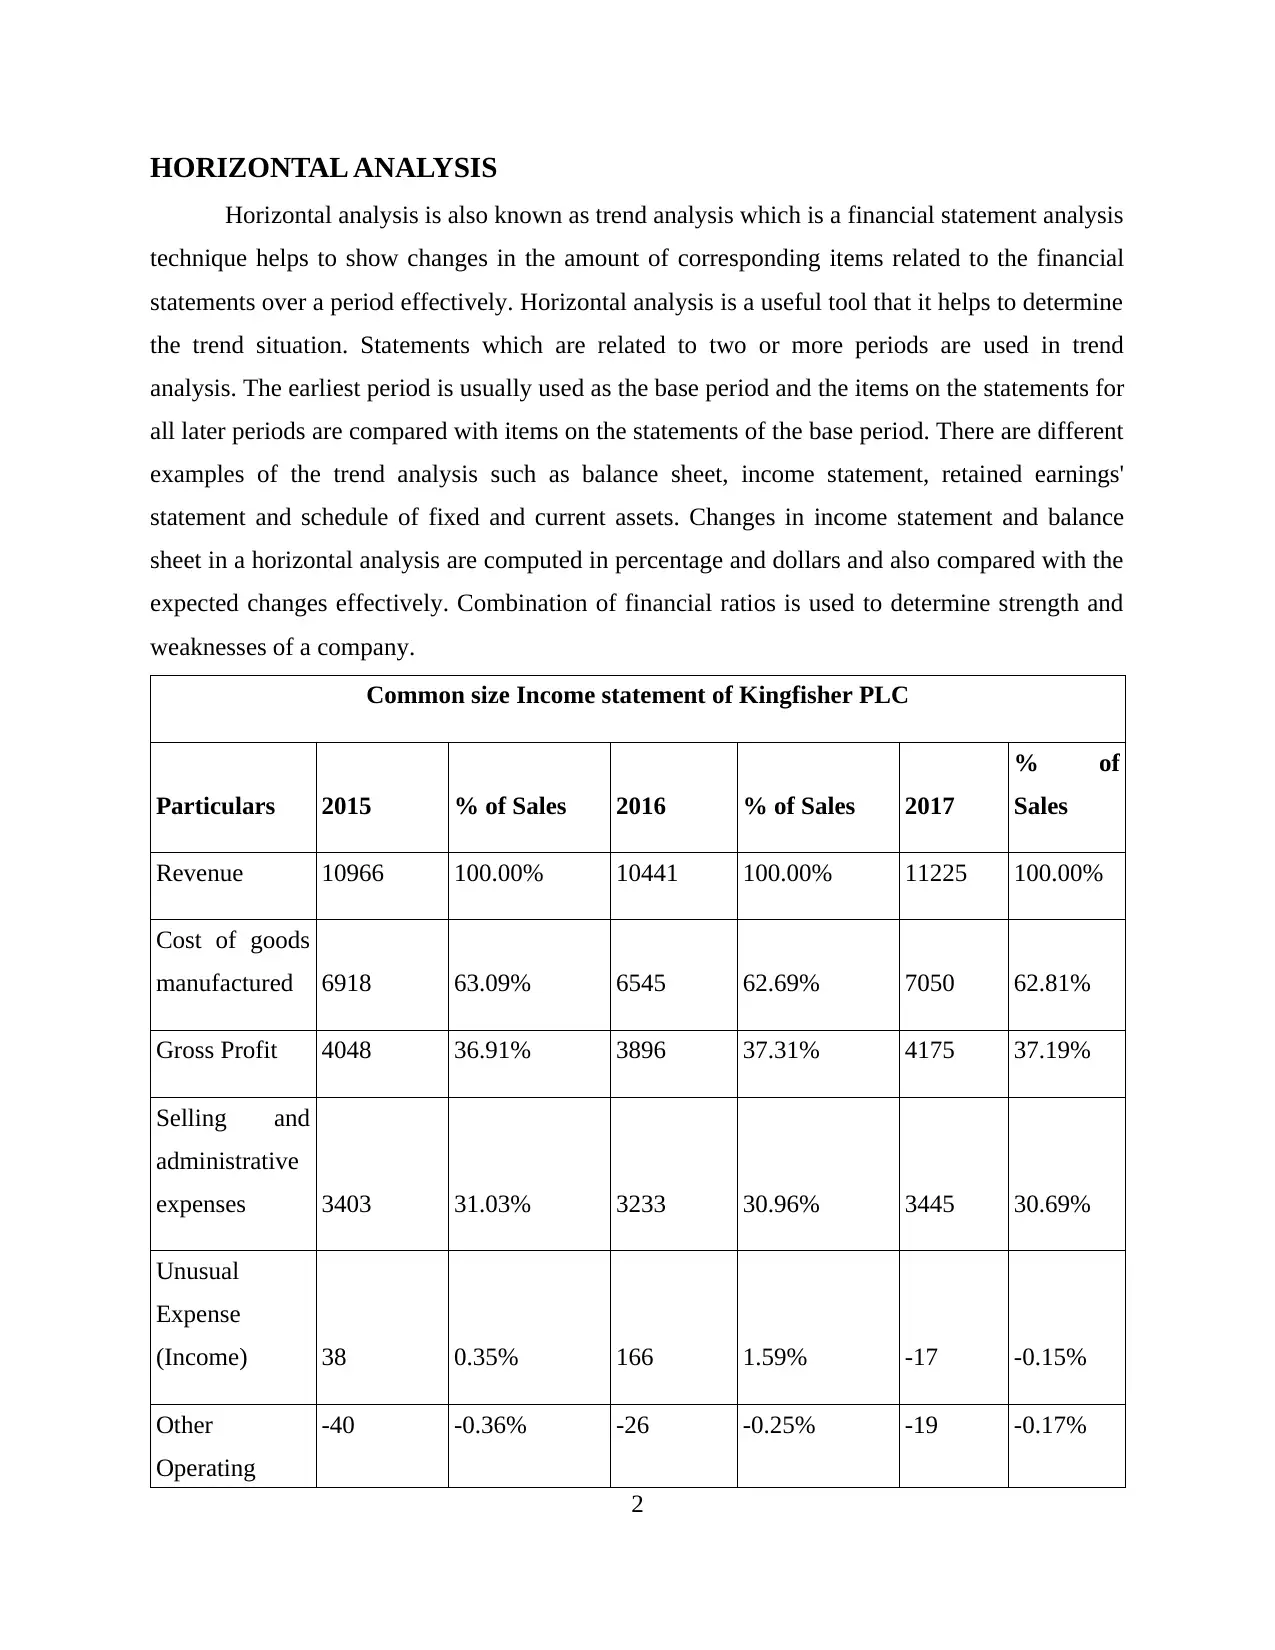
HORIZONTAL ANALYSIS
Horizontal analysis is also known as trend analysis which is a financial statement analysis
technique helps to show changes in the amount of corresponding items related to the financial
statements over a period effectively. Horizontal analysis is a useful tool that it helps to determine
the trend situation. Statements which are related to two or more periods are used in trend
analysis. The earliest period is usually used as the base period and the items on the statements for
all later periods are compared with items on the statements of the base period. There are different
examples of the trend analysis such as balance sheet, income statement, retained earnings'
statement and schedule of fixed and current assets. Changes in income statement and balance
sheet in a horizontal analysis are computed in percentage and dollars and also compared with the
expected changes effectively. Combination of financial ratios is used to determine strength and
weaknesses of a company.
Common size Income statement of Kingfisher PLC
Particulars 2015 % of Sales 2016 % of Sales 2017
% of
Sales
Revenue 10966 100.00% 10441 100.00% 11225 100.00%
Cost of goods
manufactured 6918 63.09% 6545 62.69% 7050 62.81%
Gross Profit 4048 36.91% 3896 37.31% 4175 37.19%
Selling and
administrative
expenses 3403 31.03% 3233 30.96% 3445 30.69%
Unusual
Expense
(Income) 38 0.35% 166 1.59% -17 -0.15%
Other
Operating
-40 -0.36% -26 -0.25% -19 -0.17%
2
Paraphrase This Document
Need a fresh take? Get an instant paraphrase of this document with our AI Paraphraser
Expenses
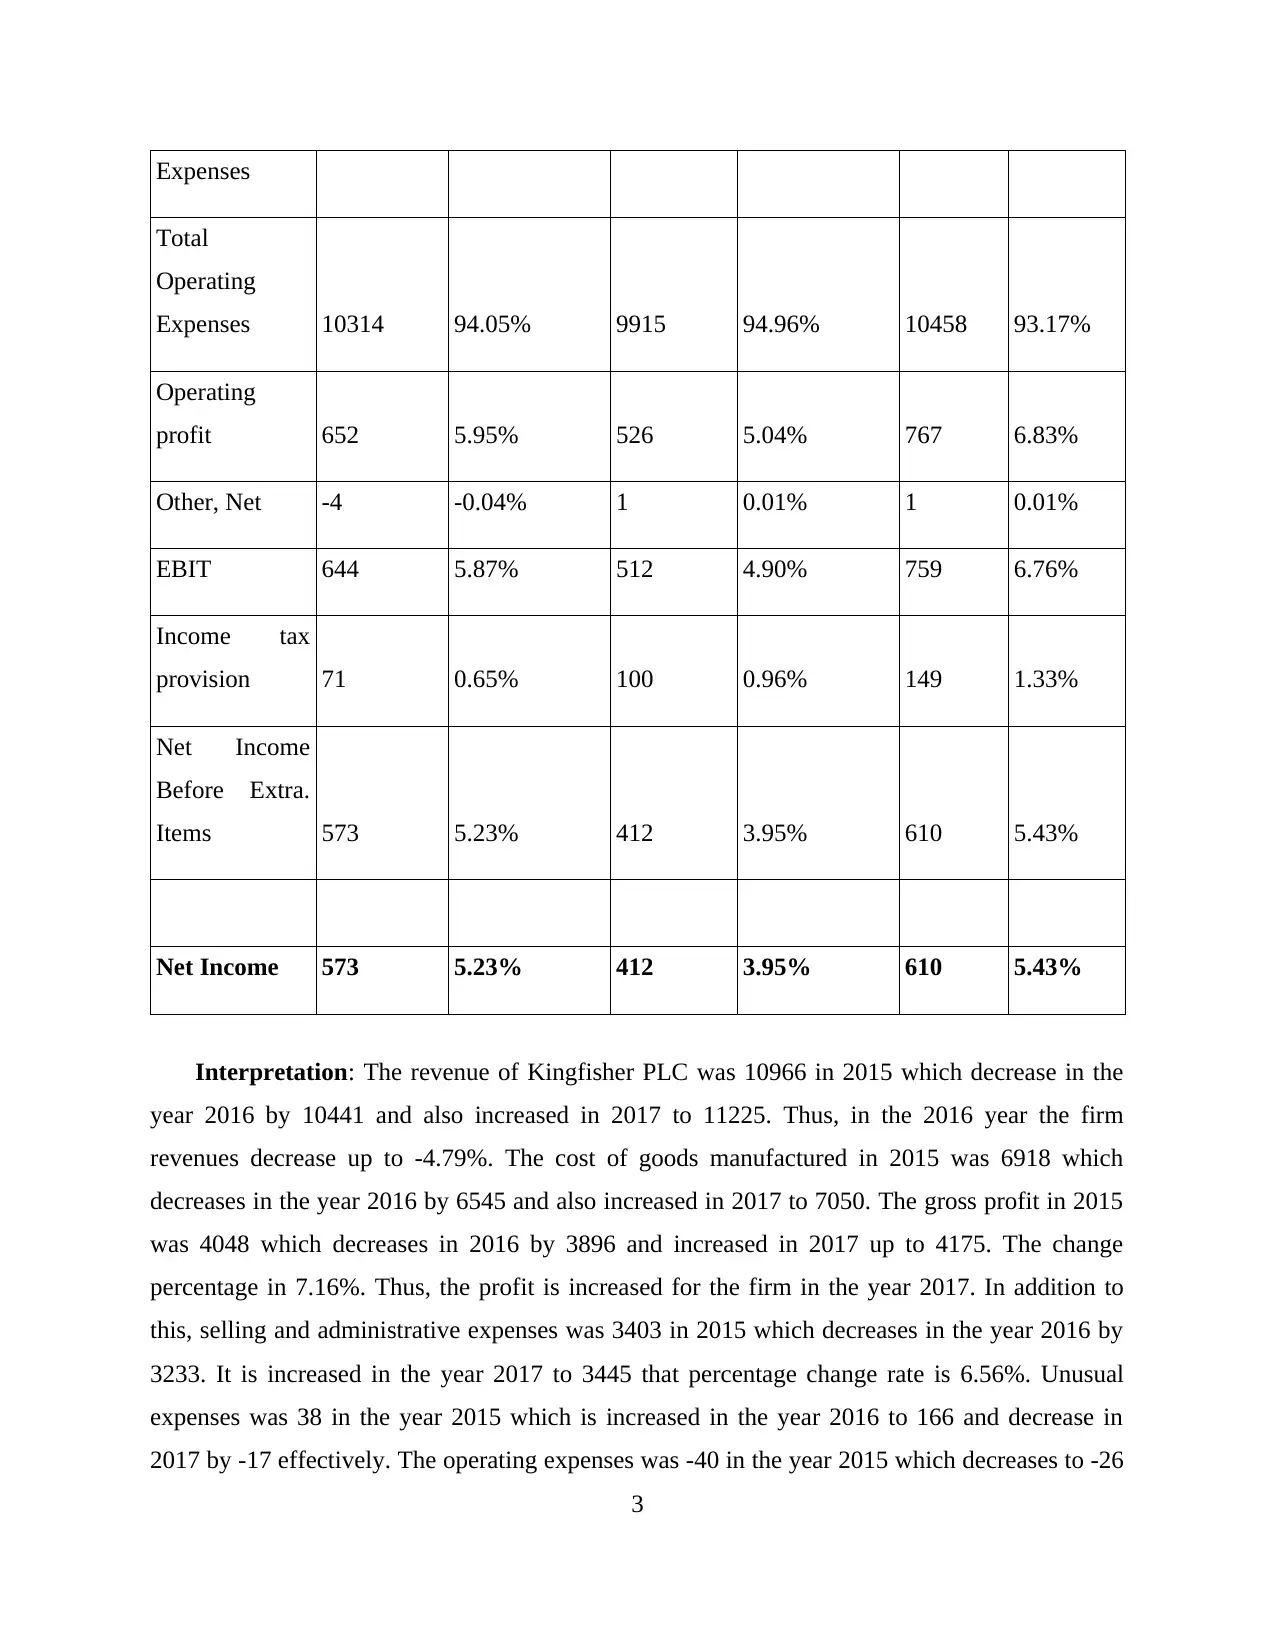
Total
Operating
Expenses 10314 94.05% 9915 94.96% 10458 93.17%
Operating
profit 652 5.95% 526 5.04% 767 6.83%
Other, Net -4 -0.04% 1 0.01% 1 0.01%
EBIT 644 5.87% 512 4.90% 759 6.76%
Income tax
provision 71 0.65% 100 0.96% 149 1.33%
Net Income
Before Extra.
Items 573 5.23% 412 3.95% 610 5.43%
Net Income 573 5.23% 412 3.95% 610 5.43%
Interpretation: The revenue of Kingfisher PLC was 10966 in 2015 which decrease in the
year 2016 by 10441 and also increased in 2017 to 11225. Thus, in the 2016 year the firm
revenues decrease up to -4.79%. The cost of goods manufactured in 2015 was 6918 which
decreases in the year 2016 by 6545 and also increased in 2017 to 7050. The gross profit in 2015
was 4048 which decreases in 2016 by 3896 and increased in 2017 up to 4175. The change
percentage in 7.16%. Thus, the profit is increased for the firm in the year 2017. In addition to
this, selling and administrative expenses was 3403 in 2015 which decreases in the year 2016 by
3233. It is increased in the year 2017 to 3445 that percentage change rate is 6.56%. Unusual
expenses was 38 in the year 2015 which is increased in the year 2016 to 166 and decrease in
2017 by -17 effectively. The operating expenses was -40 in the year 2015 which decreases to -26
3
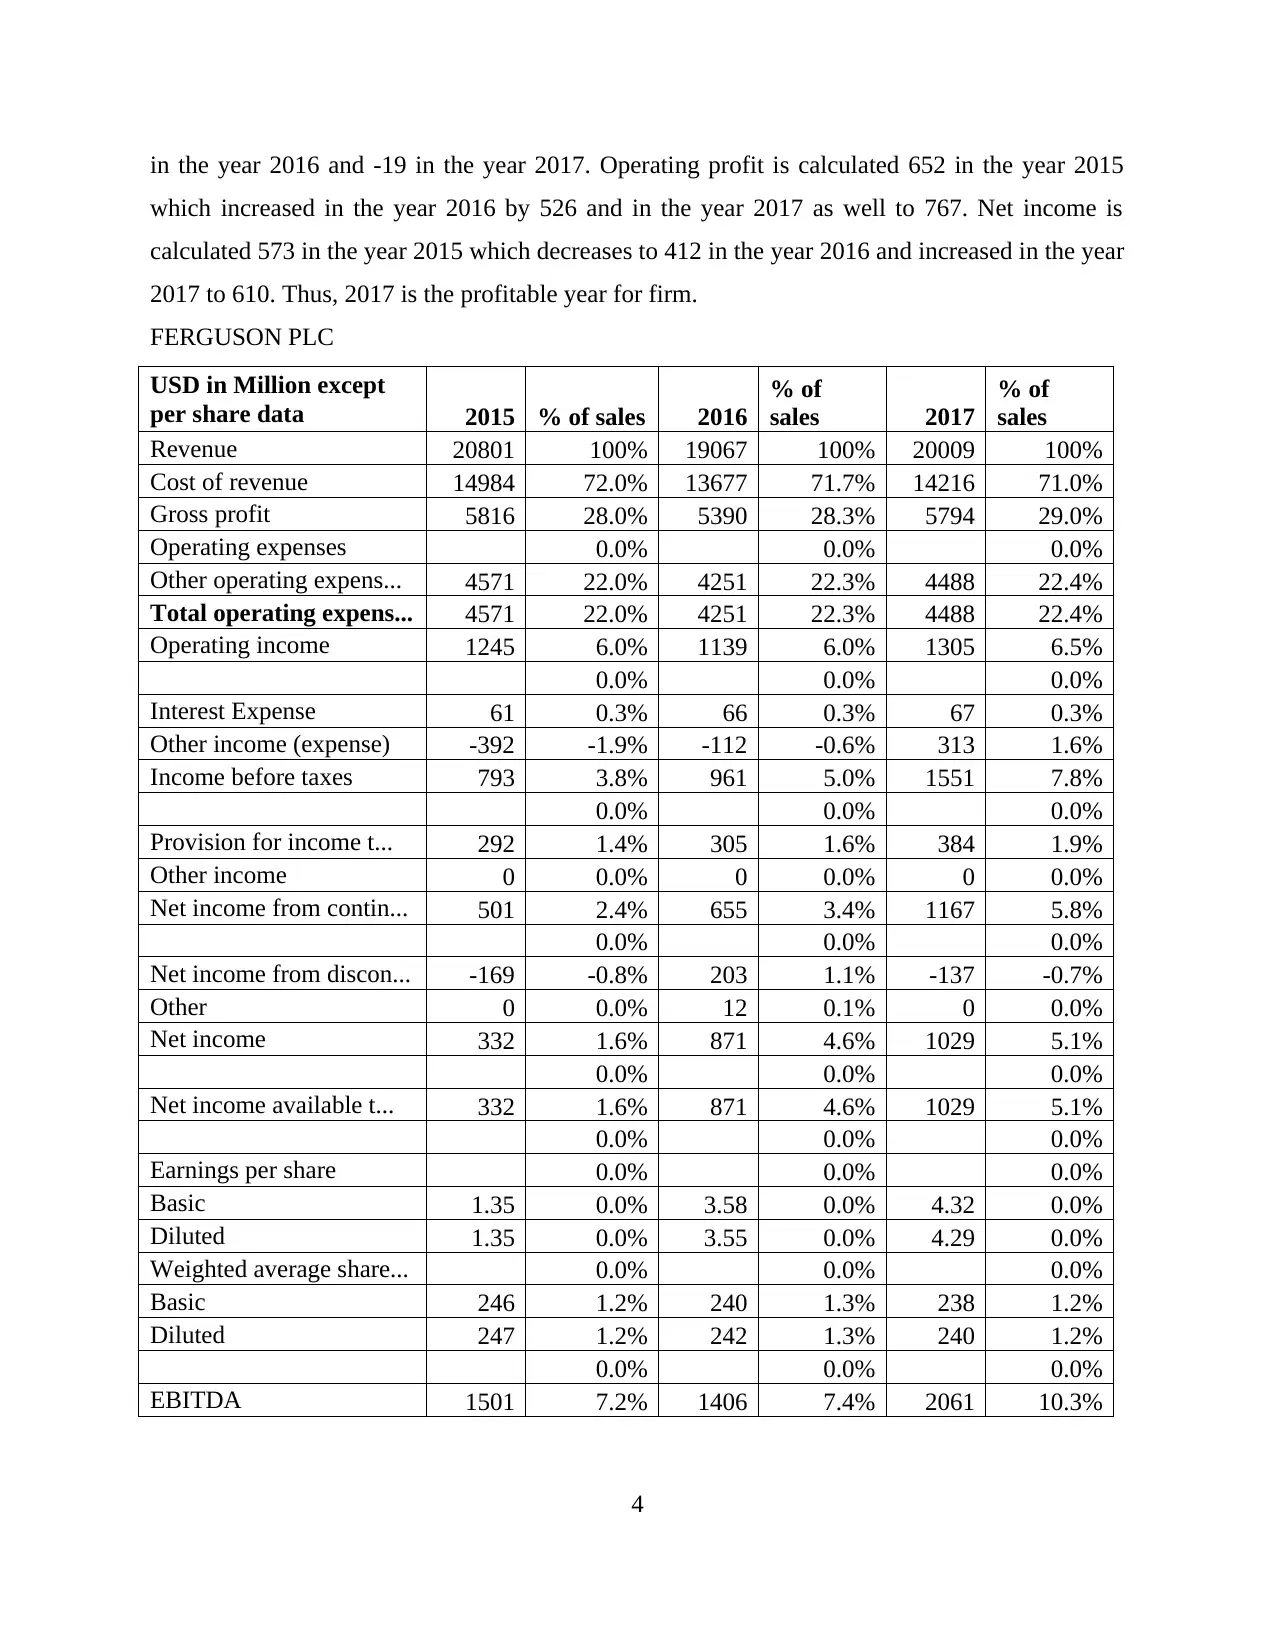
in the year 2016 and -19 in the year 2017. Operating profit is calculated 652 in the year 2015
which increased in the year 2016 by 526 and in the year 2017 as well to 767. Net income is
calculated 573 in the year 2015 which decreases to 412 in the year 2016 and increased in the year
2017 to 610. Thus, 2017 is the profitable year for firm.
FERGUSON PLC
USD in Million except
per share data 2015 % of sales 2016
% of
sales 2017
% of
sales
Revenue 20801 100% 19067 100% 20009 100%
Cost of revenue 14984 72.0% 13677 71.7% 14216 71.0%
Gross profit 5816 28.0% 5390 28.3% 5794 29.0%
Operating expenses 0.0% 0.0% 0.0%
Other operating expens... 4571 22.0% 4251 22.3% 4488 22.4%
Total operating expens... 4571 22.0% 4251 22.3% 4488 22.4%
Operating income 1245 6.0% 1139 6.0% 1305 6.5%
0.0% 0.0% 0.0%
Interest Expense 61 0.3% 66 0.3% 67 0.3%
Other income (expense) -392 -1.9% -112 -0.6% 313 1.6%
Income before taxes 793 3.8% 961 5.0% 1551 7.8%
0.0% 0.0% 0.0%
Provision for income t... 292 1.4% 305 1.6% 384 1.9%
Other income 0 0.0% 0 0.0% 0 0.0%
Net income from contin... 501 2.4% 655 3.4% 1167 5.8%
0.0% 0.0% 0.0%
Net income from discon... -169 -0.8% 203 1.1% -137 -0.7%
Other 0 0.0% 12 0.1% 0 0.0%
Net income 332 1.6% 871 4.6% 1029 5.1%
0.0% 0.0% 0.0%
Net income available t... 332 1.6% 871 4.6% 1029 5.1%
0.0% 0.0% 0.0%
Earnings per share 0.0% 0.0% 0.0%
Basic 1.35 0.0% 3.58 0.0% 4.32 0.0%
Diluted 1.35 0.0% 3.55 0.0% 4.29 0.0%
Weighted average share... 0.0% 0.0% 0.0%
Basic 246 1.2% 240 1.3% 238 1.2%
Diluted 247 1.2% 242 1.3% 240 1.2%
0.0% 0.0% 0.0%
EBITDA 1501 7.2% 1406 7.4% 2061 10.3%
4
⊘ This is a preview!⊘
Do you want full access?
Subscribe today to unlock all pages.
Trusted by 1+ million students worldwide
Interpretation: Company has seen remarkable changes by looking at its revenue and
other expenditures. In 2017, its revenue was 20009 M due to decrease in some operating
expenses which was 4488 M in 2017. Thus, statistical data illustrates that, change in its total
operating expenses were 5.58% and its faced a gross profit of 7.50% which was USD 5794 M in
2017. This is a positive sign for the company because its fiscal expenses decreased and it became
quite strong from financial point of view. This financial benefit helped it to take another major
steps like it took a competitive edge in the market and its customers also got benefited by the the
low pricing on products and services. Its net income in 2017 was 18.14% which can be
considered as major change for other employees because its expenses like interest expense,
provision for income tax, operating income tac expense were decreased. Thus, the company got a
high relief in its expenditures at each and every stage. In 2017, it focussed on its expenses to
increase its income so that it can maintain its position and sustain in market.
Common size Balance sheet of Kingfisher PLC
Particulars 2015
% of Total
assets 2016
% of Total
assets 2017
% of
Total
assets
Cash 171 1.76% 220 2.27% 209 2.04%
Cash and cash
equivalents 390 4.02% 510 5.26% 586 5.73%
Short Term
Investments 48 0.49% 70 0.72% 0 0.00%
Short Term
Investments
and cash 609 6.27% 800 8.25% 795 7.77%
Trade
receivable net 55 0.57% 58 0.60% 60 0.59%
5
Paraphrase This Document
Need a fresh take? Get an instant paraphrase of this document with our AI Paraphraser
Total
receivables 422 4.34% 449 4.63% 426 4.16%
Inventory 2021 20.81% 1957 20.19% 2173 21.24%
Prepaid
Expenditures 121 1.25% 124 1.28% 131 1.28%
Other Current
Assets 344 3.54% 62 0.64% 36 0.35%
Total Current
Assets 3517 36.21% 3392 34.99% 3561 34.80%
Accumulated
Depreciation -2060 -21.21% -2246 -23.17% -2354 -23.00%
Property,
Plant,
Equipment 3203 32.98% 3212 33.13% 3589 35.07%
Goodwill, 2414 24.85% 2397 24.73% 2399 23.44%
Intangible
assets 258 2.66% 276 2.85% 308 3.01%
Long Term
Investments 58 0.60% 110 1.13% 47 0.46%
Long Term
(note
receivable) 2 0.02% 2 0.02% 1 0.01%
Other Long
Term assets 261 2.69% 305 3.15% 328 3.21%
Total Assets 9713 100.00% 9694 100.00% 10233 100.00%
% of Total
liabilities and
% of Total
liabilities and
% of
Total
6
equity equity
liabilities
and
equity
Accounts
Payable 1366 14.06% 1339 13.81% 1431 13.98%
Accrued
Expenses 790 8.13% 858 8.85% 926 9.05%
Notes payable 91 0.94% 76 0.78% 0 0.00%
Long term debt
(current
portion) 14 0.14% 62 0.64% 14 0.14%
Other Current
liabilities 486 5.00% 313 3.23% 368 3.60%
Total Current
Liabilities 2747 28.28% 2648 27.32% 2739 26.77%
Long term
borrowings 192 1.98% 145 1.50% 153 1.50%
Obligations of
Capital Lease 40 0.41% 34 0.35% 31 0.30%
Total Long
Term
borrowings 232 2.39% 179 1.85% 184 1.80%
Total Debt 337 3.47% 317 3.27% 198 1.93%
Deferred
Income Tax 324 3.34% 333 3.44% 282 2.76%
Minority
Interest 10 0.10% 0 0.00% 0 0.00%
7
⊘ This is a preview!⊘
Do you want full access?
Subscribe today to unlock all pages.
Trusted by 1+ million students worldwide
Other
Liabilities 180 1.85% 348 3.59% 257 2.51%
Total
Liabilities 3493 35.96% 3508 36.19% 3462 33.83%
Ordinary
shares 369 3.80% 361 3.72% 352 3.44%
Paid-In Capital
(Additional) 2214 22.79% 2218 22.88% 2221 21.70%
Retained
Earnings 3816 39.29% 3811 39.31% 4018 39.27%
Treasury Stock
- Common -26 -0.27% -24 -0.25% -23 -0.22%
Other Equity -153 -1.58% -180 -1.86% 203 1.98%
Total Equity 6220 64.04% 6186 63.81% 6771 66.17%
Total
Liabilities &
Stockholders'
equity 9713 100.00% 9694 100.00% 10233 100.00%
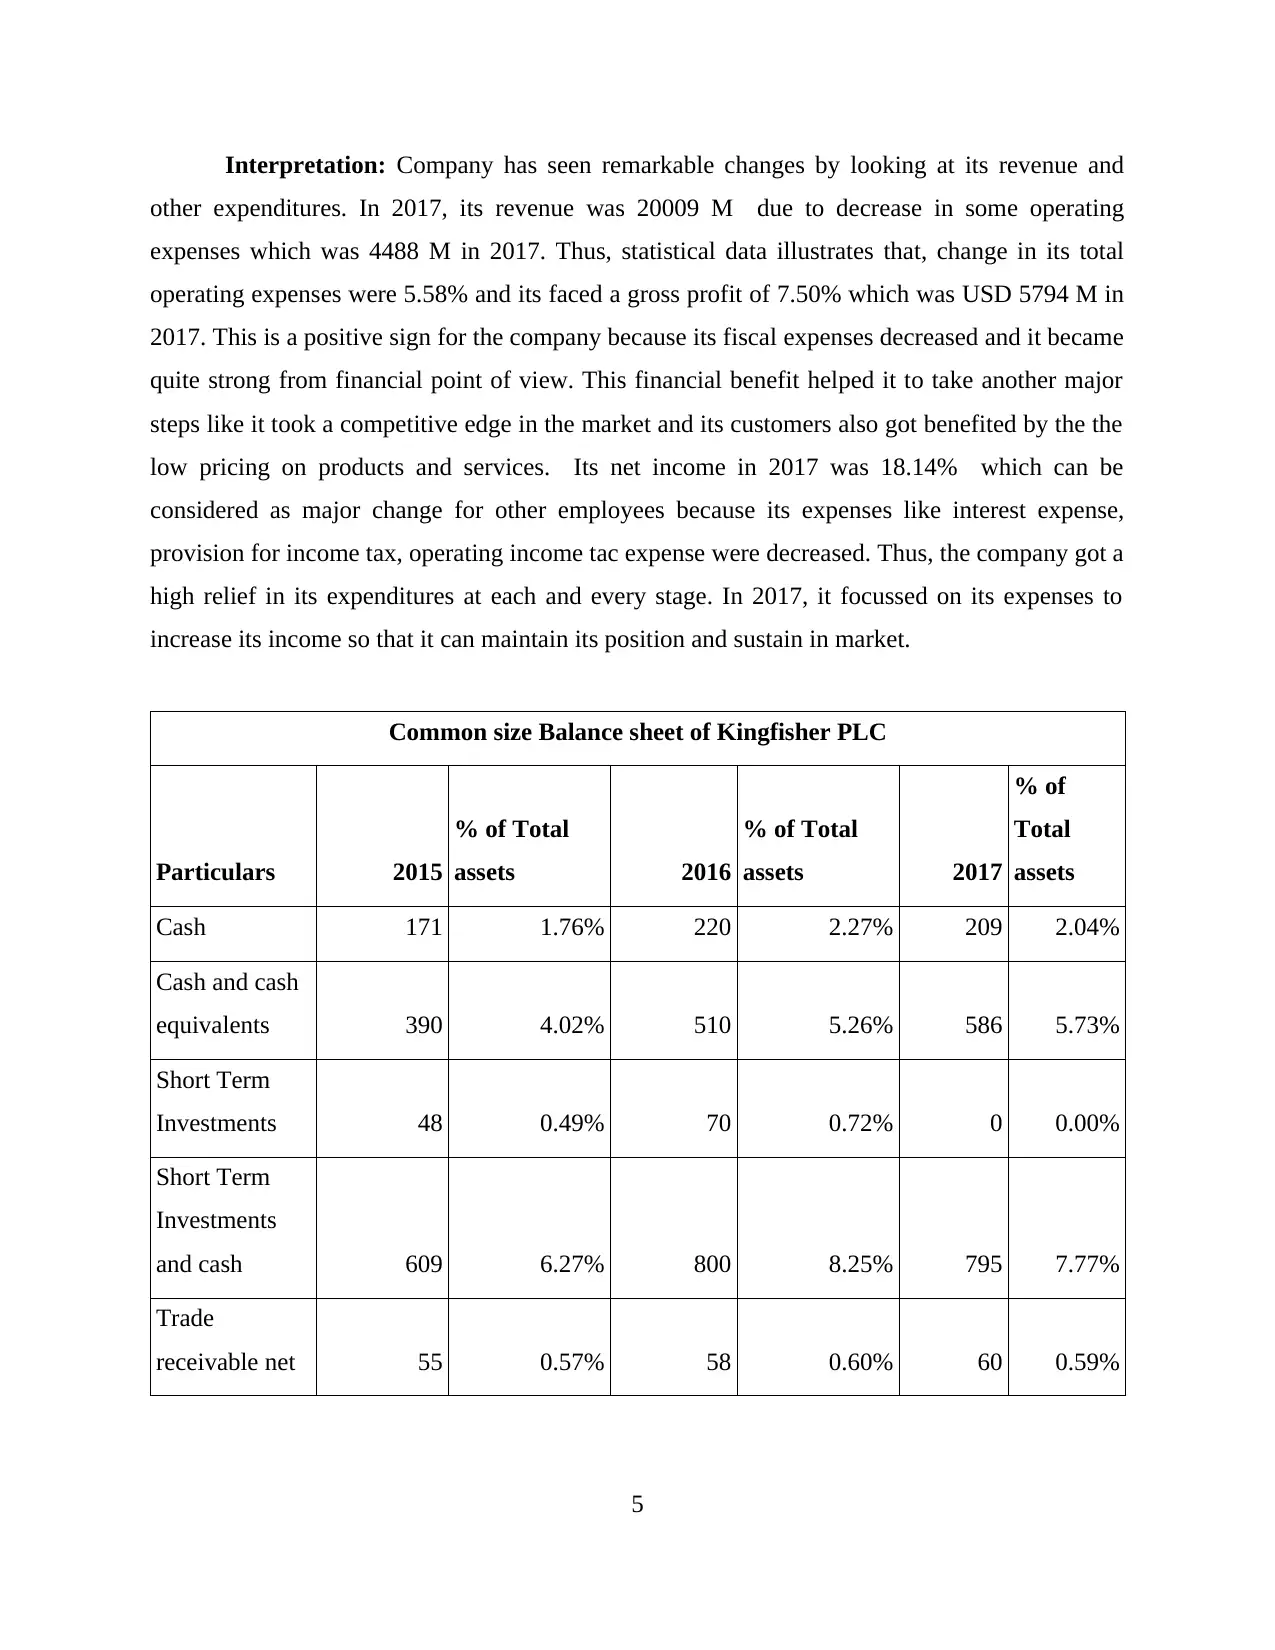
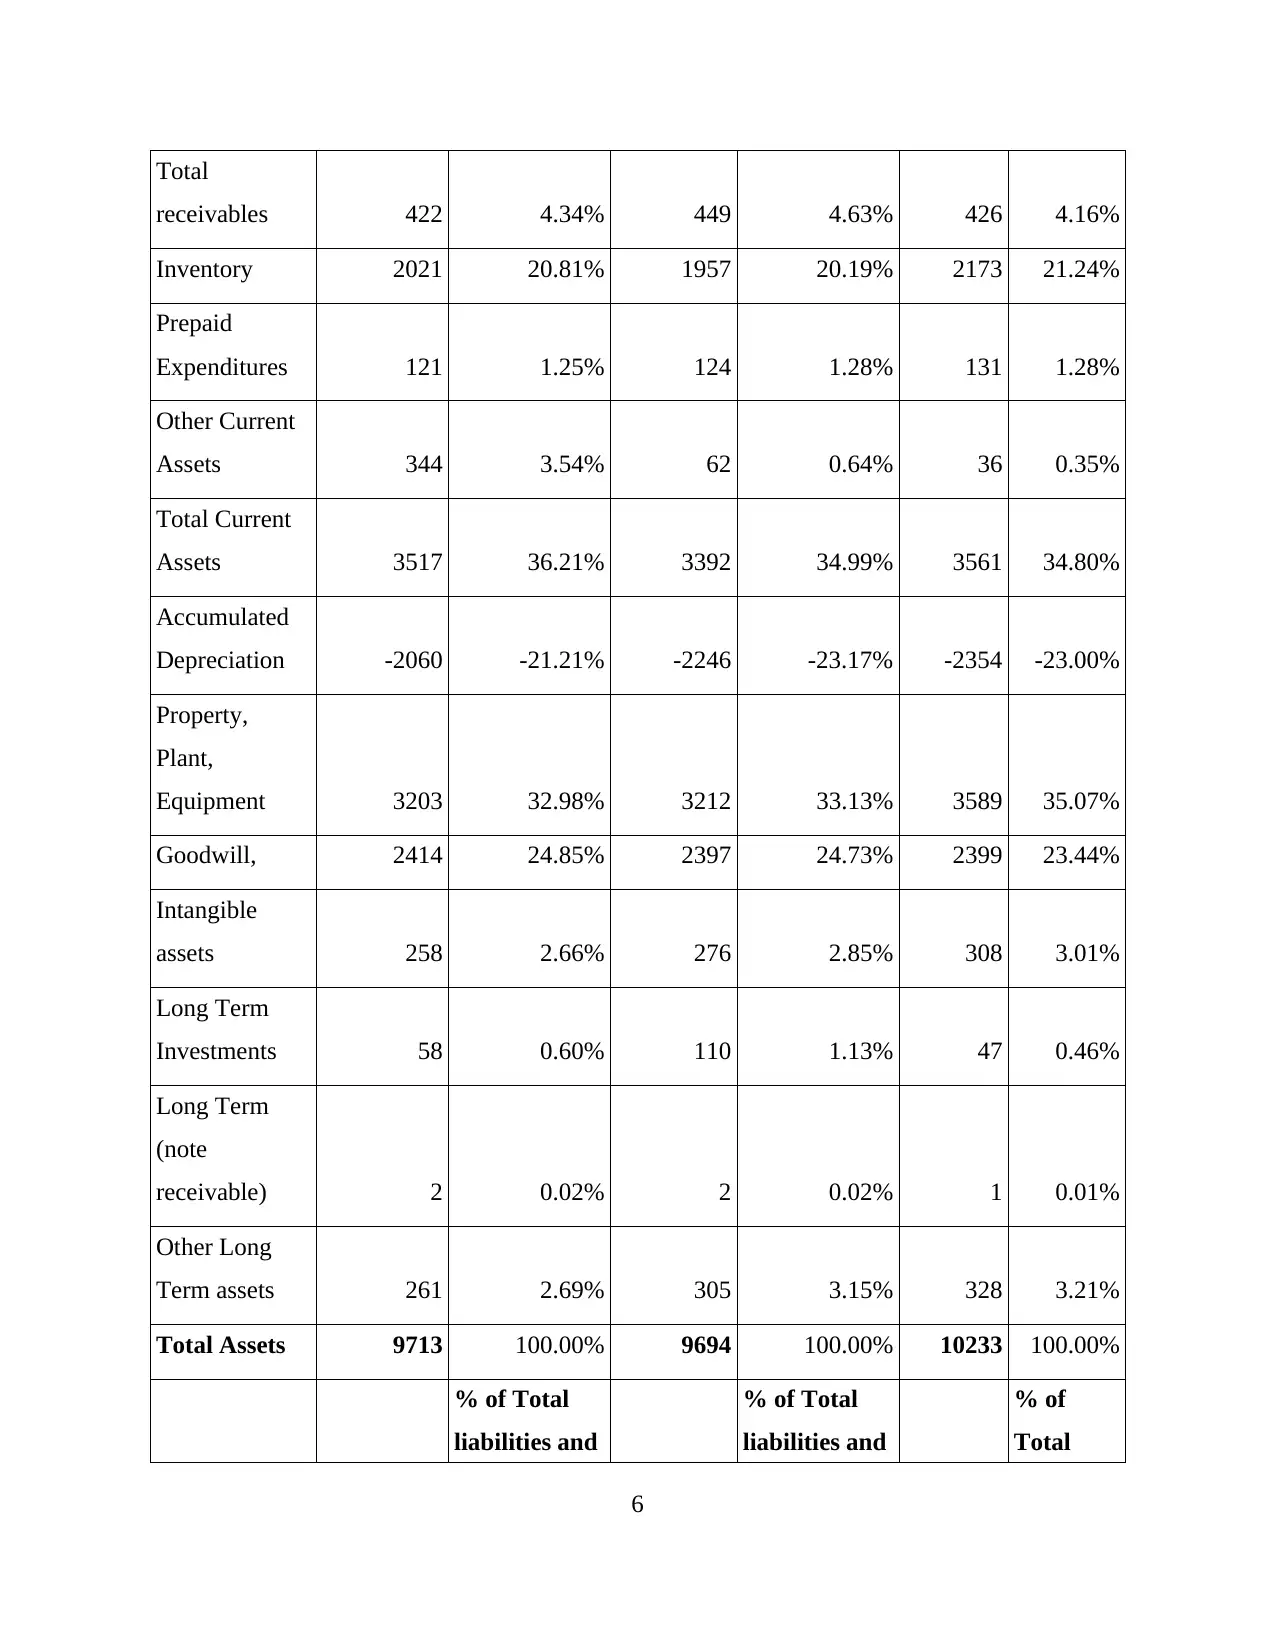
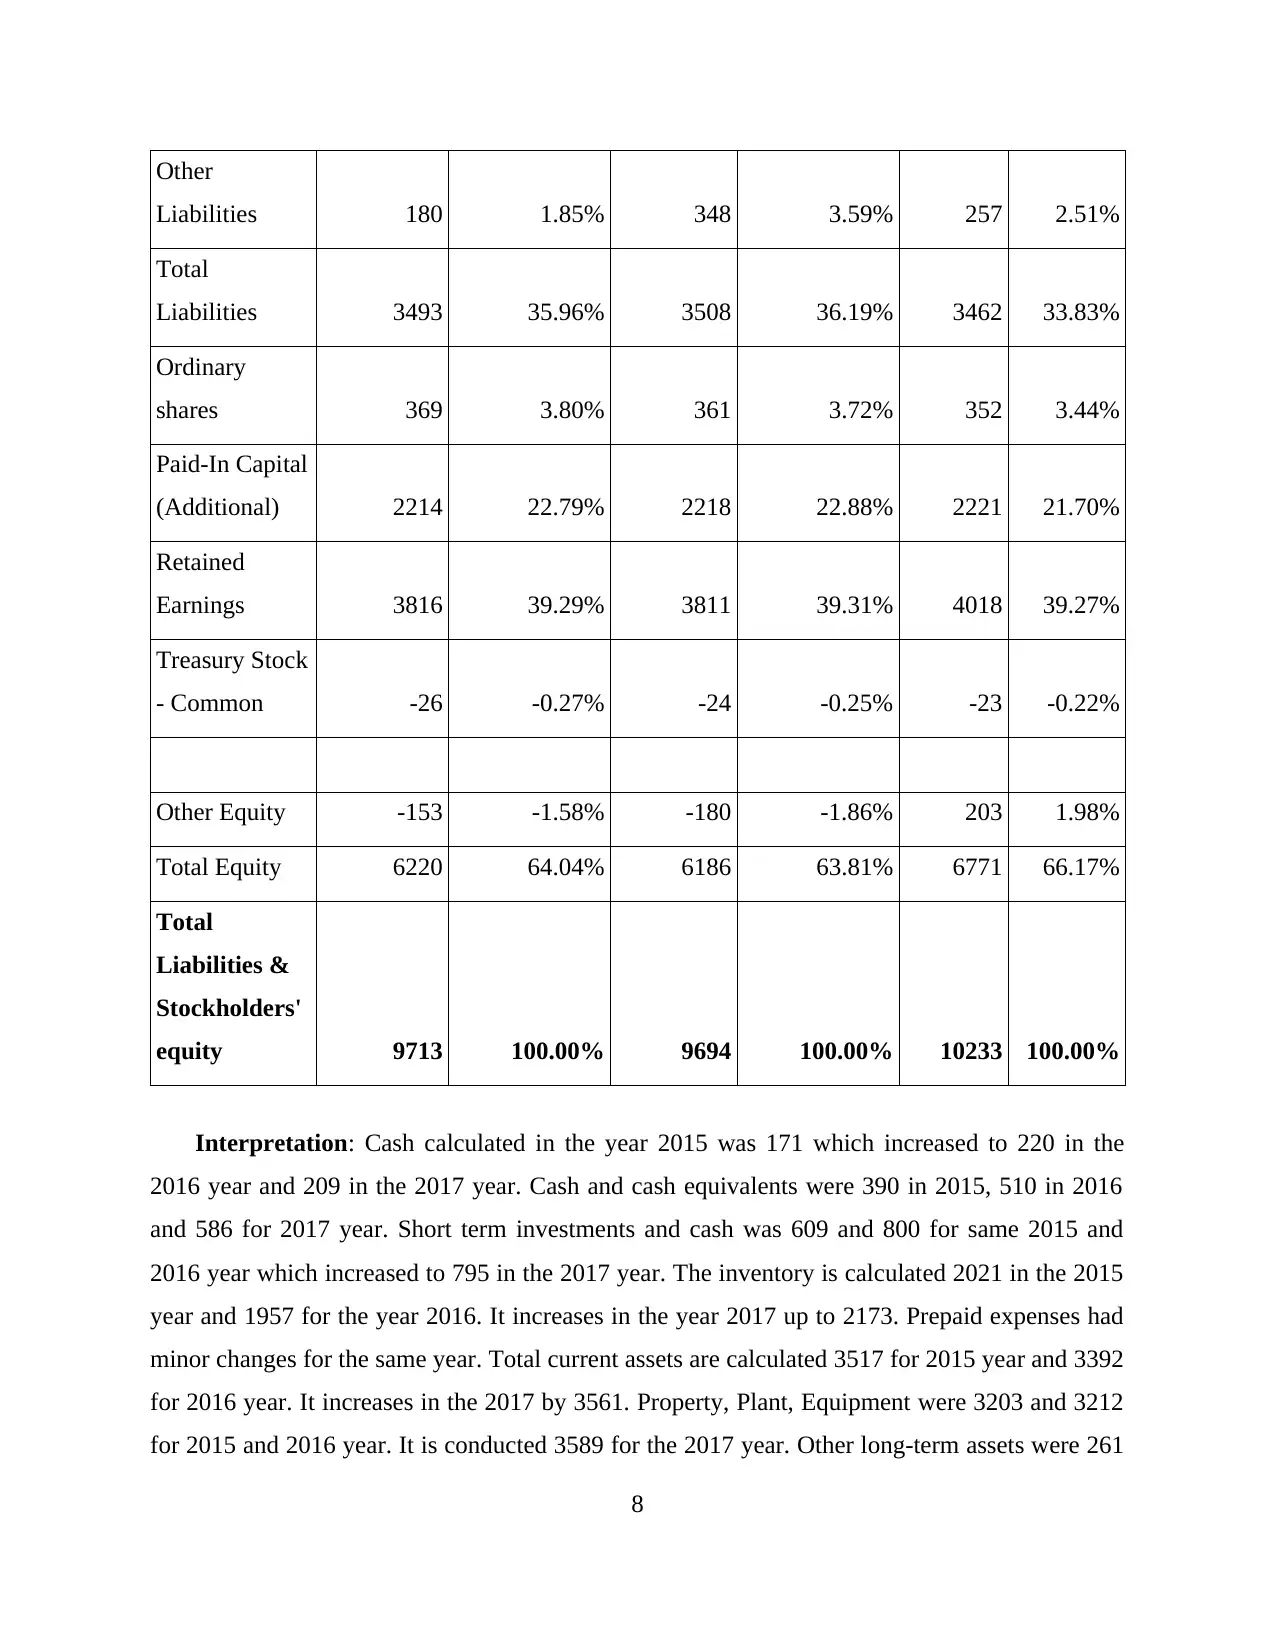
Interpretation: Cash calculated in the year 2015 was 171 which increased to 220 in the
2016 year and 209 in the 2017 year. Cash and cash equivalents were 390 in 2015, 510 in 2016
and 586 for 2017 year. Short term investments and cash was 609 and 800 for same 2015 and
2016 year which increased to 795 in the 2017 year. The inventory is calculated 2021 in the 2015
year and 1957 for the year 2016. It increases in the year 2017 up to 2173. Prepaid expenses had
minor changes for the same year. Total current assets are calculated 3517 for 2015 year and 3392
for 2016 year. It increases in the 2017 by 3561. Property, Plant, Equipment were 3203 and 3212
for 2015 and 2016 year. It is conducted 3589 for the 2017 year. Other long-term assets were 261
8
Liabilities 180 1.85% 348 3.59% 257 2.51%
Total
Liabilities 3493 35.96% 3508 36.19% 3462 33.83%
Ordinary
shares 369 3.80% 361 3.72% 352 3.44%
Paid-In Capital
(Additional) 2214 22.79% 2218 22.88% 2221 21.70%
Retained
Earnings 3816 39.29% 3811 39.31% 4018 39.27%
Treasury Stock
- Common -26 -0.27% -24 -0.25% -23 -0.22%
Other Equity -153 -1.58% -180 -1.86% 203 1.98%
Total Equity 6220 64.04% 6186 63.81% 6771 66.17%
Total
Liabilities &
Stockholders'
equity 9713 100.00% 9694 100.00% 10233 100.00%
Interpretation: Cash calculated in the year 2015 was 171 which increased to 220 in the
2016 year and 209 in the 2017 year. Cash and cash equivalents were 390 in 2015, 510 in 2016
and 586 for 2017 year. Short term investments and cash was 609 and 800 for same 2015 and
2016 year which increased to 795 in the 2017 year. The inventory is calculated 2021 in the 2015
year and 1957 for the year 2016. It increases in the year 2017 up to 2173. Prepaid expenses had
minor changes for the same year. Total current assets are calculated 3517 for 2015 year and 3392
for 2016 year. It increases in the 2017 by 3561. Property, Plant, Equipment were 3203 and 3212
for 2015 and 2016 year. It is conducted 3589 for the 2017 year. Other long-term assets were 261
8
Paraphrase This Document
Need a fresh take? Get an instant paraphrase of this document with our AI Paraphraser
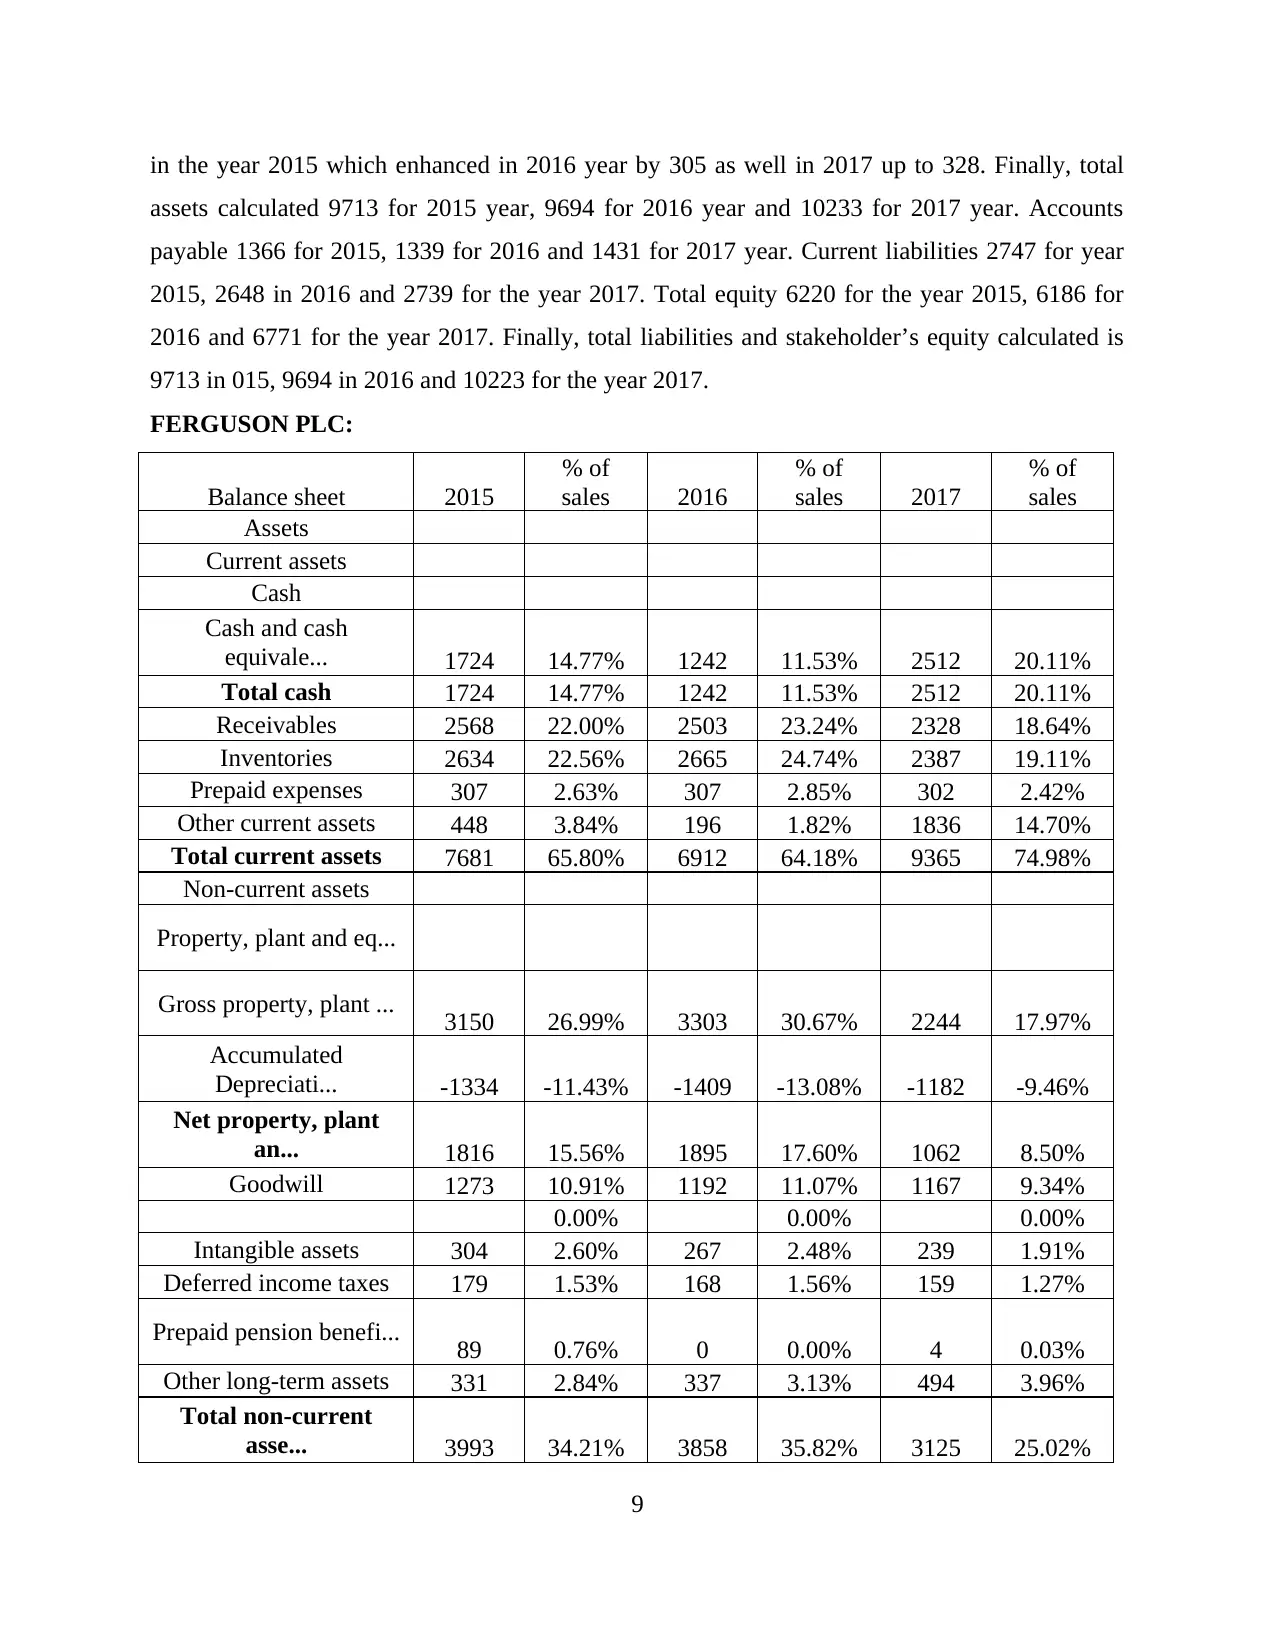
in the year 2015 which enhanced in 2016 year by 305 as well in 2017 up to 328. Finally, total
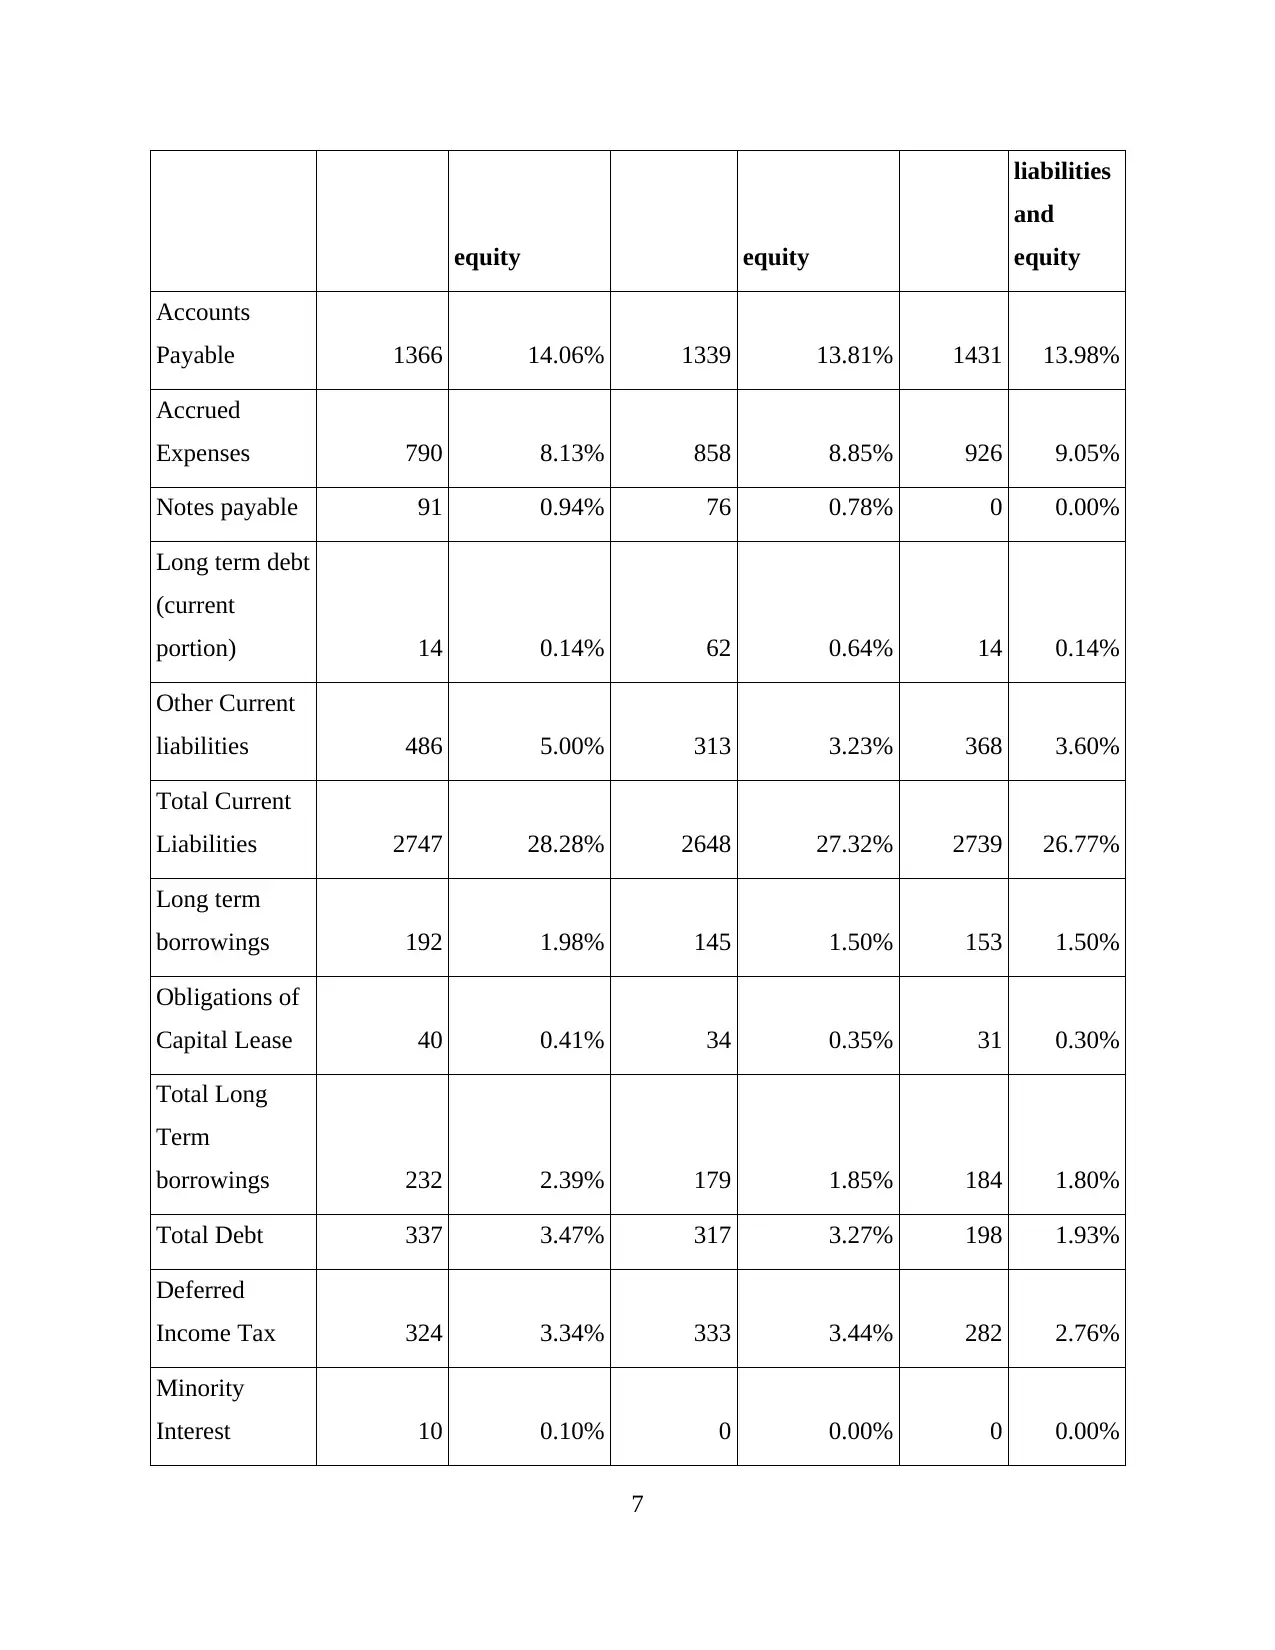
assets calculated 9713 for 2015 year, 9694 for 2016 year and 10233 for 2017 year. Accounts
payable 1366 for 2015, 1339 for 2016 and 1431 for 2017 year. Current liabilities 2747 for year
2015, 2648 in 2016 and 2739 for the year 2017. Total equity 6220 for the year 2015, 6186 for
2016 and 6771 for the year 2017. Finally, total liabilities and stakeholder’s equity calculated is
9713 in 015, 9694 in 2016 and 10223 for the year 2017.
FERGUSON PLC:
Balance sheet 2015
% of
sales 2016
% of
sales 2017
% of
sales
Assets
Current assets
Cash
Cash and cash
equivale... 1724 14.77% 1242 11.53% 2512 20.11%
Total cash 1724 14.77% 1242 11.53% 2512 20.11%
Receivables 2568 22.00% 2503 23.24% 2328 18.64%
Inventories 2634 22.56% 2665 24.74% 2387 19.11%
Prepaid expenses 307 2.63% 307 2.85% 302 2.42%
Other current assets 448 3.84% 196 1.82% 1836 14.70%
Total current assets 7681 65.80% 6912 64.18% 9365 74.98%
Non-current assets
Property, plant and eq...
Gross property, plant ... 3150 26.99% 3303 30.67% 2244 17.97%
Accumulated
Depreciati... -1334 -11.43% -1409 -13.08% -1182 -9.46%
Net property, plant
an... 1816 15.56% 1895 17.60% 1062 8.50%
Goodwill 1273 10.91% 1192 11.07% 1167 9.34%
0.00% 0.00% 0.00%
Intangible assets 304 2.60% 267 2.48% 239 1.91%
Deferred income taxes 179 1.53% 168 1.56% 159 1.27%
Prepaid pension benefi... 89 0.76% 0 0.00% 4 0.03%
Other long-term assets 331 2.84% 337 3.13% 494 3.96%
Total non-current
asse... 3993 34.21% 3858 35.82% 3125 25.02%
9
Total assets 11673 100% 10770 100% 12490 100%
Liabilities and stockh...
Liabilities
Current liabilities
Short-term debt 1562 13.38% 926 8.60% 2138 17.12%
Capital leases 6 0.05% 5 0.05% 4 0.03%
Accounts payable 2854 24.45% 2803 26.03% 2322 18.59%
Taxes payable 223 1.91% 250 2.32% 202 1.62%
Other current liabilit... 921 7.89% 706 6.56% 1782 14.27%
Total current liabilit... 5565 47.67% 4689 43.54% 6449 51.63%
Non-current liabilitie... 0.00% 0.00% 0.00%
Long-term debt 1424 12.20% 1553 14.42% 1092 8.74%
Capital leases 39 0.33% 36 0.33% 5 0.04%
Deferred taxes liabili... 83 0.71% 86 0.80% 12 0.10%
Pensions and other ben... 100 0.86% 182 1.69% 21 0.17%
Minority interest 11 0.09% -3 -0.03% -3 -0.02%
Other long-term liabil... 395 3.38% 391 3.63% 394 3.15%
Total non-current
liab... 2052 17.58% 2245 20.84% 1522 12.19%
Total liabilities 7617 65.25% 6934 64.38% 7971 63.82%
Stockholders' equity 0.00% 0.00% 0.00%
Common stock 45 0.39% 38 0.35% 38 0.30%
Additional paid-in cap... 66 0.57% 55 0.51% 55 0.44%
Accumulated other
comp... 3946 33.80% 3742 34.74% 4425 35.43%
Total stockholders'
eq... 4057 34.76% 3836 35.62% 4519 36.18%
Total liabilities and ... 11673 100% 10770 100% 12490 100%
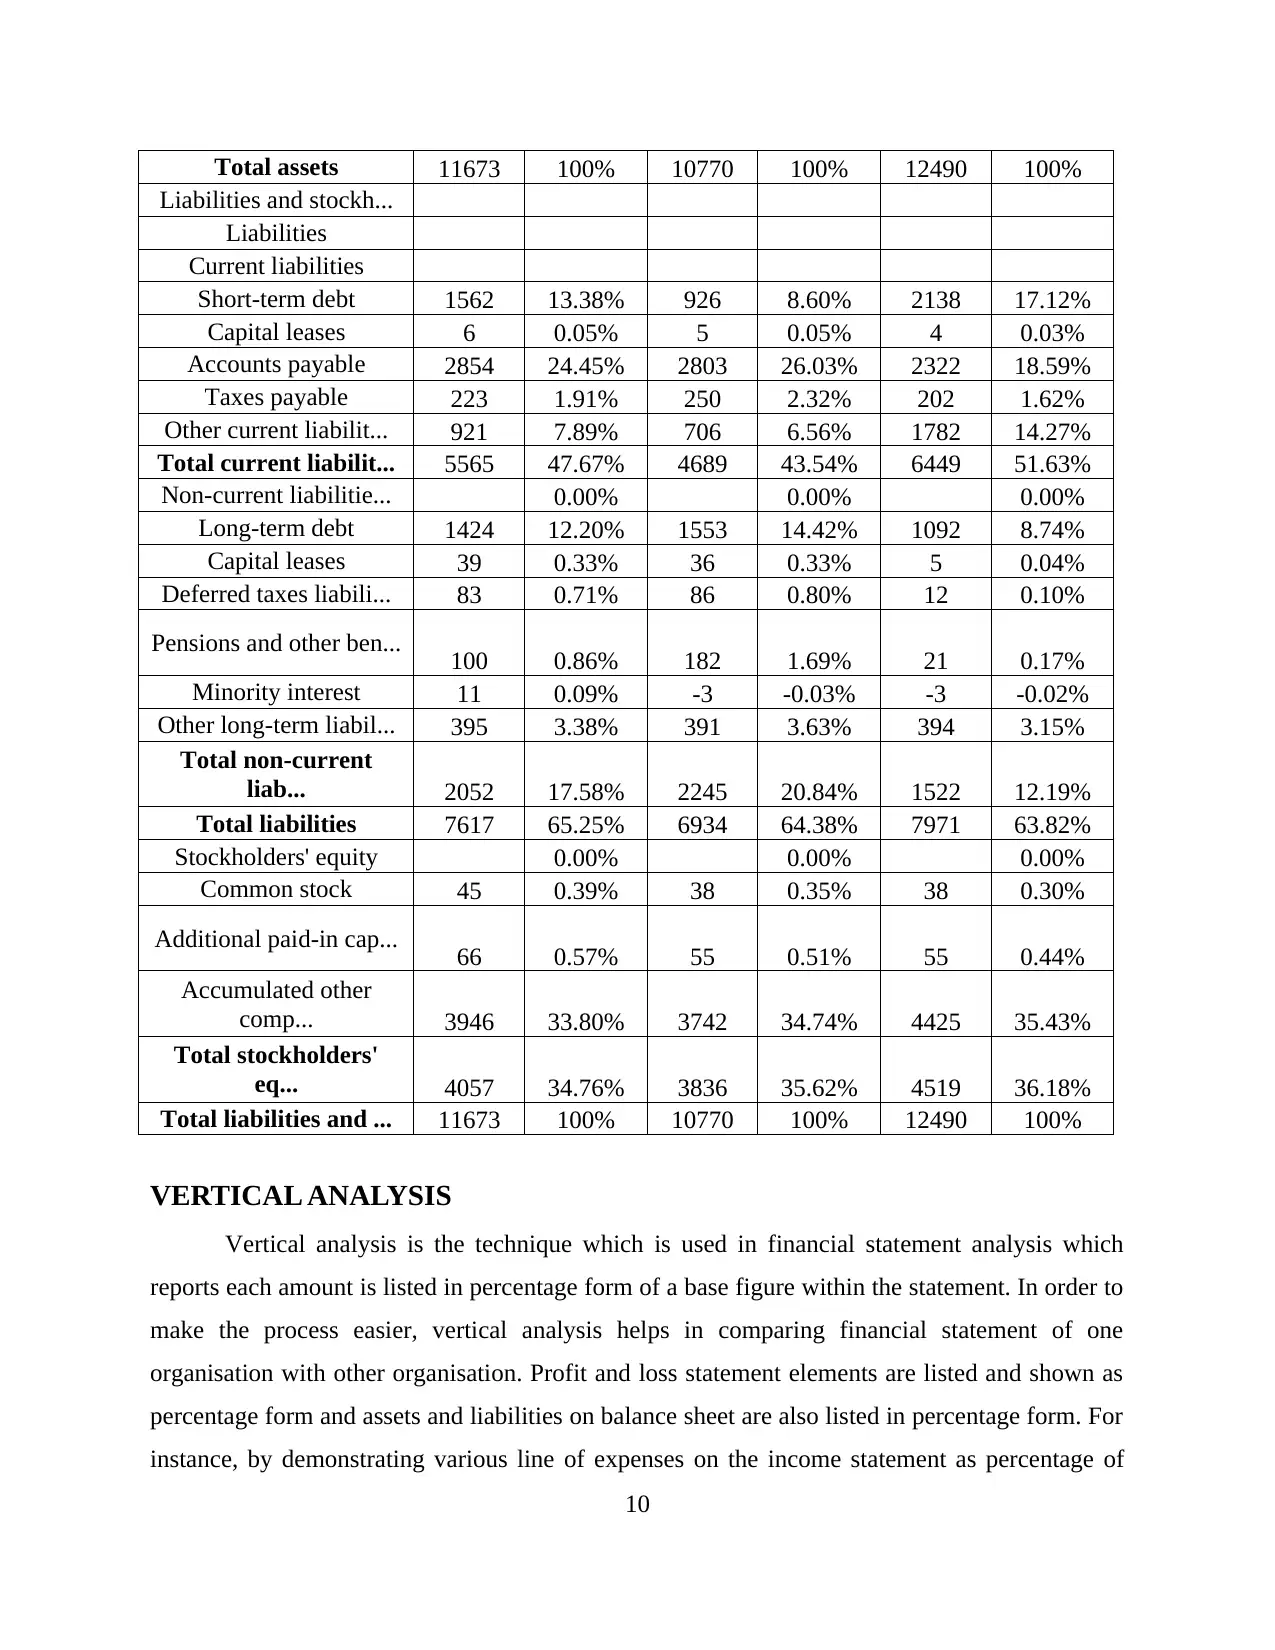
VERTICAL ANALYSIS
Vertical analysis is the technique which is used in financial statement analysis which
reports each amount is listed in percentage form of a base figure within the statement. In order to
make the process easier, vertical analysis helps in comparing financial statement of one
organisation with other organisation. Profit and loss statement elements are listed and shown as
percentage form and assets and liabilities on balance sheet are also listed in percentage form. For
instance, by demonstrating various line of expenses on the income statement as percentage of
10
Liabilities and stockh...
Liabilities
Current liabilities
Short-term debt 1562 13.38% 926 8.60% 2138 17.12%
Capital leases 6 0.05% 5 0.05% 4 0.03%
Accounts payable 2854 24.45% 2803 26.03% 2322 18.59%
Taxes payable 223 1.91% 250 2.32% 202 1.62%
Other current liabilit... 921 7.89% 706 6.56% 1782 14.27%
Total current liabilit... 5565 47.67% 4689 43.54% 6449 51.63%
Non-current liabilitie... 0.00% 0.00% 0.00%
Long-term debt 1424 12.20% 1553 14.42% 1092 8.74%
Capital leases 39 0.33% 36 0.33% 5 0.04%
Deferred taxes liabili... 83 0.71% 86 0.80% 12 0.10%
Pensions and other ben... 100 0.86% 182 1.69% 21 0.17%
Minority interest 11 0.09% -3 -0.03% -3 -0.02%
Other long-term liabil... 395 3.38% 391 3.63% 394 3.15%
Total non-current
liab... 2052 17.58% 2245 20.84% 1522 12.19%
Total liabilities 7617 65.25% 6934 64.38% 7971 63.82%
Stockholders' equity 0.00% 0.00% 0.00%
Common stock 45 0.39% 38 0.35% 38 0.30%
Additional paid-in cap... 66 0.57% 55 0.51% 55 0.44%
Accumulated other
comp... 3946 33.80% 3742 34.74% 4425 35.43%
Total stockholders'
eq... 4057 34.76% 3836 35.62% 4519 36.18%
Total liabilities and ... 11673 100% 10770 100% 12490 100%
VERTICAL ANALYSIS
Vertical analysis is the technique which is used in financial statement analysis which
reports each amount is listed in percentage form of a base figure within the statement. In order to
make the process easier, vertical analysis helps in comparing financial statement of one
organisation with other organisation. Profit and loss statement elements are listed and shown as
percentage form and assets and liabilities on balance sheet are also listed in percentage form. For
instance, by demonstrating various line of expenses on the income statement as percentage of
10
⊘ This is a preview!⊘
Do you want full access?
Subscribe today to unlock all pages.
Trusted by 1+ million students worldwide
1 out of 22
Related Documents


Your All-in-One AI-Powered Toolkit for Academic Success.
+13062052269
info@desklib.com
Available 24*7 on WhatsApp / Email
![[object Object]](/_next/static/media/star-bottom.7253800d.svg)
Unlock your academic potential
Copyright © 2020–2026 A2Z Services. All Rights Reserved. Developed and managed by ZUCOL.