Detailed Business Analysis Report for Kingfisher Plc
VerifiedAdded on 2021/02/19
|13
|4827
|271
Report
AI Summary
This report provides a business analysis of Kingfisher Plc, examining key aspects such as population and sampling techniques, including probabilistic and non-probabilistic methods. It differentiates between primary and secondary data, discussing their advantages and disadvantages. The analysis includes the calculation of mean, mode, and standard deviation. The report emphasizes the importance of an effective Management Information System (MIS) for organizational success, specifically within the context of Kingfisher Plc's operations in the home improvement and garden supply market. The report aims to offer insights into how business problems impact organizational operations and profitability.

Business Analysis
Paraphrase This Document
Need a fresh take? Get an instant paraphrase of this document with our AI Paraphraser

Table of Contents
INTRODUCTION...........................................................................................................................1
QUESTION 1...................................................................................................................................1
Population...................................................................................................................................1
Sampling Techniques:.................................................................................................................2
QUESTION 2...................................................................................................................................4
Difference in Between Primary and Secondary Data.................................................................4
Advantages and Disadvantages of Primary and Secondary Data...............................................5
QUESTION 3...................................................................................................................................7
Mean, Mode, Standard Deviation...............................................................................................7
QUESTION 4...................................................................................................................................8
Effective MIS as an Important Part of Process of an Organisation............................................8
CONCLUSION..............................................................................................................................10
REFERENCES..............................................................................................................................11
INTRODUCTION
Business Analysis can be defined as the set of tasks, knowledge and various techniques
that can be used to identify the business needs and determining solutions to the problems faced
by the business (WHAT IS BUSINESS ANALYSIS?, 2019). The problems impacts upon the
working of an organisation and also on the profitability level (Torabi, Soufi and Sahebjamnia,
2014). Not only the working and profitability is the main concern but there are also some other
aspects on which the business problems impact upon. The assignment will start with making its
focus on the importance of population and sampling techniques which an organisation makes use
of at the time of conducting surveys and some more works. In addition to this, the focus of this
assignment will also be on the primary and secondary data. The differences in between both of
these two concepts will be discussed and also the discussion of the advantages and disadvantages
of primary and secondary data will be provided. It will focus on calculating the mean, mode and
standard deviation along with making decisions related to effective management system that
helps an organisation's success and failure. The company chosen for the completion of this
assignment is Kingfisher Plc which was founded in the year 1982 and is headquartered in
London. The company provides their customers with home improvement products and garden
supplies and plants.
QUESTION 1
Population
Kingfisher Plc is an organisation which provides their customers with home improvement
products such as the home appliances and many other products for providing good experiences to
the customers with the help of services. Kingfisher is going to introduce a holiday pay scheme in
their organisation under which the employees will be provided with holidays and also they will
receive compensation in the form of their monthly and daily wages without any deduction to be
made in their salary or wages for the time period they are taking the holidays (Storey, 2016).
This policy is being implemented in the organisation but with the consent of employees and for
this purpose Kingfisher is conducting a survey in their office that will provide them with the
consent of employees to implement this policy in their working or not (Paul, Yeates and Cadle,
2014). On the very basis and the above provided scenario, the significances of Population and
Sampling Techniques are presented as under:
1
⊘ This is a preview!⊘
Do you want full access?
Subscribe today to unlock all pages.
Trusted by 1+ million students worldwide

Population
It can be defined as the people covering area in the process of conducting the survey. In
other words, it can be said that people from a large area is selected for conducting the survey at
any place which is considered as population for the surveys. On the basis of this survey in
Kingfisher the decision related to the implementation of the policy or not will be decided.
Looking upon this condition population is considered as the most important at the time of
conducting surveys as the employees will decide about the implementation of the decision or not.
With the help of answers provided by the population it will be possible for the organisation to
reach to the conclusion whether the decision will be in or against the provided situation. So
population is very important at the time of conducting the surveys.
For example, in knowing about the population to be targeted for a particular survey, the
use of Target Population Analysis can be done with the help of which it will be easy to define the
target population of an advertising campaign, academic study or governmental service.
Population covers a vast area but in the surveys population is the collection of those people who
have knowledge and their consent is important and will make some sense in helping the survey
to reach conclusion (Quinlan and et. al., 2019). For example, in case the organisation is
conducting a survey related to implementation of new working style for which it is conducting
survey to know how much employees are ready and how much not. Here, the correct population
that will be used for this survey is the office employees who have to work in the organisation and
with the new working style. So choosing employees as the population will make sense, other will
not.
Sampling Techniques:
Sampling can be defined as the way with the help of which observations are selected
from a population to be in the sample for conducting the survey. There are many techniques for
collecting samples for the completion of survey but the mostly used sampling techniques are
Probabilistic and Non Probabilistic Sampling (Park and et. al., 2014). In the Probabilistic
Sampling Method, there are chances of selection of each individual in the population and in case
of Non Probabilistic Sampling, there is no estimation and surety of getting selected in the
population used in the survey. It is because this method removes the chance of biasness to much
extent as no one has the information about being selected in the survey. So not only in this way,
2
Paraphrase This Document
Need a fresh take? Get an instant paraphrase of this document with our AI Paraphraser

but also in many other ways, with the help of which an organisation like the Kingfisher Plc will
be able to have good results from the surveys conducted. In addition to this, it will also be
possible for the company to remove the feeling of biasness from the employees as in the case of
probabilistic sampling, there are chances that employees could feel that they are cheated in cases
they are not selected in the survey. On the other hand, non probabilistic sampling has also its
own advantages and disadvantages which impacts upon the reliability of the survey and could
also impact upon the future decisions (Quak, Balm and Posthumus, 2014). So it becomes
important for the organisation to take care of the techniques which they are making use of at the
time of conducting surveys.
The surveys also differs as not only one method could be implemented in all the types of
surveys in an organisation. The purposes of conducting surveys also differs and the respondents
chosen for the completion of survey will also be different depending upon the purposes of
surveys. Taking as an example, as Marks & Spencer is conducting survey so as to know about
the condition of the workplace whether the condition provided to them is able to satisfy,
motivating them and retaining them for a long period of time in the organisation. In this kind of
survey, there is a need for the organisation to choose the employees of the organisation so that
they could provide with the company with the actual ongoing situations of the working
conditions in the company (Müller and et. al. 2016). It is because employees are the one who are
actually concerned and connected with the organisation and making use of services of Marks &
Spencer. Not others could provide right information about what is going on inside the
organisation. Likewise, the organisation is conducting a survey with the help of which, it wants
to know about the quality of products and services which the company is going to provide to
their customers (Lema and et. al., 2017). The same also applies to Kingfisher Plc at the time of
conducting the surveys to know properly which is the right target population to be considered by
the company in order to get the right and accurate results by conducting the surveys. In this way,
the sampling techniques and their implementation in the proper way could provide the company
with many benefits and can also cause loss and inadequate results that could spoil the complete
purpose of the company to conduct surveys.
3
QUESTION 2
Difference in Between Primary and Secondary Data
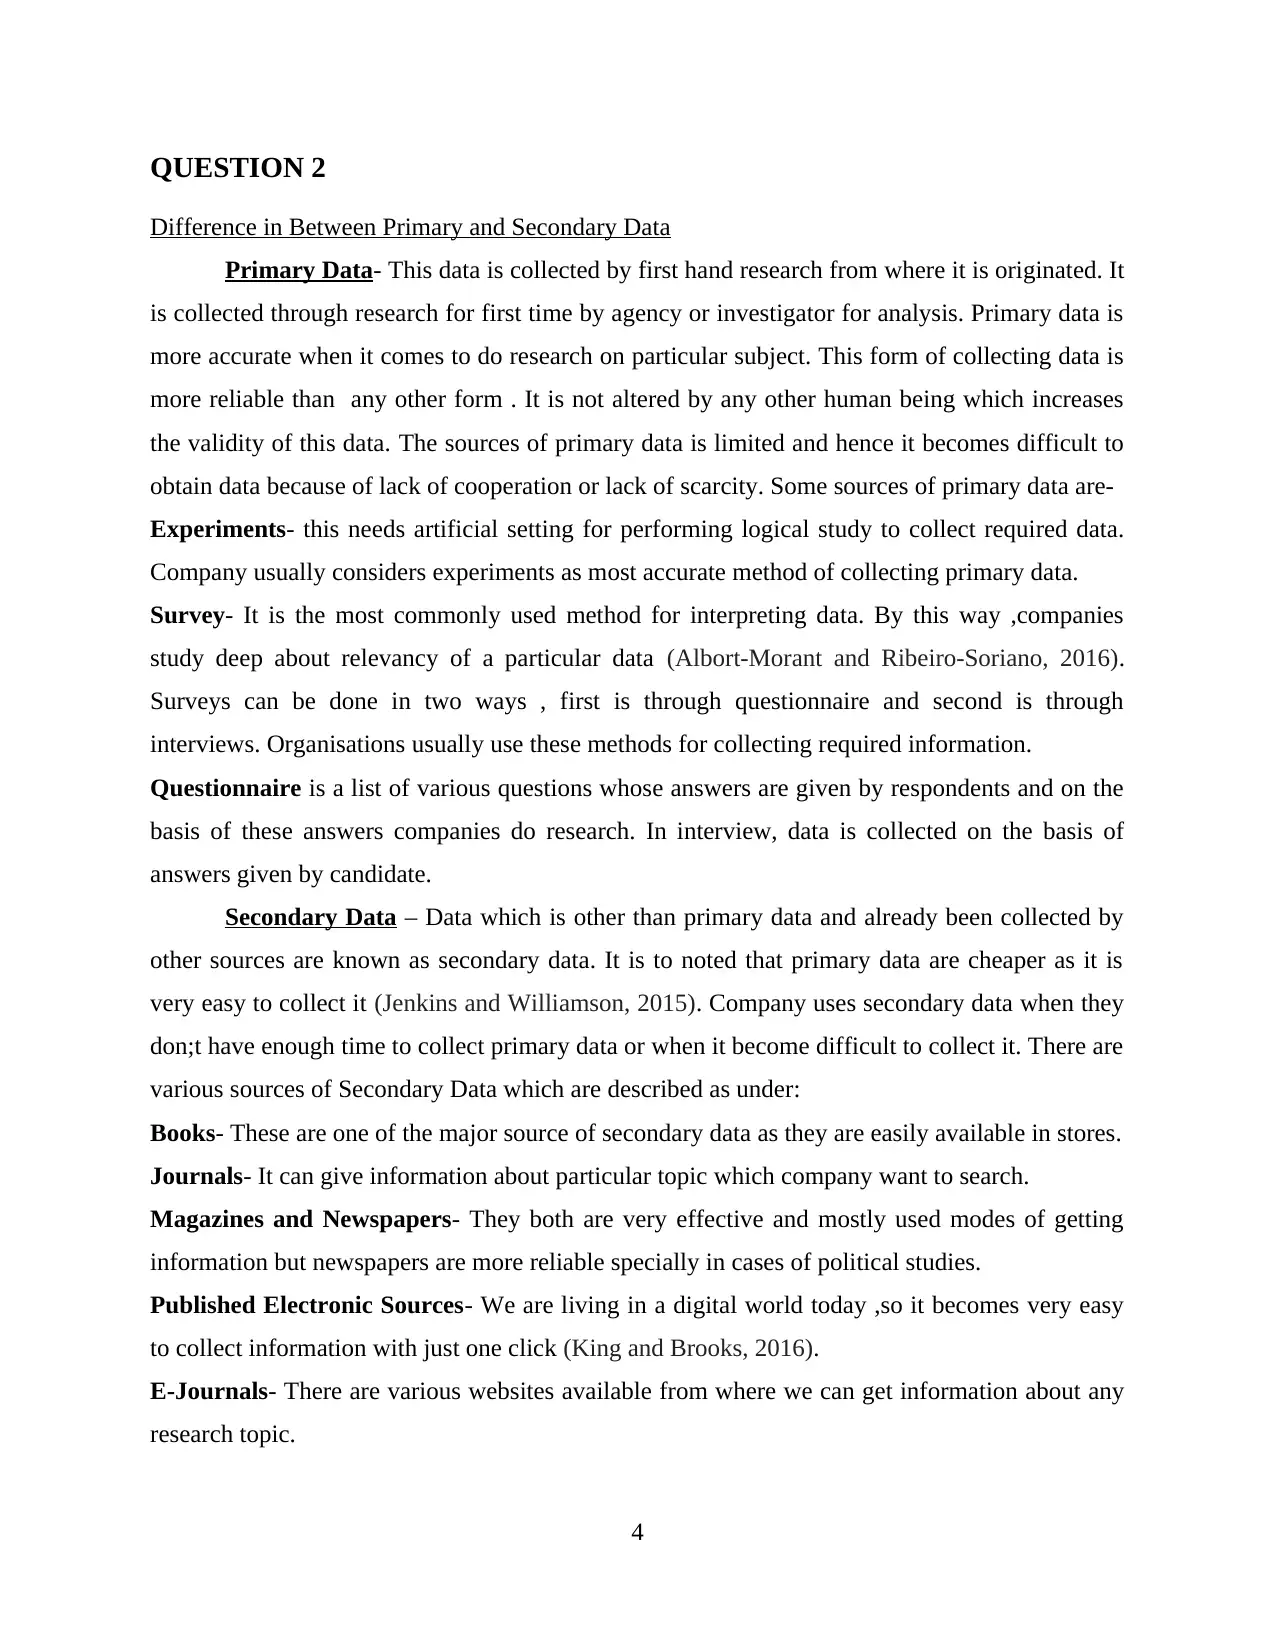
Primary Data- This data is collected by first hand research from where it is originated. It
is collected through research for first time by agency or investigator for analysis. Primary data is
more accurate when it comes to do research on particular subject. This form of collecting data is
more reliable than any other form . It is not altered by any other human being which increases
the validity of this data. The sources of primary data is limited and hence it becomes difficult to
obtain data because of lack of cooperation or lack of scarcity. Some sources of primary data are-
Experiments- this needs artificial setting for performing logical study to collect required data.
Company usually considers experiments as most accurate method of collecting primary data.
Survey- It is the most commonly used method for interpreting data. By this way ,companies
study deep about relevancy of a particular data (Albort-Morant and Ribeiro-Soriano, 2016).
Surveys can be done in two ways , first is through questionnaire and second is through
interviews. Organisations usually use these methods for collecting required information.
Questionnaire is a list of various questions whose answers are given by respondents and on the
basis of these answers companies do research. In interview, data is collected on the basis of
answers given by candidate.
Secondary Data – Data which is other than primary data and already been collected by
other sources are known as secondary data. It is to noted that primary data are cheaper as it is
very easy to collect it (Jenkins and Williamson, 2015). Company uses secondary data when they
don;t have enough time to collect primary data or when it become difficult to collect it. There are
various sources of Secondary Data which are described as under:
Books- These are one of the major source of secondary data as they are easily available in stores.
Journals- It can give information about particular topic which company want to search.
Magazines and Newspapers- They both are very effective and mostly used modes of getting
information but newspapers are more reliable specially in cases of political studies.
Published Electronic Sources- We are living in a digital world today ,so it becomes very easy
to collect information with just one click (King and Brooks, 2016).
E-Journals- There are various websites available from where we can get information about any
research topic.
4
Difference in Between Primary and Secondary Data
Primary Data- This data is collected by first hand research from where it is originated. It
is collected through research for first time by agency or investigator for analysis. Primary data is
more accurate when it comes to do research on particular subject. This form of collecting data is
more reliable than any other form . It is not altered by any other human being which increases
the validity of this data. The sources of primary data is limited and hence it becomes difficult to
obtain data because of lack of cooperation or lack of scarcity. Some sources of primary data are-
Experiments- this needs artificial setting for performing logical study to collect required data.
Company usually considers experiments as most accurate method of collecting primary data.
Survey- It is the most commonly used method for interpreting data. By this way ,companies
study deep about relevancy of a particular data (Albort-Morant and Ribeiro-Soriano, 2016).
Surveys can be done in two ways , first is through questionnaire and second is through
interviews. Organisations usually use these methods for collecting required information.
Questionnaire is a list of various questions whose answers are given by respondents and on the
basis of these answers companies do research. In interview, data is collected on the basis of
answers given by candidate.
Secondary Data – Data which is other than primary data and already been collected by
other sources are known as secondary data. It is to noted that primary data are cheaper as it is
very easy to collect it (Jenkins and Williamson, 2015). Company uses secondary data when they
don;t have enough time to collect primary data or when it become difficult to collect it. There are
various sources of Secondary Data which are described as under:
Books- These are one of the major source of secondary data as they are easily available in stores.
Journals- It can give information about particular topic which company want to search.
Magazines and Newspapers- They both are very effective and mostly used modes of getting
information but newspapers are more reliable specially in cases of political studies.
Published Electronic Sources- We are living in a digital world today ,so it becomes very easy
to collect information with just one click (King and Brooks, 2016).
E-Journals- There are various websites available from where we can get information about any
research topic.
4
⊘ This is a preview!⊘
Do you want full access?
Subscribe today to unlock all pages.
Trusted by 1+ million students worldwide
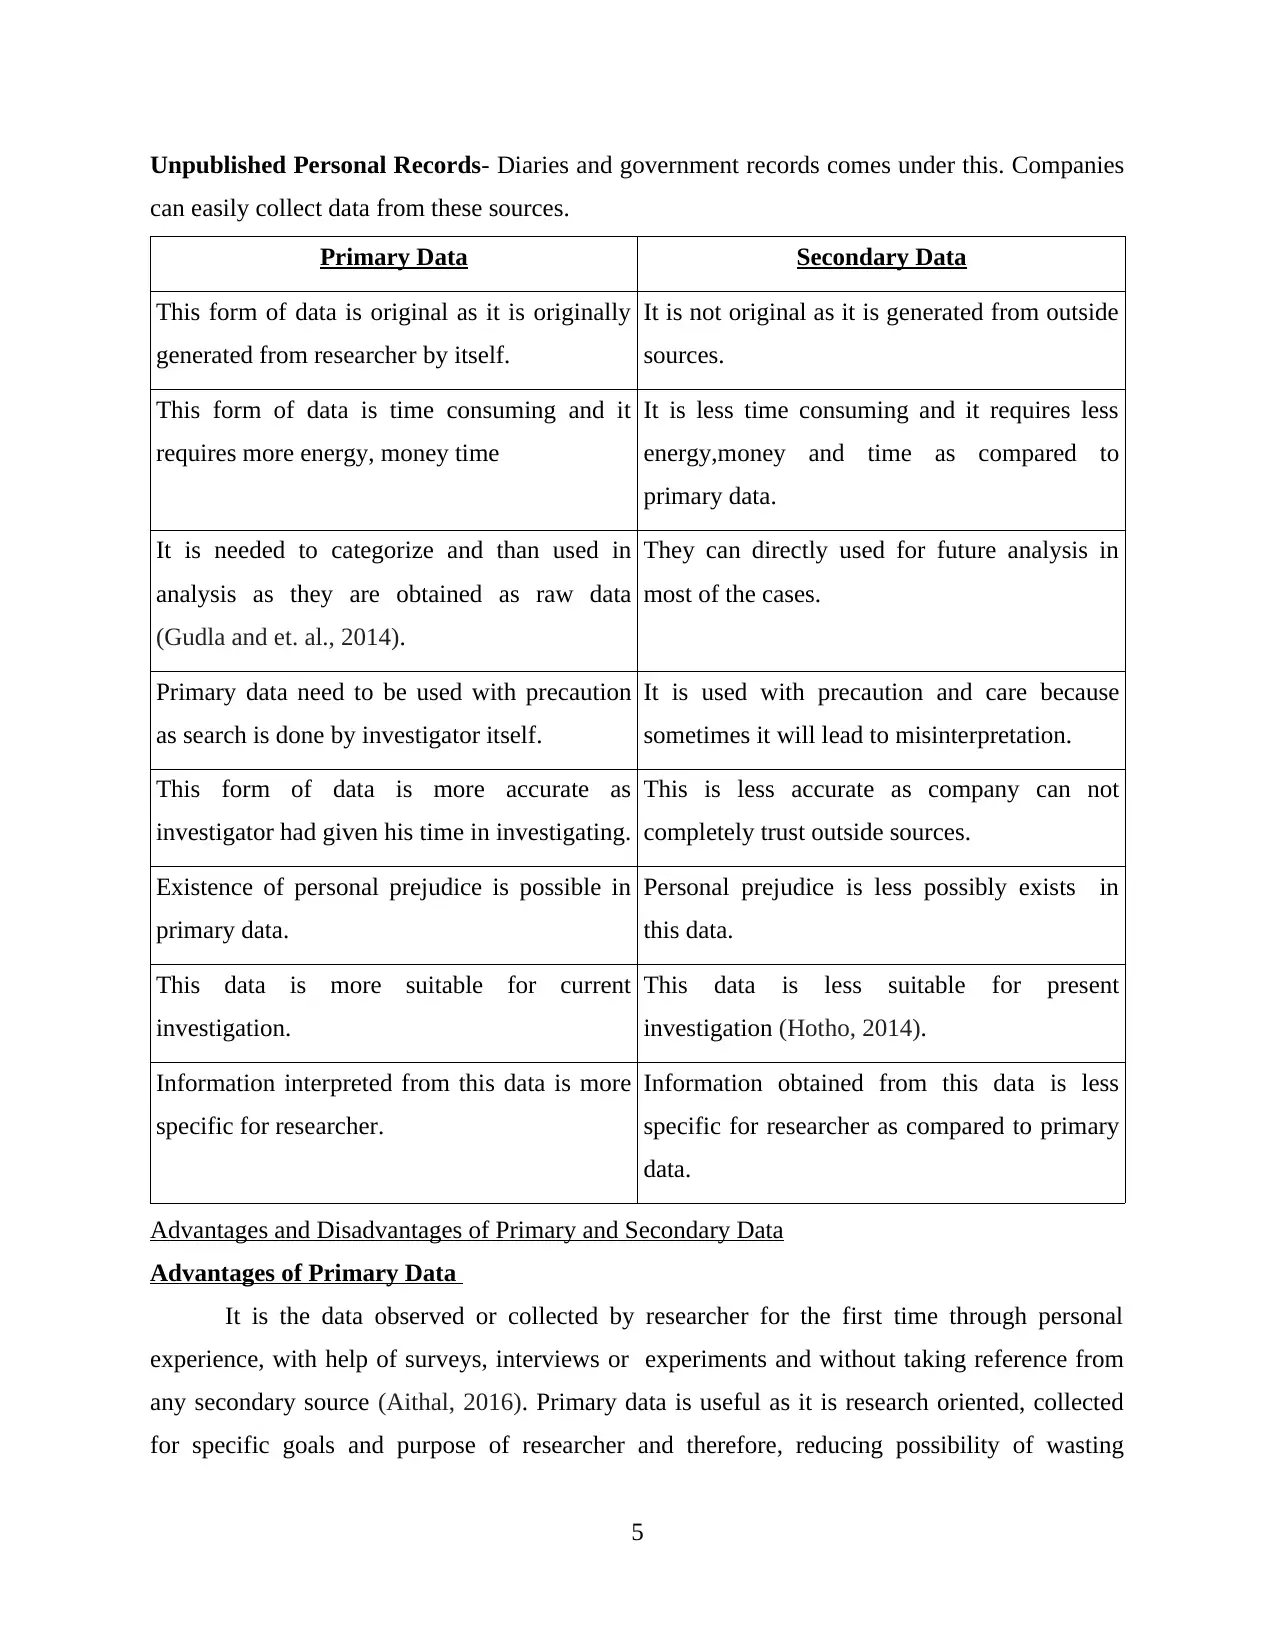
Unpublished Personal Records- Diaries and government records comes under this. Companies
can easily collect data from these sources.
Primary Data Secondary Data
This form of data is original as it is originally
generated from researcher by itself.
It is not original as it is generated from outside
sources.
This form of data is time consuming and it
requires more energy, money time
It is less time consuming and it requires less
energy,money and time as compared to
primary data.
It is needed to categorize and than used in
analysis as they are obtained as raw data
(Gudla and et. al., 2014).
They can directly used for future analysis in
most of the cases.
Primary data need to be used with precaution
as search is done by investigator itself.
It is used with precaution and care because
sometimes it will lead to misinterpretation.
This form of data is more accurate as
investigator had given his time in investigating.
This is less accurate as company can not
completely trust outside sources.
Existence of personal prejudice is possible in
primary data.
Personal prejudice is less possibly exists in
this data.
This data is more suitable for current
investigation.
This data is less suitable for present
investigation (Hotho, 2014).
Information interpreted from this data is more
specific for researcher.
Information obtained from this data is less
specific for researcher as compared to primary
data.
Advantages and Disadvantages of Primary and Secondary Data
Advantages of Primary Data
It is the data observed or collected by researcher for the first time through personal
experience, with help of surveys, interviews or experiments and without taking reference from
any secondary source (Aithal, 2016). Primary data is useful as it is research oriented, collected
for specific goals and purpose of researcher and therefore, reducing possibility of wasting
5
Paraphrase This Document
Need a fresh take? Get an instant paraphrase of this document with our AI Paraphraser

resources. While collecting primary data researcher always have an option to change the course
of action whenever needed, and can select another platforms or technique which is more suitable
for conducting study for related project. Primary data provides original data which do not carry
any biasness or opinions of third parties. Primary data is more reliable and authentic as it is
collected by personal efforts of researcher who is well aware about the nature of
project/research and therefore understand what kind of data is needed. One more advantage of
primary data is that it is up – to – date and does not need any alteration as it is already related
with the current circumstances prevailing in the market.
Disadvantages of Primary Data
To collect primary data huge expenses are needed for conducting interviews, surveys,
experiments, etc. Also methods and procedures adopted are more time consuming and requires
lot of assets in form of extra employees, updated equipments and questionnaires/forms required
for collecting data from primary source. A large sample is required to understand views of an
audience collected through personal and direct interaction. An expert is also needed to generalise
them in an easy and effective manner. Sometimes outcome from research audience is not flexible
and may be inaccurate due to inherent bias or lack of interest of respondents.
Advantages of Secondary Data
Data already in existence is secondary data, which can be collected from books, journals,
old records, documents and also available in electronic form on various sites over internet. As
data is already present at different sources there is no hassle for collection of data. Secondary
data is usually available in huge amount in form of old reports and documents providing
information in detail (Alonso‐Almeida and et. al., 2015). It also help in providing references
given by experts making it more worthy. Secondary data is economical, both in terms of time
and cost. It is cheaper as no extra money is needed to conduct any survey or experiment and
now, it can be collected even without spending a single amount, easily by browsing
internet(many documents and information are freely available on various sites) or taking help of
statistical officer or local media by making a phone call.
Researcher can also save time by using secondary data as it is a previously used data
therefore do not require extra efforts and time for its collection. Time required for making
personal interaction, conducting interviews, etc. is also saved. Need for expert can also be
eliminated as data available on different sources is already collected and summarised by an
6
expert making it easy to understand and can be generalised according to the requirement of
current research. One more advantage of secondary data is that researcher is not personally
accountable for correctness and quality of data as it is collected by someone else.
Disadvantages of Secondary Data
Biggest risk while using secondary data is about accuracy and relevancy. Researcher has
to be more alert regarding applicability of data i.e. it is related to topic/research or not. It is also
possible that secondary data is out dated or may be related to other circumstances, not much
significant for current situation therefore making it difficult to compare facts. Secondary data is
not much authentic as it may be biased, altered by old users and it is also possible that any part of
data is missing.
QUESTION 3
Mean, Mode, Standard Deviation
Fiscal year
ends in
January.
GBP in
millions
except per
share data
Turnover
Cost of
Revenue
Gross Profit Total Operating
Expenses
Net Income
Available to
Common
Shareholde
rs
EBITDA
2015-01 10966 6918 4048 3366 573 922
2016-01 10441 6545 3896 3207 412 769
2017-01 11225 7050 4175 3426 610 1031
2018-01 11655 7352 4303 3621 485 953
2019-01 11685 7376 4309 3731 218 612
Mean 11194 7048 4146 3470 460 857
Mode 4048 2870 682 501 573 922
Standard
Deviation
518 343 176 208 156 167
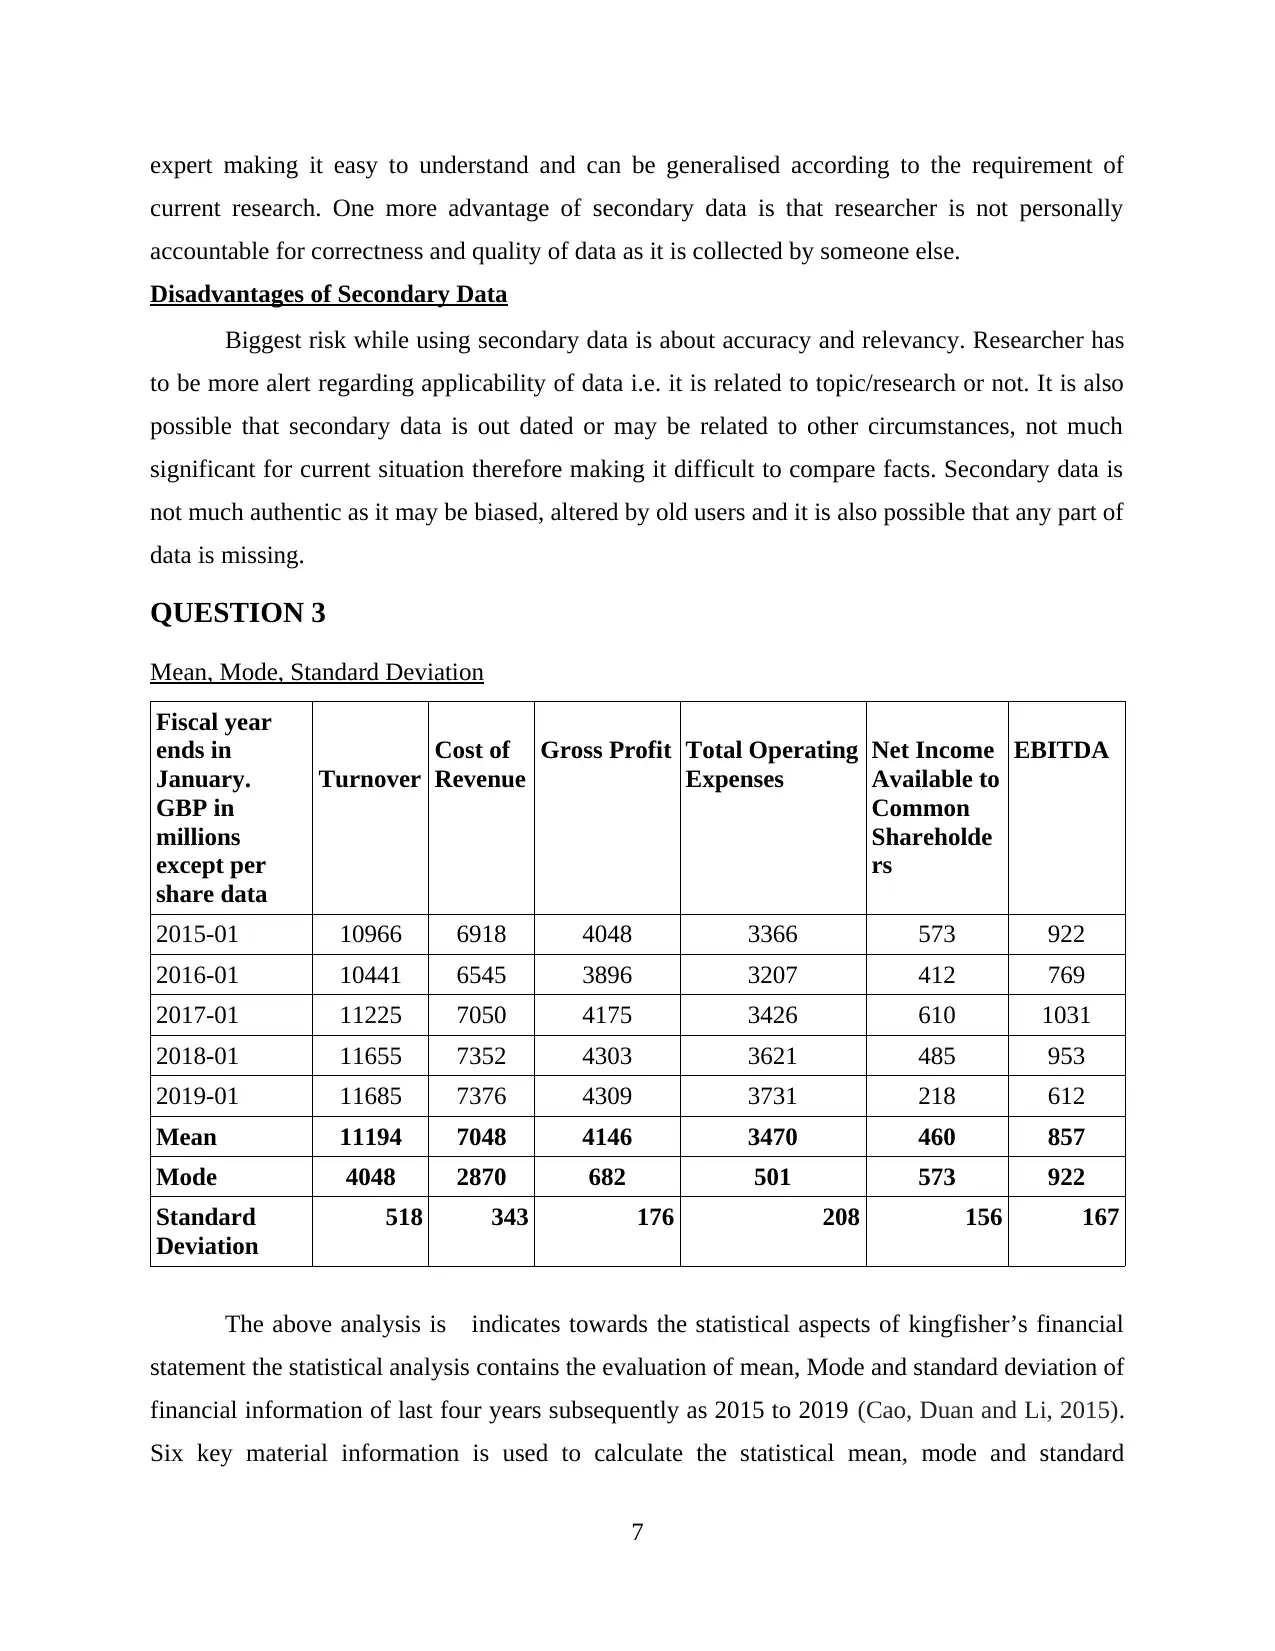
The above analysis is indicates towards the statistical aspects of kingfisher’s financial
statement the statistical analysis contains the evaluation of mean, Mode and standard deviation of
financial information of last four years subsequently as 2015 to 2019 (Cao, Duan and Li, 2015).
Six key material information is used to calculate the statistical mean, mode and standard
7
current research. One more advantage of secondary data is that researcher is not personally
accountable for correctness and quality of data as it is collected by someone else.
Disadvantages of Secondary Data
Biggest risk while using secondary data is about accuracy and relevancy. Researcher has
to be more alert regarding applicability of data i.e. it is related to topic/research or not. It is also
possible that secondary data is out dated or may be related to other circumstances, not much
significant for current situation therefore making it difficult to compare facts. Secondary data is
not much authentic as it may be biased, altered by old users and it is also possible that any part of
data is missing.
QUESTION 3
Mean, Mode, Standard Deviation
Fiscal year
ends in
January.
GBP in
millions
except per
share data
Turnover
Cost of
Revenue
Gross Profit Total Operating
Expenses
Net Income
Available to
Common
Shareholde
rs
EBITDA
2015-01 10966 6918 4048 3366 573 922
2016-01 10441 6545 3896 3207 412 769
2017-01 11225 7050 4175 3426 610 1031
2018-01 11655 7352 4303 3621 485 953
2019-01 11685 7376 4309 3731 218 612
Mean 11194 7048 4146 3470 460 857
Mode 4048 2870 682 501 573 922
Standard
Deviation
518 343 176 208 156 167
The above analysis is indicates towards the statistical aspects of kingfisher’s financial
statement the statistical analysis contains the evaluation of mean, Mode and standard deviation of
financial information of last four years subsequently as 2015 to 2019 (Cao, Duan and Li, 2015).
Six key material information is used to calculate the statistical mean, mode and standard
7
⊘ This is a preview!⊘
Do you want full access?
Subscribe today to unlock all pages.
Trusted by 1+ million students worldwide

deviations which is turnover, cost of revenues, gross profit, operating expenses, common
shareholders and EBITDA.
Turnover: the average turnover is calculated as 11194 GBP in millions for the years
from 2015 to 2017. 4048 GBP in millions is counted as mode subject to last 4 years. Standard
deviation stated at 518 GBP in millions.
Cost of revenues: Statistical mean of cost of revenues is calculated as 7048 GBP in
millions for last four years. Mode is calculated as 2870 GBP million for the year 2015 to 2017.
Standard deviation was measured as 343 GBO in million.
Gross profit: Statistical mean of gross profit is calculated as 4146 GBP in millions for
last four years. Mode is calculated as 682 GBP million for the year 2015 to 2017. Standard
deviation was measured as 176 GBO in million.
Operating expenses: It is evaluated that the mean for the year 2015 to 2017 the
operating expenses is calculated as 3470 GBP in millions, mode is calculated as 501 GBP in
millions and the standard deviation was calculated as 208 GBP in million for the year 2015 to
2017.
Common shareholders: the average shareholders to be distributed is calculated as 460
GBP in million, Mode is calculated as 573 GBP in millions and standard deviation is analysed as
156 GBP in millions.
EBITDA: the mean of EBITDA is calculated as 857 GBP in million for cumulative four
years. Collectively mode is calculated as 922 GBP in millions and standard deviation is analysed
as 167 GBP in millions combine for 2015 to 2019.
QUESTION 4
Effective MIS as an Important Part of Process of an Organisation
Yes, the statement presented about the importance of Management Information System in
the processes of every organisation is important. There are many reasons and benefits which are
provided by the Management Information System to the managers and companies and due to
which it becomes important for them to make implementation of MIS in their working.
Management Information System can be defined as the computer based system that provides the
managers with the tools and procedures to organise, evaluated and efficiently manager
departments within the organisation (Cadle, Paul and Turner, 2014). The business environment is
8
Paraphrase This Document
Need a fresh take? Get an instant paraphrase of this document with our AI Paraphraser

very dynamic environment in which the situations changes very rapidly and the transformations
also takes place very fast. These uncertainties and risks associated with the business
organisations and in the business environment impacts differently on the business organisations.
So with the help of Management Information System it will be possible for the organisation to
make complicated situations which cannot be removed. MIS helps in analysing the situations at
an earlier base and with the help of this, it becomes possible for them to analyse and prepare
themselves in order to deal with the prevailing situations in the market. One of the primary goals
of an organisation is related to make improvement in the profitability and long term
sustainability of organisation in the market and this could be done only with the help of good
strategies and policies and decisions of the organisation. This increases the importance for the
company to make proper evaluation of the future conditions and situations that could be
confronted by the organisation (Eberlein and et. al, 2014). In addition to this, it also becomes
important for the organisation to consider the impact of those circumstances on the working of
the organisation so that there impacts could be decreased on the working of the organisation to
some extent. This could be done with the help of Management Information System that provides
the organisation as this system provides the company with the ways so that the managers could
formulate effective strategies being in time in order to deal with the situation that could be
confronted by the organisation in the near future.
Another reason of the implementation of Management Information System in the
organisation is related to the working of this system with the people, organisations, technology
and relationships among the people and the organisations impacting upon the organisation. It
means to say that with the proper implementation of Management Information System in the
working of the company, it will become possible for the company to achieve higher level of
efficiency and effectiveness in the organisation and also from the work performed by their
employees. Regardless of whether the organisation whether it is focusing on marketing, financial
issue or operational issue, manager makes good and quick decisions in order to access to the
information so that they could make good and effective decisions that could be best in the
interest of the organisation as well as their employees (Forsgren and Johanson, 2014). Overall it
can also be said that it helps in making improvement in the organisation's profitability and
productivity level that could help the company in achieving the peaks of success.
9
With the help of Management Information System it will be possible for the company
and their managers to get access and information about the company in the central location that
can be easily accessed by managers over a period of time that have the same information and
hence they will be able to make decision at the quickest and also with the consent of other people
in the organisation also. It also helps the mangers for the data collection that could prove to be
useful for the organisations in getting the access to the data in a short period of time. There are
many situations in which the call for several inputs comes from the individual or departments
before the decisions are made. As in the absence of effective communication channel, it will not
be possible for the managers to make effective decisions sue to the low level of communication.
But with the help of good communication channel, it will be possible for the organisation to
make effective decisions which are best in the interest of the organisation and employees as well
because of good and effective decision making which removes the problem of possible delay in
the decision making process (Greasley, 2017). In this way Management Information System
helps is very effective in the processes of an organisation.
CONCLUSION
From the above assignment it has been concluded that it is very important for the
organisations to properly analyse the sampling techniques and population that they have to make
at the time of conducting surveys in their organisation. In addition to this, both the primary and
secondary sources of data have their own benefits and drawbacks and looking upon these and
analysing own conditions and requirements the companies should make use of the data sources.
Lastly, the conclusion has been drawn about the Management Information System that plays an
important role in the success and growth of the organisation so that they could deal good with the
prevailing situations in the organisations.
10
⊘ This is a preview!⊘
Do you want full access?
Subscribe today to unlock all pages.
Trusted by 1+ million students worldwide
1 out of 13
Related Documents


Your All-in-One AI-Powered Toolkit for Academic Success.
+13062052269
info@desklib.com
Available 24*7 on WhatsApp / Email
![[object Object]](/_next/static/media/star-bottom.7253800d.svg)
Unlock your academic potential
Copyright © 2020–2026 A2Z Services. All Rights Reserved. Developed and managed by ZUCOL.