Kiwi Bank vs ASB Bank Qualitative Analysis
VerifiedAdded on 2019/09/30
|10
|2923
|220
Case Study
AI Summary
This case study provides a comprehensive qualitative analysis comparing the financial performance of Kiwi Bank and ASB Bank in New Zealand. It examines various aspects including stockholder's equity, profit and loss statements, comparative analysis of assets and liabilities, ratio analysis, and trend analysis. The study concludes that ASB Bank demonstrates a stronger financial position and better performance compared to Kiwi Bank based on the analyzed data. The analysis covers a five-year period, highlighting the trends and changes in key financial indicators for both banks.
Running head: QUALITATIVE ANALYSIS
KIWI BANK LIMITED & ASB Bank
Qualitative Analysis
Student Name:
Course work:
University:
KIWI BANK LIMITED & ASB Bank
Qualitative Analysis
Student Name:
Course work:
University:
Secure Best Marks with AI Grader
Need help grading? Try our AI Grader for instant feedback on your assignments.
QUALITATIVE ANALYSIS 1
Introduction
In this present paper, we will do the comparative analysis of two banks of New Zealand.
Namely, Kiwi Bank limited, and ASB Bank limited. The Qualitative analysis of both the banks is
done on the basis of Quantitative analysis. The qualitative analysis is defined as the evaluation of
performance on the basis of available information. The analysis uses subjective judgment which
is based on the unquantifiable information.
The kiwi bank limited is the complete subsidiary of State-owned enterprise New Zealand post
limited. The bank is owned by the government of New Zealand and the board of director of the
bank was Jim Bolger who is the president of New Zealand, and present chairman is Rob
Morrison (Deakins et al., 2015). The post office bank was started in 1867 then the post bank is
sold to ANZ in the year 1989. The bank is originated from Alliance party which is the term of
the Labour-led coalition government. The branches of banks are increased from 16 to 301. The
banks have 51 percent shareholding in the homes loans of New Zealand. The ASB Bank is
owned by the Commonwealth Bank of Australia. The bank provides various financial services
such as business, funds management, retail, and rural banking. The banks are having long term
relationship with Sanders design which is an Auckland branding design studio. The bank is
known for its innovative technologies.
Qualitative Analysis of Kiwi Bank
1. Stockholder’s Equity
It is calculated by reducing the total liabilities from the total assets. It can also be
determined by adding the share capital and retained earning minus treasury shares. The
QUALITATIVE ANALYSIS 2
total equity of the company in the past five is very poor. The shareholder's equity is highly
decreased in the year 2012 by 81,272% from the previous year 2011. Then in the year
2013, the equity is increased by 14.85%. In the year 2014, the equity is increased by
16.8%, but in the year 2015, the performance remains the same. The shareholder's equity in
the year 2016 is increased by 9.29% from the previous year 2015 which shows the financial
position of the company is average not satisfactory (Adgei‐Frimpong et al., 2014).
2. Statement of Profit & Loss
The net profit after tax in the year 2012 is decreased by 276% from the previous year 2011.
The net profit in the year 2013 is increased by 25.31% from the previous year 2012. The
net profit in the year 2014 is increased by 3% from the previous year 2013. The net profit
in the year 2015 is increased by 27% from the previous year 2015. The net profit is
decreased by 2.41% in the year 2016 from the previous year 2015 which shows that the
company is unable to generate high profits. Thus, the financial position is not satisfactory.
3. Comparative Analysis
The assets side of the balance sheet shows total assets which comprise of current assets and
fixed assets. The net loans and advances are increased in the year 2016 by 1.39% from the
previous year 2015. The cash and short-term funds are increased by 3.36% in the year 2016
from the previous year 2015. The investment securities are decreased by 35% in the year
2016 from the previous year 2015. The fixed assets are increased by 9.09% in the year
2016 from the previous year 2015. In the liability side, the retail deposits are increased by
4% in the year 2016 from the year 2015. The wholesale deposits, total deposits are
increased and other liabilities and provisions are decreased by 9.77% (Salmona et al.,
2015).
QUALITATIVE ANALYSIS 3
4. Ratio Analysis
The return on equity is decreased in the year 2016 by 8.8% from the previous year 2015
which shows the company is unable to generate profits for the investors and currently the
net income of the company is unable to make profits. The earning trend of the company is
negative, and company's progress is also downwards. The operating expenses ratio in the
year 2016 is increased by 4.42% from the previous year 2015 which shows that the
operating expenses of the company are increasing and the profit margin is decreasing. The
total income of the company is decreased by 2.47% which shows the financial position of
the company is unstable, and the company is unable to generate profits. The profit margin
is decreased by 1.12% in the year 2016 from the previous year 2015. The asset utilization is
also decreased by 13.5% in the year 2016 from the previous year 2015 which shows the
company is unable to generate profits by utilizing the assets. The net loans are decreased by
0.98%, and specific loans are decreased by 60% which shows the loans are decreased in the
year 2016 from the previous year 2015 (Heuser et al., 2015)
5. Trend Analysis
The trend analysis of bank income statement shows that the other income is decreased in
the year 2016 by 8.57% which shows that the income received from other sources are
decreased. The net incomes interest of the company is decreased by 4.04% in the year 2016
from the previous year 2015 which shows the interest earned on the net income is
decreased. The net profit after tax is decreased by 10.6% which shows the profit is reduced
thus it reflects the financial position of the company is not satisfactory.
Secure Best Marks with AI Grader
Need help grading? Try our AI Grader for instant feedback on your assignments.
QUALITATIVE ANALYSIS 4
Qualitative Analysis of ASB Bank
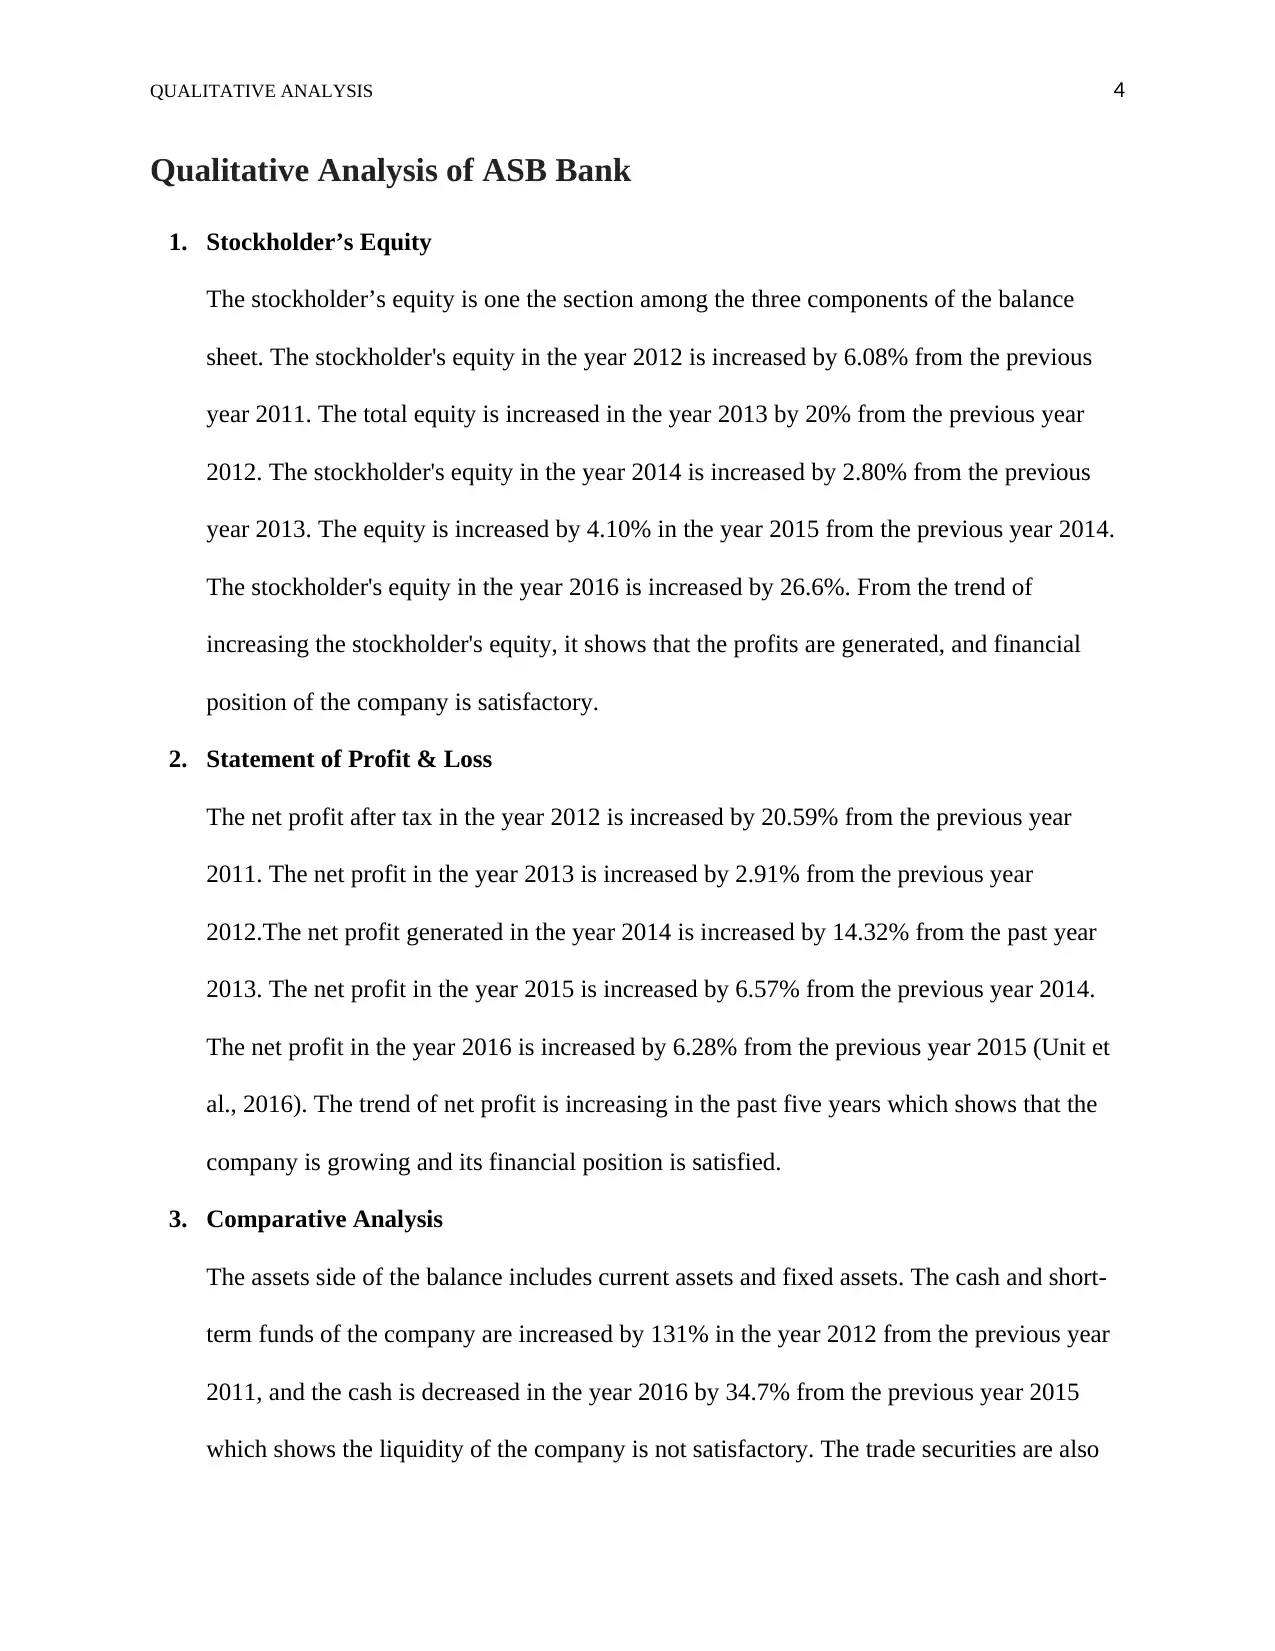
1. Stockholder’s Equity
The stockholder’s equity is one the section among the three components of the balance
sheet. The stockholder's equity in the year 2012 is increased by 6.08% from the previous
year 2011. The total equity is increased in the year 2013 by 20% from the previous year
2012. The stockholder's equity in the year 2014 is increased by 2.80% from the previous
year 2013. The equity is increased by 4.10% in the year 2015 from the previous year 2014.
The stockholder's equity in the year 2016 is increased by 26.6%. From the trend of
increasing the stockholder's equity, it shows that the profits are generated, and financial
position of the company is satisfactory.
2. Statement of Profit & Loss
The net profit after tax in the year 2012 is increased by 20.59% from the previous year
2011. The net profit in the year 2013 is increased by 2.91% from the previous year
2012.The net profit generated in the year 2014 is increased by 14.32% from the past year
2013. The net profit in the year 2015 is increased by 6.57% from the previous year 2014.
The net profit in the year 2016 is increased by 6.28% from the previous year 2015 (Unit et
al., 2016). The trend of net profit is increasing in the past five years which shows that the
company is growing and its financial position is satisfied.
3. Comparative Analysis
The assets side of the balance includes current assets and fixed assets. The cash and short-
term funds of the company are increased by 131% in the year 2012 from the previous year
2011, and the cash is decreased in the year 2016 by 34.7% from the previous year 2015
which shows the liquidity of the company is not satisfactory. The trade securities are also
Qualitative Analysis of ASB Bank
1. Stockholder’s Equity
The stockholder’s equity is one the section among the three components of the balance
sheet. The stockholder's equity in the year 2012 is increased by 6.08% from the previous
year 2011. The total equity is increased in the year 2013 by 20% from the previous year
2012. The stockholder's equity in the year 2014 is increased by 2.80% from the previous
year 2013. The equity is increased by 4.10% in the year 2015 from the previous year 2014.
The stockholder's equity in the year 2016 is increased by 26.6%. From the trend of
increasing the stockholder's equity, it shows that the profits are generated, and financial
position of the company is satisfactory.
2. Statement of Profit & Loss
The net profit after tax in the year 2012 is increased by 20.59% from the previous year
2011. The net profit in the year 2013 is increased by 2.91% from the previous year
2012.The net profit generated in the year 2014 is increased by 14.32% from the past year
2013. The net profit in the year 2015 is increased by 6.57% from the previous year 2014.
The net profit in the year 2016 is increased by 6.28% from the previous year 2015 (Unit et
al., 2016). The trend of net profit is increasing in the past five years which shows that the
company is growing and its financial position is satisfied.
3. Comparative Analysis
The assets side of the balance includes current assets and fixed assets. The cash and short-
term funds of the company are increased by 131% in the year 2012 from the previous year
2011, and the cash is decreased in the year 2016 by 34.7% from the previous year 2015
which shows the liquidity of the company is not satisfactory. The trade securities are also
QUALITATIVE ANALYSIS 5
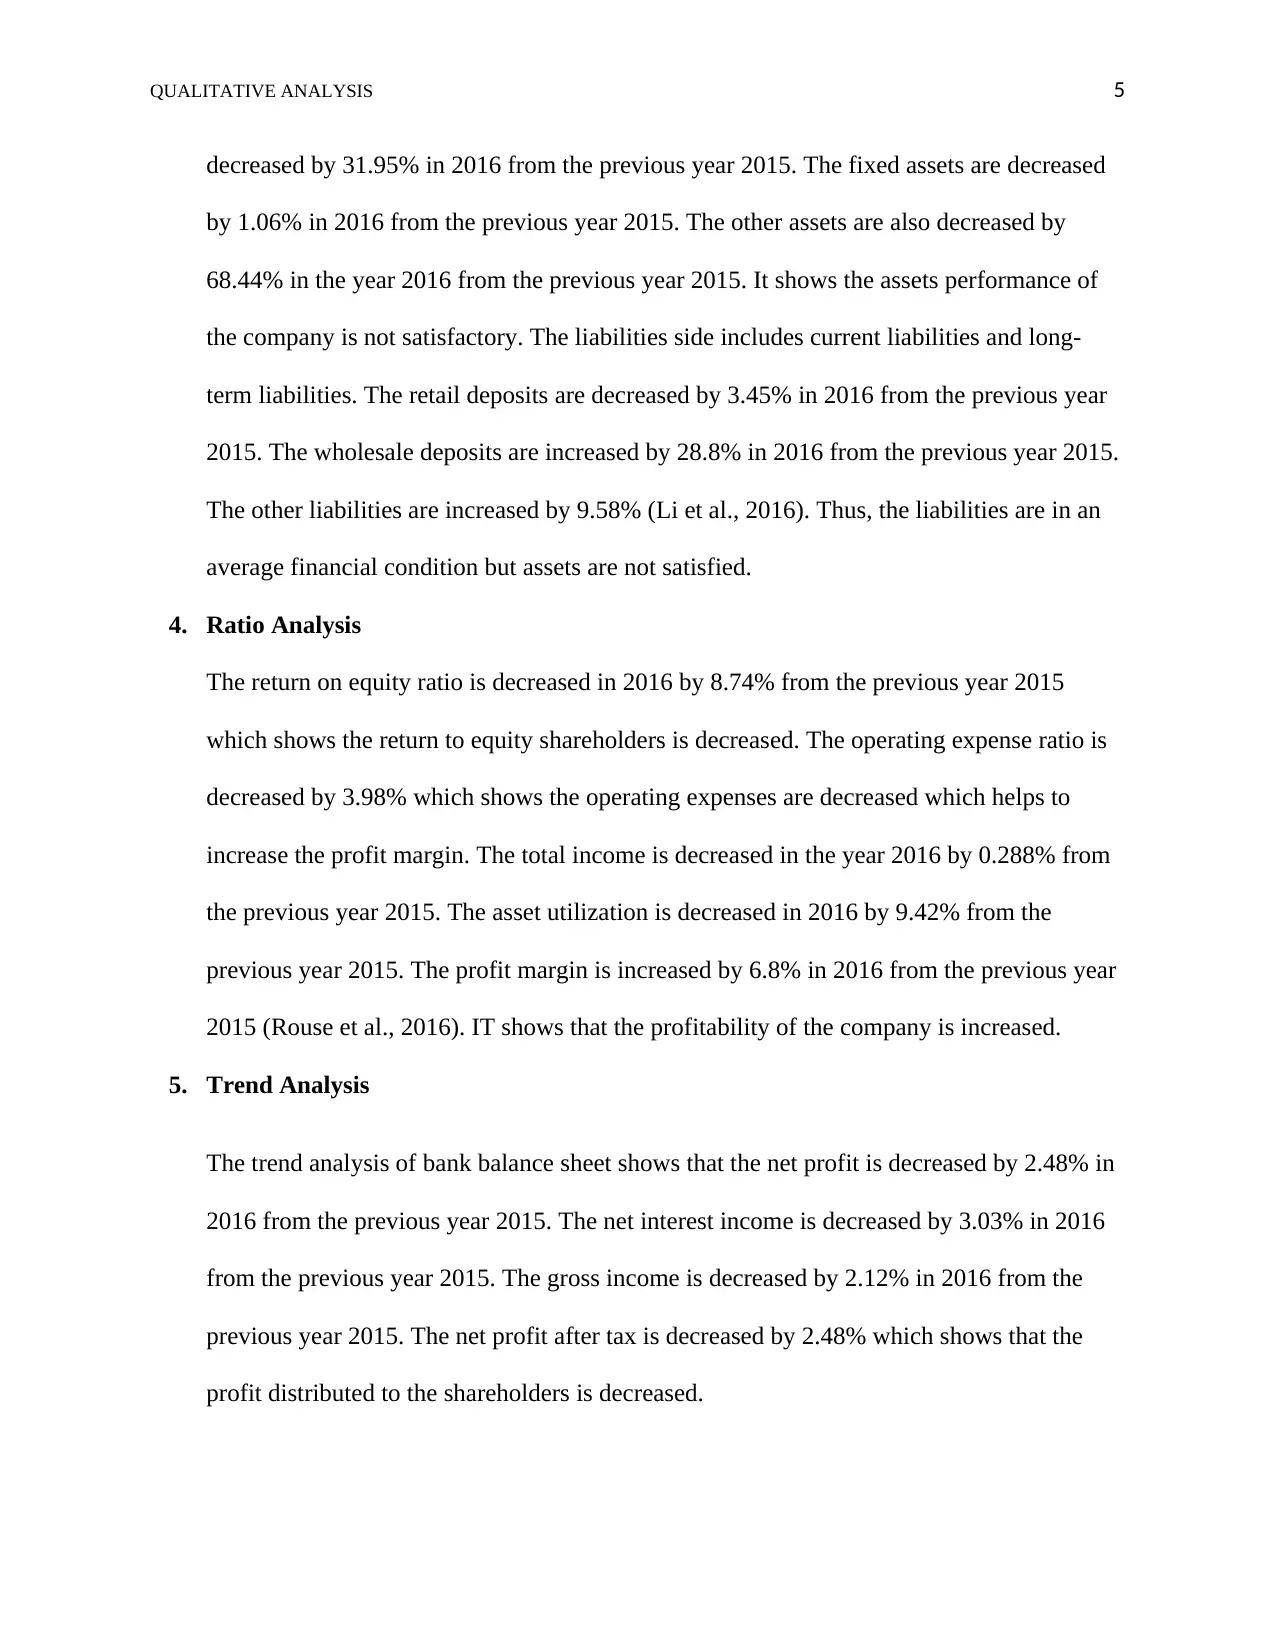
decreased by 31.95% in 2016 from the previous year 2015. The fixed assets are decreased
by 1.06% in 2016 from the previous year 2015. The other assets are also decreased by
68.44% in the year 2016 from the previous year 2015. It shows the assets performance of
the company is not satisfactory. The liabilities side includes current liabilities and long-
term liabilities. The retail deposits are decreased by 3.45% in 2016 from the previous year
2015. The wholesale deposits are increased by 28.8% in 2016 from the previous year 2015.
The other liabilities are increased by 9.58% (Li et al., 2016). Thus, the liabilities are in an
average financial condition but assets are not satisfied.
4. Ratio Analysis
The return on equity ratio is decreased in 2016 by 8.74% from the previous year 2015
which shows the return to equity shareholders is decreased. The operating expense ratio is
decreased by 3.98% which shows the operating expenses are decreased which helps to
increase the profit margin. The total income is decreased in the year 2016 by 0.288% from
the previous year 2015. The asset utilization is decreased in 2016 by 9.42% from the
previous year 2015. The profit margin is increased by 6.8% in 2016 from the previous year
2015 (Rouse et al., 2016). IT shows that the profitability of the company is increased.
5. Trend Analysis
The trend analysis of bank balance sheet shows that the net profit is decreased by 2.48% in
2016 from the previous year 2015. The net interest income is decreased by 3.03% in 2016
from the previous year 2015. The gross income is decreased by 2.12% in 2016 from the
previous year 2015. The net profit after tax is decreased by 2.48% which shows that the
profit distributed to the shareholders is decreased.
QUALITATIVE ANALYSIS 6
Comparative Analysis
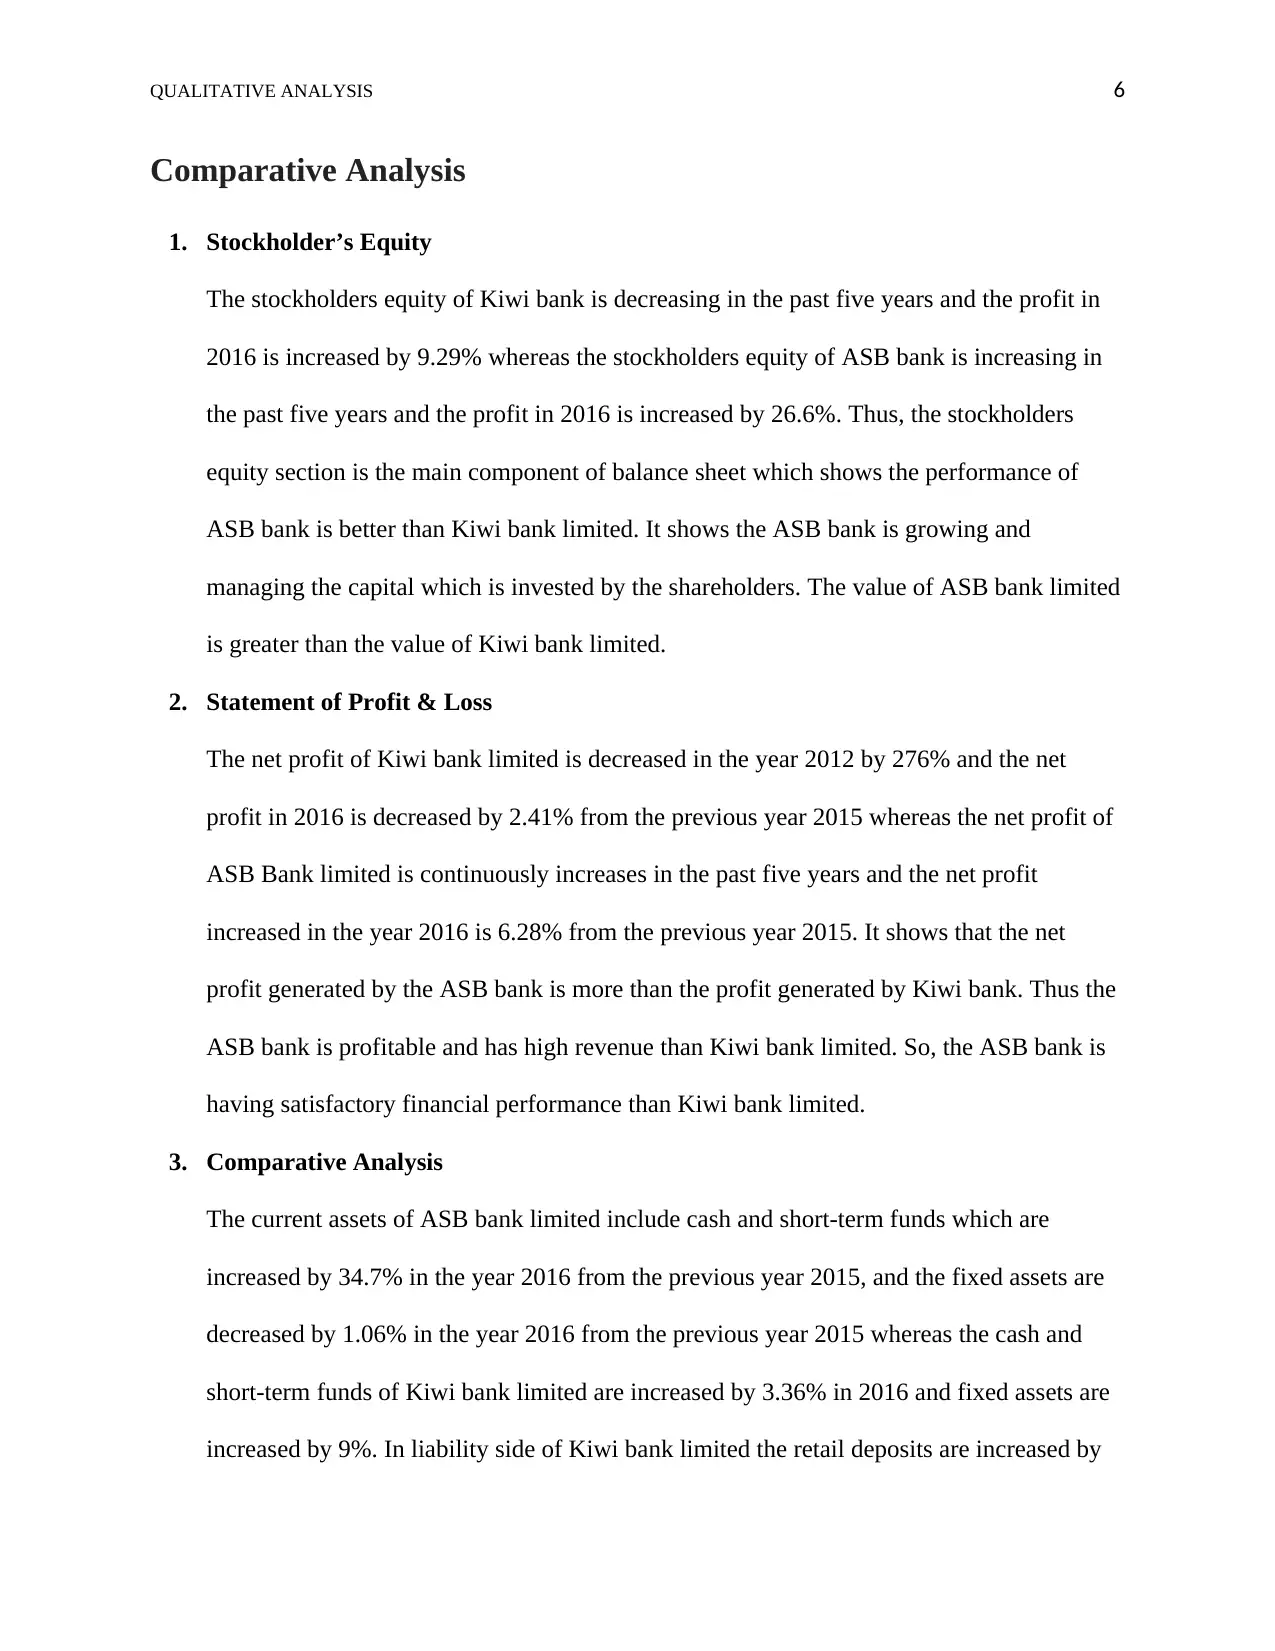
1. Stockholder’s Equity
The stockholders equity of Kiwi bank is decreasing in the past five years and the profit in
2016 is increased by 9.29% whereas the stockholders equity of ASB bank is increasing in
the past five years and the profit in 2016 is increased by 26.6%. Thus, the stockholders
equity section is the main component of balance sheet which shows the performance of
ASB bank is better than Kiwi bank limited. It shows the ASB bank is growing and
managing the capital which is invested by the shareholders. The value of ASB bank limited
is greater than the value of Kiwi bank limited.
2. Statement of Profit & Loss
The net profit of Kiwi bank limited is decreased in the year 2012 by 276% and the net
profit in 2016 is decreased by 2.41% from the previous year 2015 whereas the net profit of
ASB Bank limited is continuously increases in the past five years and the net profit
increased in the year 2016 is 6.28% from the previous year 2015. It shows that the net
profit generated by the ASB bank is more than the profit generated by Kiwi bank. Thus the
ASB bank is profitable and has high revenue than Kiwi bank limited. So, the ASB bank is
having satisfactory financial performance than Kiwi bank limited.
3. Comparative Analysis
The current assets of ASB bank limited include cash and short-term funds which are
increased by 34.7% in the year 2016 from the previous year 2015, and the fixed assets are
decreased by 1.06% in the year 2016 from the previous year 2015 whereas the cash and
short-term funds of Kiwi bank limited are increased by 3.36% in 2016 and fixed assets are
increased by 9%. In liability side of Kiwi bank limited the retail deposits are increased by
Comparative Analysis
1. Stockholder’s Equity
The stockholders equity of Kiwi bank is decreasing in the past five years and the profit in
2016 is increased by 9.29% whereas the stockholders equity of ASB bank is increasing in
the past five years and the profit in 2016 is increased by 26.6%. Thus, the stockholders
equity section is the main component of balance sheet which shows the performance of
ASB bank is better than Kiwi bank limited. It shows the ASB bank is growing and
managing the capital which is invested by the shareholders. The value of ASB bank limited
is greater than the value of Kiwi bank limited.
2. Statement of Profit & Loss
The net profit of Kiwi bank limited is decreased in the year 2012 by 276% and the net
profit in 2016 is decreased by 2.41% from the previous year 2015 whereas the net profit of
ASB Bank limited is continuously increases in the past five years and the net profit
increased in the year 2016 is 6.28% from the previous year 2015. It shows that the net
profit generated by the ASB bank is more than the profit generated by Kiwi bank. Thus the
ASB bank is profitable and has high revenue than Kiwi bank limited. So, the ASB bank is
having satisfactory financial performance than Kiwi bank limited.
3. Comparative Analysis
The current assets of ASB bank limited include cash and short-term funds which are
increased by 34.7% in the year 2016 from the previous year 2015, and the fixed assets are
decreased by 1.06% in the year 2016 from the previous year 2015 whereas the cash and
short-term funds of Kiwi bank limited are increased by 3.36% in 2016 and fixed assets are
increased by 9%. In liability side of Kiwi bank limited the retail deposits are increased by
Paraphrase This Document
Need a fresh take? Get an instant paraphrase of this document with our AI Paraphraser
QUALITATIVE ANALYSIS 7
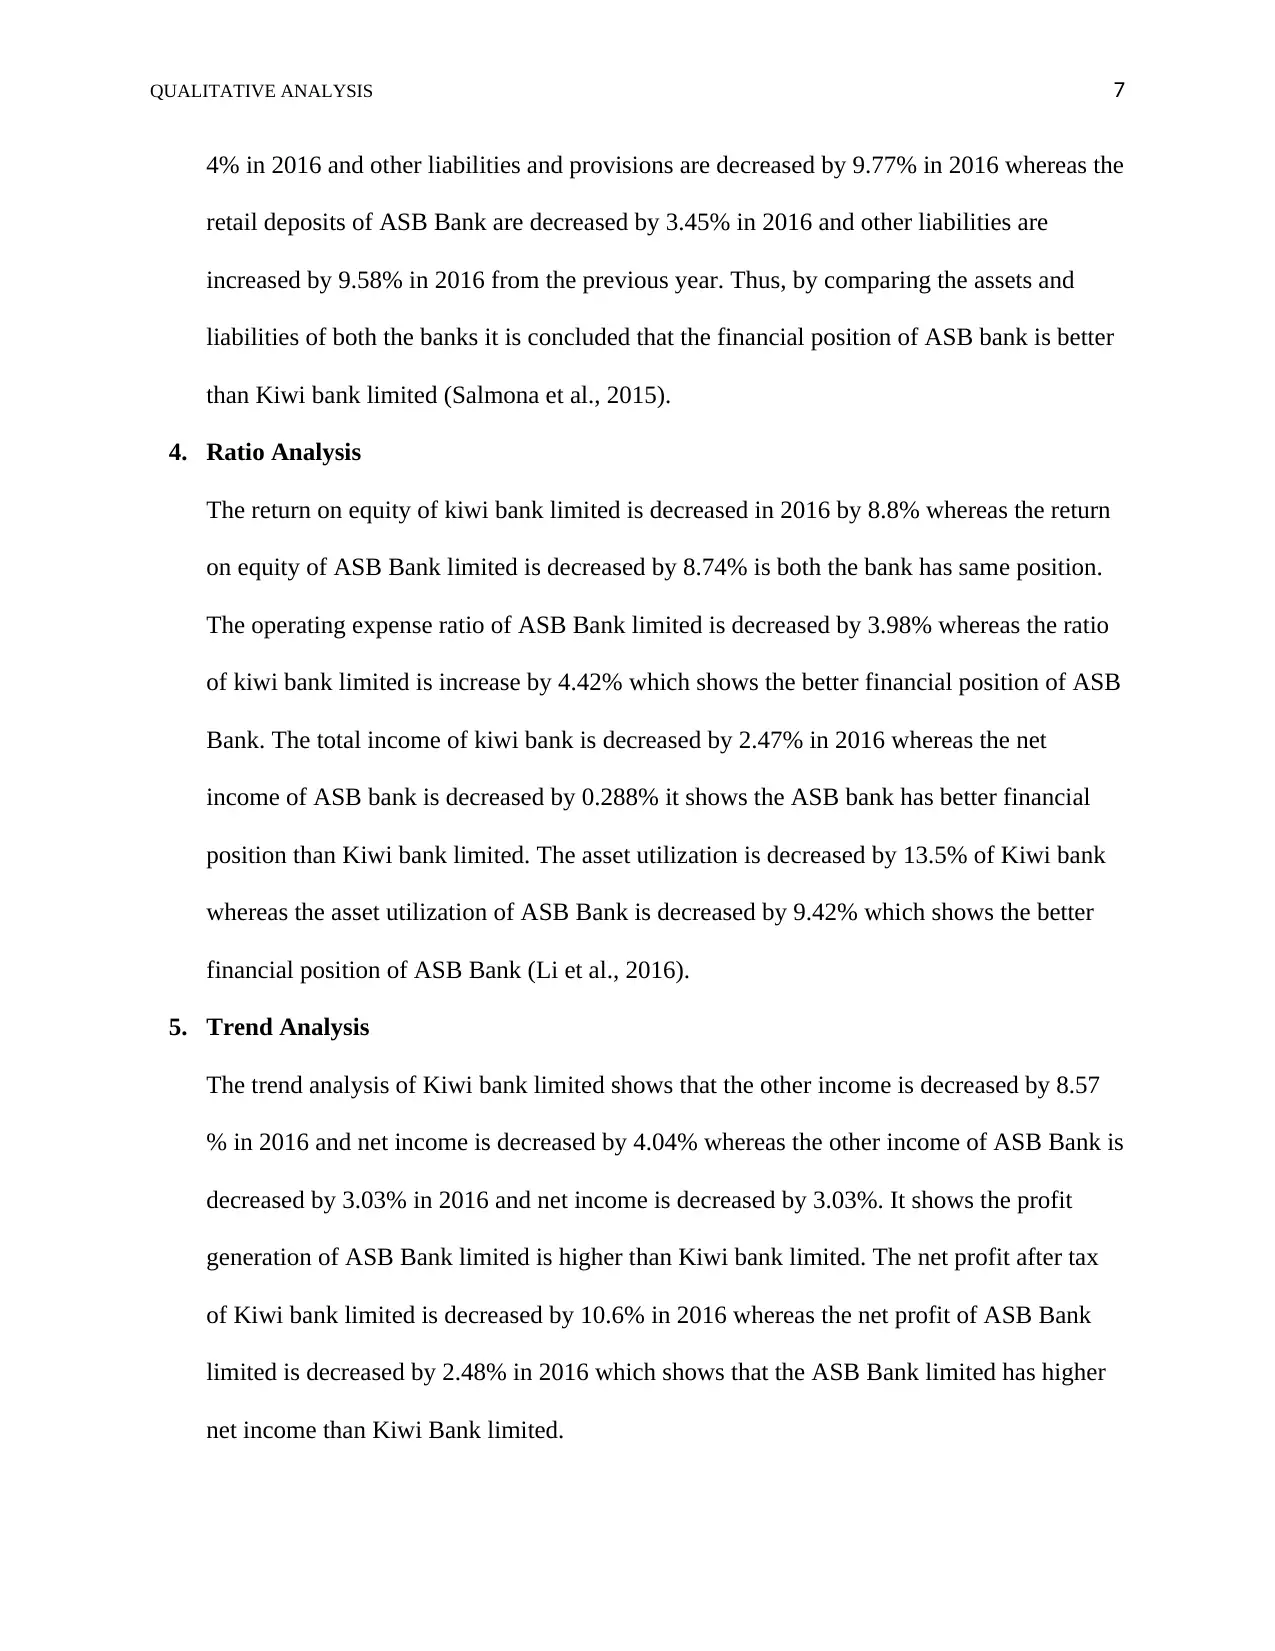
4% in 2016 and other liabilities and provisions are decreased by 9.77% in 2016 whereas the
retail deposits of ASB Bank are decreased by 3.45% in 2016 and other liabilities are
increased by 9.58% in 2016 from the previous year. Thus, by comparing the assets and
liabilities of both the banks it is concluded that the financial position of ASB bank is better
than Kiwi bank limited (Salmona et al., 2015).
4. Ratio Analysis
The return on equity of kiwi bank limited is decreased in 2016 by 8.8% whereas the return
on equity of ASB Bank limited is decreased by 8.74% is both the bank has same position.
The operating expense ratio of ASB Bank limited is decreased by 3.98% whereas the ratio
of kiwi bank limited is increase by 4.42% which shows the better financial position of ASB
Bank. The total income of kiwi bank is decreased by 2.47% in 2016 whereas the net
income of ASB bank is decreased by 0.288% it shows the ASB bank has better financial
position than Kiwi bank limited. The asset utilization is decreased by 13.5% of Kiwi bank
whereas the asset utilization of ASB Bank is decreased by 9.42% which shows the better
financial position of ASB Bank (Li et al., 2016).
5. Trend Analysis
The trend analysis of Kiwi bank limited shows that the other income is decreased by 8.57
% in 2016 and net income is decreased by 4.04% whereas the other income of ASB Bank is
decreased by 3.03% in 2016 and net income is decreased by 3.03%. It shows the profit
generation of ASB Bank limited is higher than Kiwi bank limited. The net profit after tax
of Kiwi bank limited is decreased by 10.6% in 2016 whereas the net profit of ASB Bank
limited is decreased by 2.48% in 2016 which shows that the ASB Bank limited has higher
net income than Kiwi Bank limited.
QUALITATIVE ANALYSIS 8
Conclusion
There is a financial performance comparison between the two banks of the New Zealand,
namely, ASB Bank and Kiwi Bank limited. Kiwi bank limited is a subsidiary of New Zealand
post limited and the bank is owned by the government whereas the ASB Bank is owned by the
commonwealth bank of Australia. According to the stockholders equity section, the ASB is
performing better than the Kiwi bank because the stockholders equity of ASB bank is increased
in the past five years and the increase in stockholders equity in 2016 is – and the stockholders
equity of kiwi bank is increased by 9.29% in 2016. The statement of profit & loss analysis shows
that the net profit is decreased by 2.41% in 2016 and the net profit of ASB Bank limited is
increased by 6.28% in 2016 which shows the ASB Bank is generating higher profits than Kiwi
bank limited. The comparative analysis of Kiwi bank shows that the liquidity is very low and
fixed assets are increased by 9.09% whereas the ASB Bank has average liquidity and fixed assets
are decreased by 1.06% in 2016. The liability side Kiwi bank shows that the retail deposits are
decreased by 4% in 2016 and other liabilities and provisions are decreased by 9.77% whereas the
retail deposits of ASB Bank limited has decreased by 3.45% and other liabilities are increased by
9.58%. It shows the financial position of ASB Bank is in favor. The ratio analysis includes the
analysis of return on equity which is same of banks, profit margin and assets utilization. The
asset utilization of ASB bank is higher than Kiwi bank which shows the performance of ASB
Bank is satisfactory. The trend analysis of both the banks shows that the net income of ASB
Bank is higher than the Kiwi bank limited. Thus, from qualitative analysis of banks it is proved
that ASB Bank is performing better than the Kiwi bank limited.
QUALITATIVE ANALYSIS 9
References
Deakins, D. (2015). Entrepreneurial finance in New Zealand. Research Handbook on
Entrepreneurial Finance, 27.
Adgei‐Frimpong, K., Gan, C., Ying, L., & Cohen, D. (2014). Efficiency and productivity change
in the banking industry: empirical evidence from New Zealand banks. Lincoln University.
Faculty of Commerce. Department of Accounting, Economics and Finance..
Salmona, M., Kaczynski, D., & Smith, T. (2015). Qualitative theory in finance: Theory into
practice. Australian Journal of Management, 40(3), 403-413.
Unit, F. I. (2016). Submission.
Li, X., Tripe, D. W., & Malone, C. B. (2016). Measuring Bank Risk: An Exploration of Z-Score.
Available at SSRN 2823946.
Heuser, A., Kwok, J., Snethlage, D., & Watts, D. (2015). Review of the KiwiSaver Fund
Manager Market Dynamics and Allocation of Assets.
Rouse, P. P., & Tripe, D. (2016). Allocative and technical efficiency of New Zealand Banks.
Meditari Accountancy Research, 24(4).
1 out of 10
Related Documents


Your All-in-One AI-Powered Toolkit for Academic Success.
+13062052269
info@desklib.com
Available 24*7 on WhatsApp / Email
![[object Object]](/_next/static/media/star-bottom.7253800d.svg)
Unlock your academic potential
© 2024 | Zucol Services PVT LTD | All rights reserved.