Corporate Finance Report: Investment Appraisal of ClearView Drug

Verified

Added on  2023/06/09

|7
|1439
|131
Report
AI Summary
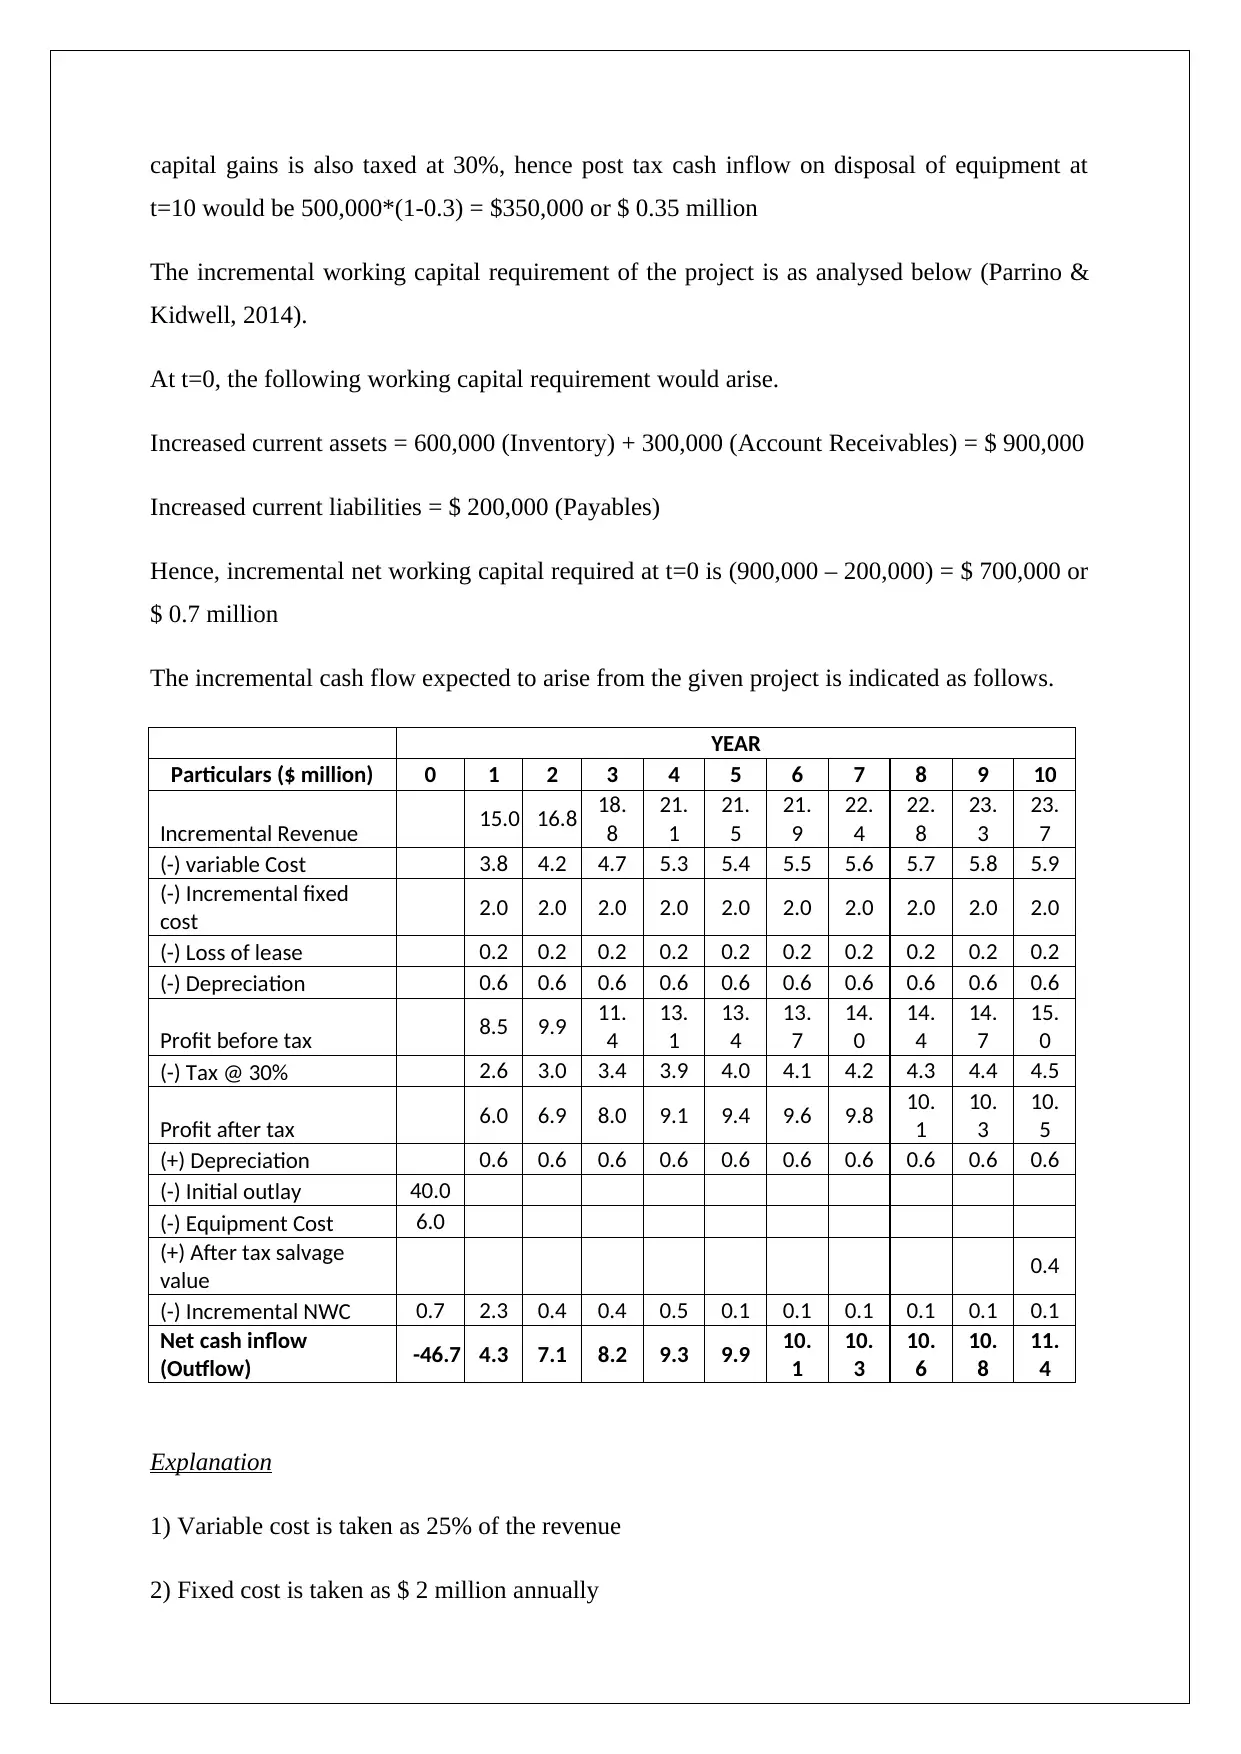
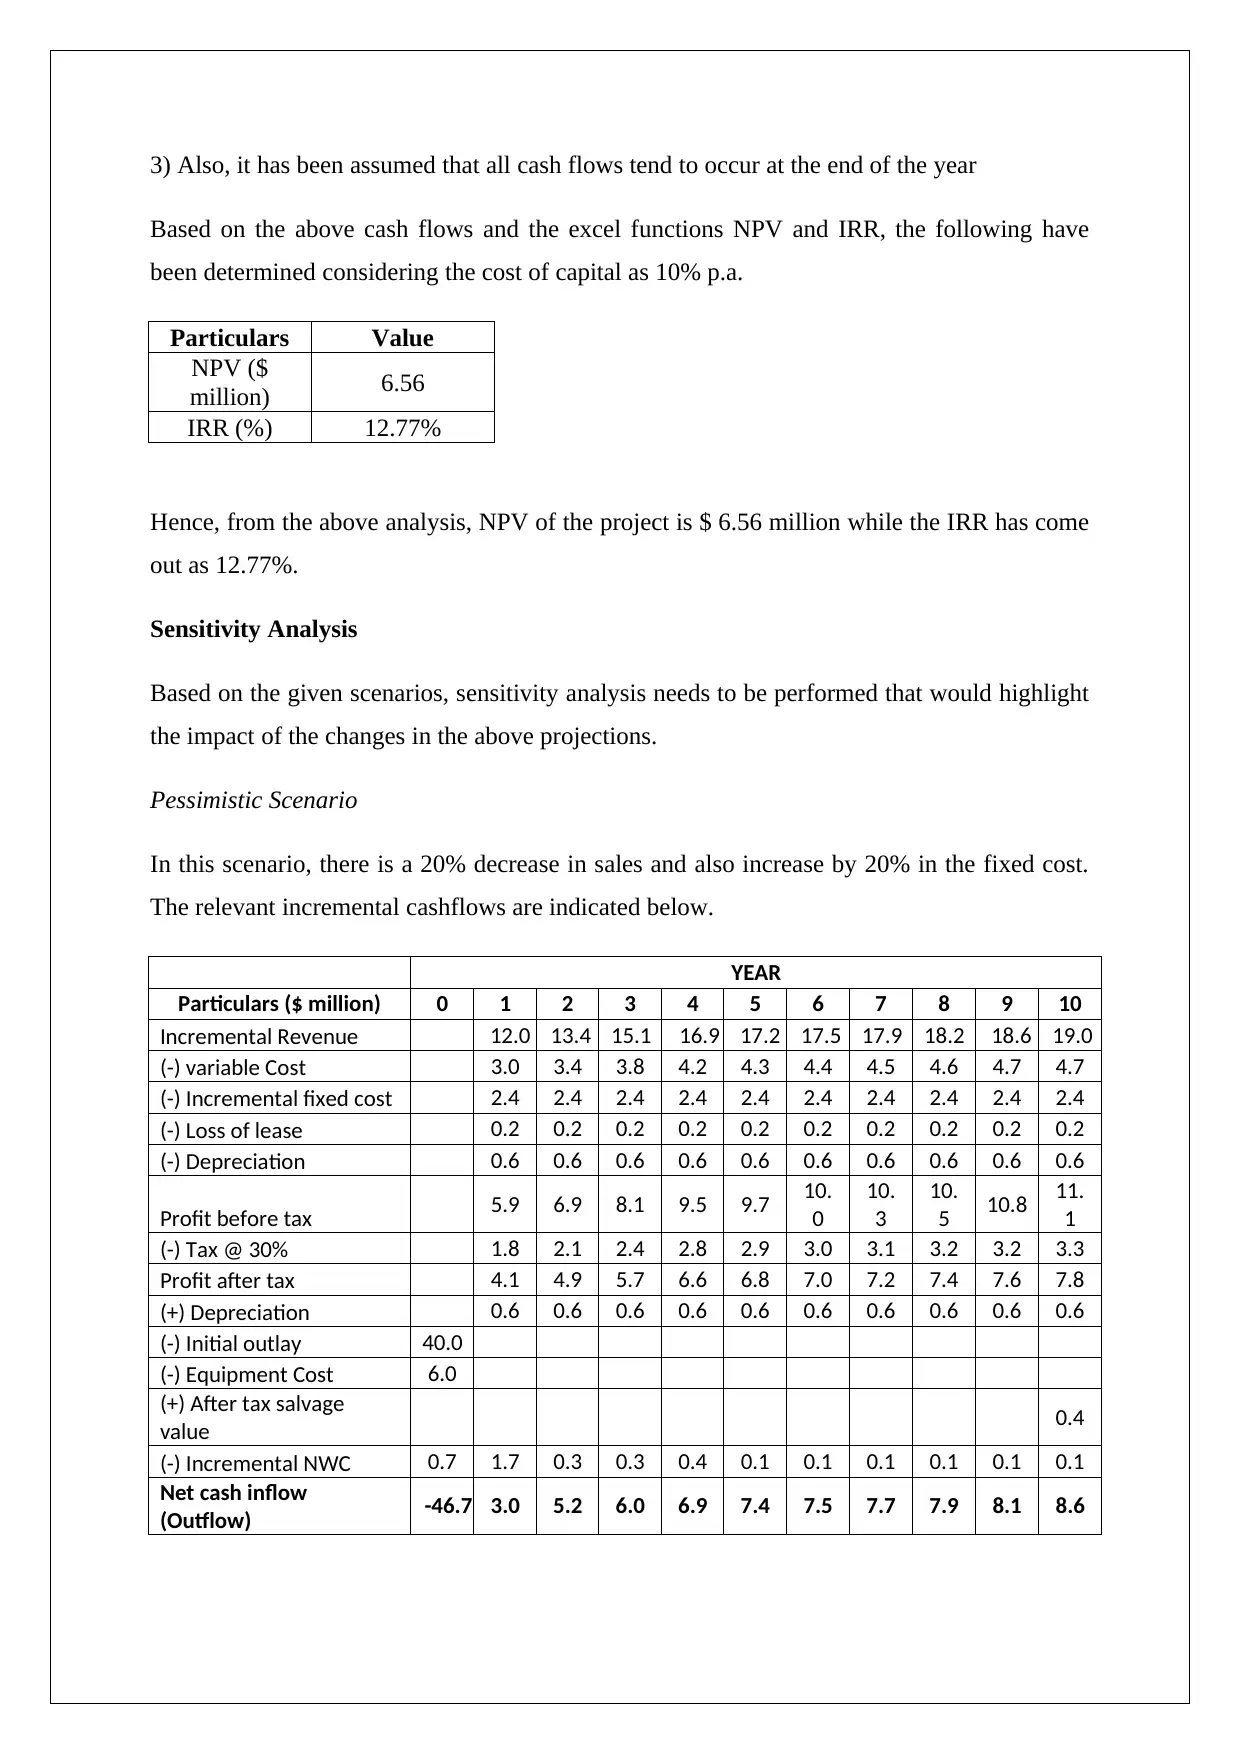
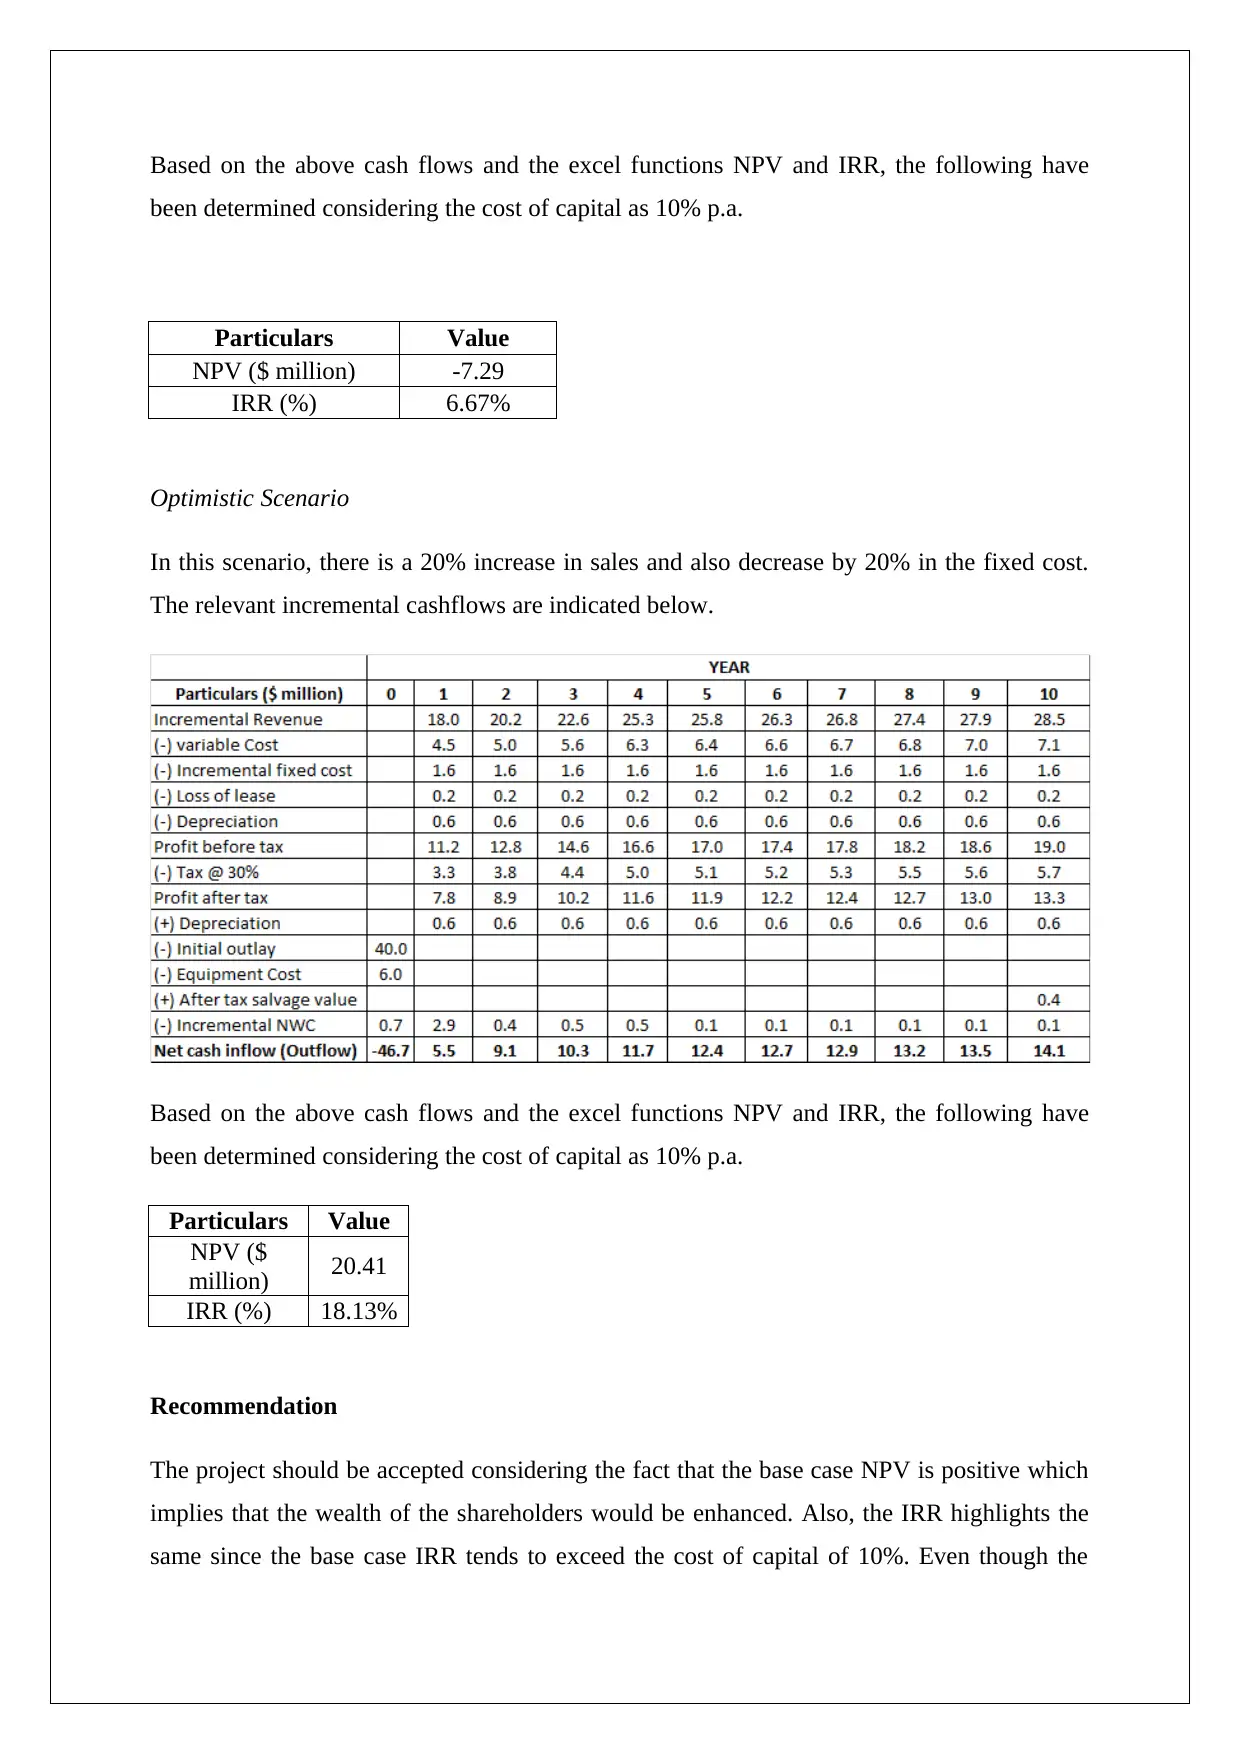
This report assesses Kline Pharmaceuticals' potential investment in a new myopia drug, ClearView, using capital budgeting techniques such as NPV and IRR. The analysis considers the initial outlay, including equipment costs and working capital requirements, along with incremental revenues, variable and fixed costs, and depreciation. A base-case scenario, along with pessimistic and optimistic scenarios, are analyzed through sensitivity analysis. The base case NPV is positive at $6.56 million with an IRR of 12.77%, suggesting the project is viable. The pessimistic scenario shows a negative NPV, while the optimistic scenario shows a higher positive NPV. The report concludes with a recommendation to accept the project based on the positive base-case NPV, indicating enhanced shareholder wealth. Desklib provides access to similar solved assignments and past papers for students.
Document Page
CORPORATE FINANCE
STUDENT ID:
[Pick the date]
tabler-icon-diamond-filled.svg

Paraphrase This Document

Need a fresh take? Get an instant paraphrase of this document with our AI Paraphraser
Document Page
Introduction
Based on the given information, it is apparent that Kline Pharmaceuticals (KP) intends to
bring a new drug to the market which is meant to a cure of myopia. In this light, the objective
of this report is to consider the incremental cash flows related to the introduction of this drug
and using suitable capital budgeting techniques determine whether the shareholders’ wealth
of the company would be enhanced or not with the drug introduction. On the basis of the
analysis, recommendation would be offered regarding the introduction of the revolutionary
drug.
NPV & IRR Analysis
The initial outlay incurred at t=0 is captured below.
It is expected that the useful life of the project would be for 10 years as this is the duration of
the patent on the new drug. Also, it is known that the manufacturing of the drug would be
carried out at an unused plant which KP owns. The opportunity cost related to this use if $
150000 per annum considering the fact that if the project would not be implemented, the
plant would be leased at the above value and hence owing to the implementation of the
project, there would be a loss of cash inflows to the extent of $ 150,000 p.a. (Petty et. al.,
2015).
Additionally at t = 0, incremental cash outflow to the tune of $ 6 million would be required
on account of equipment. Even though at the end of the project, the equipment would have
salvage or residual value of $ 500,000, but the book value would be zero
Hence, depreciated value over 10 years = $ 6 million
Assuming straight line depreciation, annual depreciation expense = 6/10 = $ 0.6 million
Further, considering that the book value is zero and the selling price of the equipment after 10
years is expected to be $ 500,000, hence gain on sale of equipment would be realised which
would attract capital gains which ought to be taxed (Damodaran, 2015).. Assuming that
Document Page
capital gains is also taxed at 30%, hence post tax cash inflow on disposal of equipment at
t=10 would be 500,000*(1-0.3) = $350,000 or $ 0.35 million
The incremental working capital requirement of the project is as analysed below (Parrino &
Kidwell, 2014).
At t=0, the following working capital requirement would arise.
Increased current assets = 600,000 (Inventory) + 300,000 (Account Receivables) = $ 900,000
Increased current liabilities = $ 200,000 (Payables)
Hence, incremental net working capital required at t=0 is (900,000 – 200,000) = $ 700,000 or
$ 0.7 million
The incremental cash flow expected to arise from the given project is indicated as follows.
YEAR
Particulars ($ million) 0 1 2 3 4 5 6 7 8 9 10
Incremental Revenue 15.0 16.8 18.
8
21.
1
21.
5
21.
9
22.
4
22.
8
23.
3
23.
7
(-) variable Cost 3.8 4.2 4.7 5.3 5.4 5.5 5.6 5.7 5.8 5.9
(-) Incremental fixed
cost 2.0 2.0 2.0 2.0 2.0 2.0 2.0 2.0 2.0 2.0
(-) Loss of lease 0.2 0.2 0.2 0.2 0.2 0.2 0.2 0.2 0.2 0.2
(-) Depreciation 0.6 0.6 0.6 0.6 0.6 0.6 0.6 0.6 0.6 0.6
Profit before tax 8.5 9.9 11.
4
13.
1
13.
4
13.
7
14.
0
14.
4
14.
7
15.
0
(-) Tax @ 30% 2.6 3.0 3.4 3.9 4.0 4.1 4.2 4.3 4.4 4.5
Profit after tax 6.0 6.9 8.0 9.1 9.4 9.6 9.8 10.
1
10.
3
10.
5
(+) Depreciation 0.6 0.6 0.6 0.6 0.6 0.6 0.6 0.6 0.6 0.6
(-) Initial outlay 40.0
(-) Equipment Cost 6.0
(+) After tax salvage
value 0.4
(-) Incremental NWC 0.7 2.3 0.4 0.4 0.5 0.1 0.1 0.1 0.1 0.1 0.1
Net cash inflow
(Outflow) -46.7 4.3 7.1 8.2 9.3 9.9 10.
1
10.
3
10.
6
10.
8
11.
4
Explanation
1) Variable cost is taken as 25% of the revenue
2) Fixed cost is taken as $ 2 million annually
Document Page
3) Also, it has been assumed that all cash flows tend to occur at the end of the year
Based on the above cash flows and the excel functions NPV and IRR, the following have
been determined considering the cost of capital as 10% p.a.
Particulars Value
NPV ($
million) 6.56
IRR (%) 12.77%
Hence, from the above analysis, NPV of the project is $ 6.56 million while the IRR has come
out as 12.77%.
Sensitivity Analysis
Based on the given scenarios, sensitivity analysis needs to be performed that would highlight
the impact of the changes in the above projections.
Pessimistic Scenario
In this scenario, there is a 20% decrease in sales and also increase by 20% in the fixed cost.
The relevant incremental cashflows are indicated below.
YEAR
Particulars ($ million) 0 1 2 3 4 5 6 7 8 9 10
Incremental Revenue 12.0 13.4 15.1 16.9 17.2 17.5 17.9 18.2 18.6 19.0
(-) variable Cost 3.0 3.4 3.8 4.2 4.3 4.4 4.5 4.6 4.7 4.7
(-) Incremental fixed cost 2.4 2.4 2.4 2.4 2.4 2.4 2.4 2.4 2.4 2.4
(-) Loss of lease 0.2 0.2 0.2 0.2 0.2 0.2 0.2 0.2 0.2 0.2
(-) Depreciation 0.6 0.6 0.6 0.6 0.6 0.6 0.6 0.6 0.6 0.6
Profit before tax 5.9 6.9 8.1 9.5 9.7 10.
0
10.
3
10.
5 10.8 11.
1
(-) Tax @ 30% 1.8 2.1 2.4 2.8 2.9 3.0 3.1 3.2 3.2 3.3
Profit after tax 4.1 4.9 5.7 6.6 6.8 7.0 7.2 7.4 7.6 7.8
(+) Depreciation 0.6 0.6 0.6 0.6 0.6 0.6 0.6 0.6 0.6 0.6
(-) Initial outlay 40.0
(-) Equipment Cost 6.0
(+) After tax salvage
value 0.4
(-) Incremental NWC 0.7 1.7 0.3 0.3 0.4 0.1 0.1 0.1 0.1 0.1 0.1
Net cash inflow
(Outflow) -46.7 3.0 5.2 6.0 6.9 7.4 7.5 7.7 7.9 8.1 8.6
tabler-icon-diamond-filled.svg

Paraphrase This Document

Need a fresh take? Get an instant paraphrase of this document with our AI Paraphraser
Document Page
Based on the above cash flows and the excel functions NPV and IRR, the following have
been determined considering the cost of capital as 10% p.a.
Particulars Value
NPV ($ million) -7.29
IRR (%) 6.67%
Optimistic Scenario
In this scenario, there is a 20% increase in sales and also decrease by 20% in the fixed cost.
The relevant incremental cashflows are indicated below.
Based on the above cash flows and the excel functions NPV and IRR, the following have
been determined considering the cost of capital as 10% p.a.
Particulars Value
NPV ($
million) 20.41
IRR (%) 18.13%
Recommendation
The project should be accepted considering the fact that the base case NPV is positive which
implies that the wealth of the shareholders would be enhanced. Also, the IRR highlights the
same since the base case IRR tends to exceed the cost of capital of 10%. Even though the
Document Page
pessimistic case NPV and IRR reflect the non-feasibility of the project but if all the three
scenarios are equally likelihood, the NPV would be positive (Damodaran, 2015).
Document Page
References
Damodaran, A. (2015). Applied corporate finance: A user’s manual 3rd ed. New York:
Wiley, John & Sons.
Parrino, R. & Kidwell, D. (2014) Fundamentals of Corporate Finance, 3rd ed. London:
Wiley Publications
Petty, J.W., Titman, S., Keown, A., Martin, J.D., Martin, P., Burrow, M., & Nguyen, H. (2015).
Financial Management, Principles and Applications, 6th ed.. NSW: Pearson Education,
French Forest Australia
chevron_up_icon
1 out of 7
circle_padding
hide_on_mobile
zoom_out_icon
[object Object]