Financial Analysis of Kmart Corporation for April 2017 Quarter
VerifiedAdded on 2020/03/04
|9
|2161
|238
Report
AI Summary
This report presents a financial analysis of Kmart Corporation for the quarter ending April 2017, a subsidiary of Sears Holdings. The analysis, based on 37.37% of Sears Holdings' data, examines asset utilization, operating performance, liquidity, capital structure and solvency, and market performance. Key ratios, including goodwill to asset, interest expense to debt, investment turnover, and days of working capital, are calculated and compared to the previous year's quarter. The report highlights the impact of Kmart's restructuring program, including store closures and cost-cutting measures, on financial metrics such as gross profit margin, net income, and earnings per share. The analysis reveals challenges in liquidity, debt levels, and asset utilization, while also noting improvements in operating performance metrics. The conclusion emphasizes the company's financial instability due to restructuring and declining revenue, but anticipates improved performance as the program concludes.
Financial Analysis of Kmart Corporation
For the quarter ending April, 2017
For the quarter ending April, 2017
Paraphrase This Document
Need a fresh take? Get an instant paraphrase of this document with our AI Paraphraser
Contents
Introduction...........................................................................................................................................1
Financial Analysis...................................................................................................................................1
Asset Utilization Measurement.........................................................................................................2
Operating Performance Measurement..............................................................................................3
Liquidity Measurements....................................................................................................................4
Capital Structure and Solvency Measurements.................................................................................5
Market Performance Measurements................................................................................................6
Conclusion.............................................................................................................................................7
Bibliography...........................................................................................................................................7
Introduction
Kmart is a subsidiary of Sears Holding Corporation. Kmart operates a network of retail stores
offering a wide range of products which include toys, consumer electronics, food and
consumables, equipment for garden and lawns, apparel and in store pharmacy. The company
sells the above goods under brands like Craftsman, Jaclyn Smith, Joe and Boxer labels,
DieHard and Kenmore. There are approximately 735 Kmart stores (yahoo.finance, 2017)
across USA.
Financial Analysis
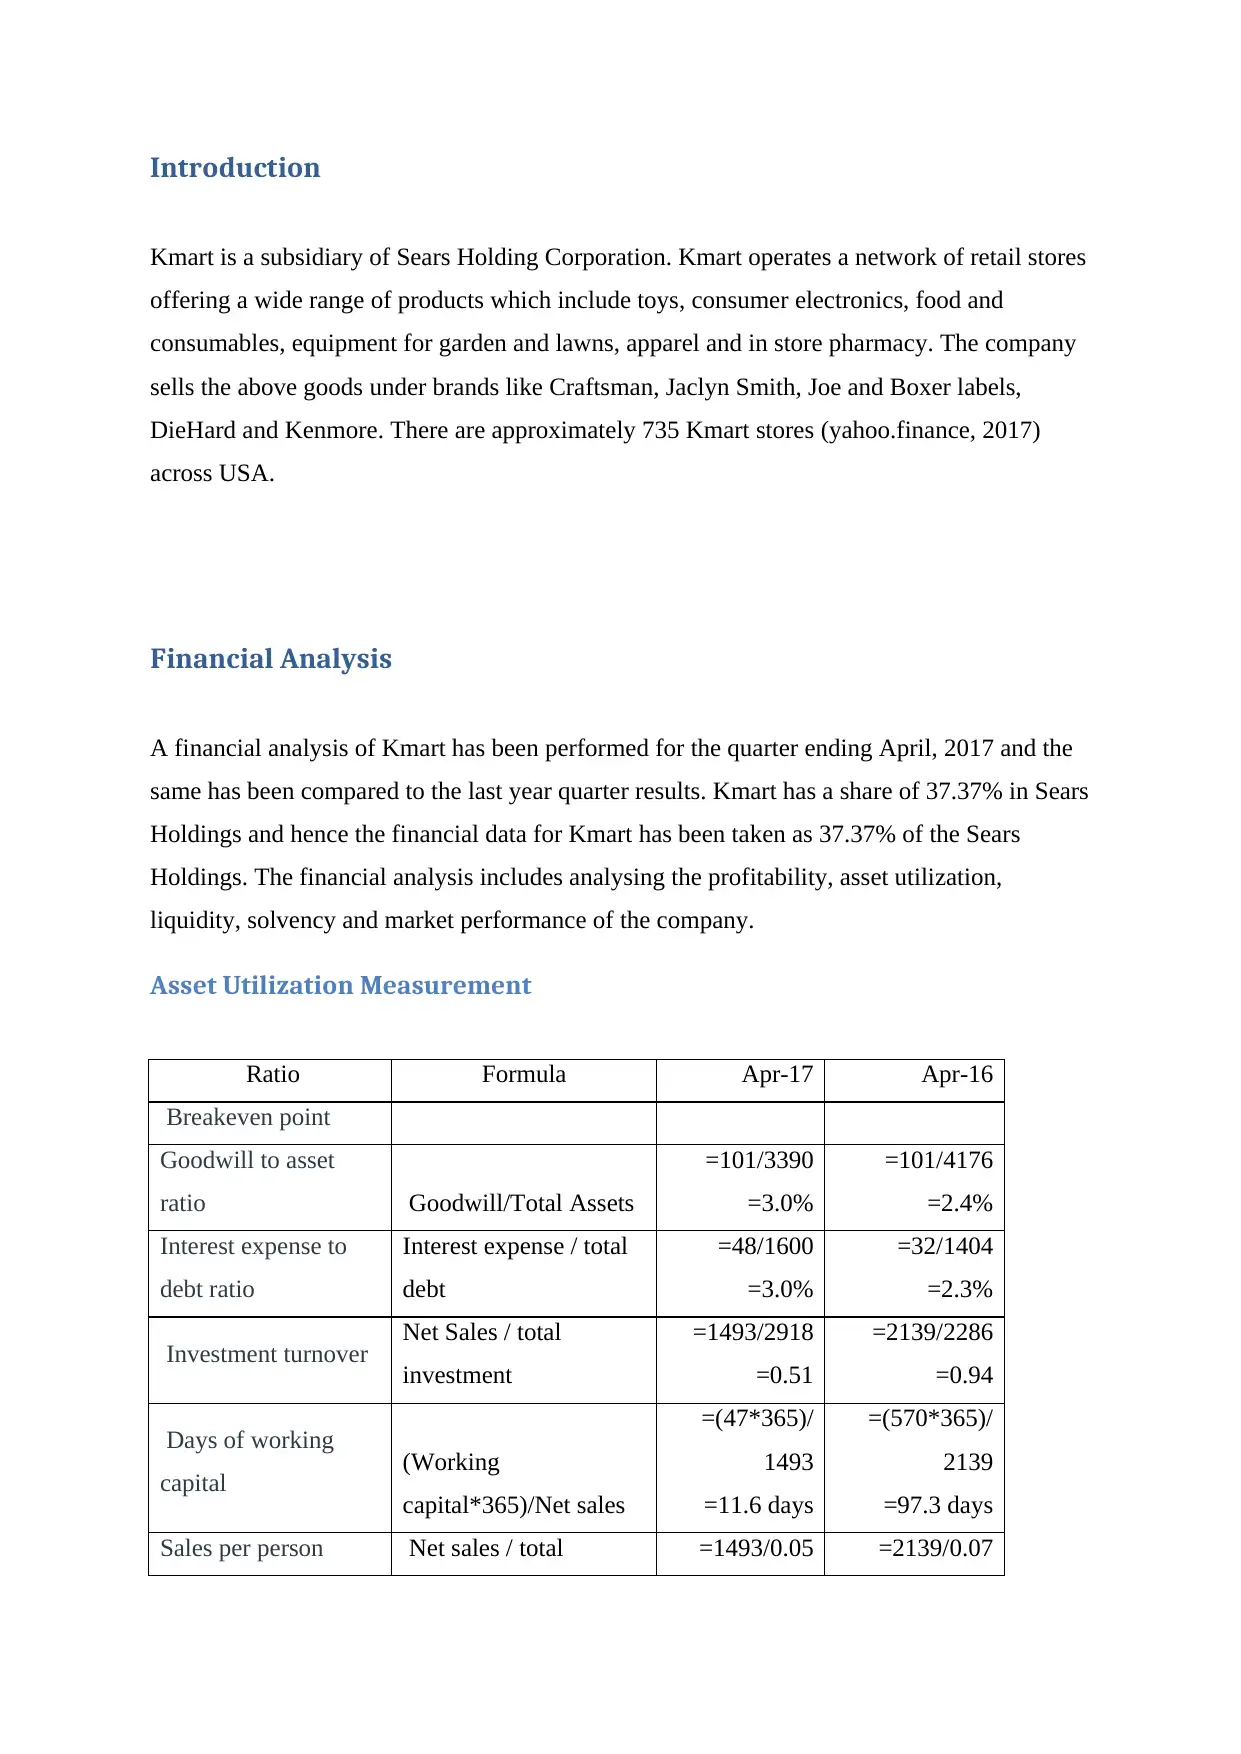
A financial analysis of Kmart has been performed for the quarter ending April, 2017 and the
same has been compared to the last year quarter results. Kmart has a share of 37.37% in Sears
Holdings and hence the financial data for Kmart has been taken as 37.37% of the Sears
Holdings. The financial analysis includes analysing the profitability, asset utilization,
liquidity, solvency and market performance of the company.
Asset Utilization Measurement
Ratio Formula Apr-17 Apr-16
Breakeven point
Goodwill to asset
ratio Goodwill/Total Assets
=101/3390
=3.0%
=101/4176
=2.4%
Interest expense to
debt ratio
Interest expense / total
debt
=48/1600
=3.0%
=32/1404
=2.3%
Investment turnover Net Sales / total
investment
=1493/2918
=0.51
=2139/2286
=0.94
Days of working
capital (Working
capital*365)/Net sales
=(47*365)/
1493
=11.6 days
=(570*365)/
2139
=97.3 days
Sales per person Net sales / total =1493/0.05 =2139/0.07
Kmart is a subsidiary of Sears Holding Corporation. Kmart operates a network of retail stores
offering a wide range of products which include toys, consumer electronics, food and
consumables, equipment for garden and lawns, apparel and in store pharmacy. The company
sells the above goods under brands like Craftsman, Jaclyn Smith, Joe and Boxer labels,
DieHard and Kenmore. There are approximately 735 Kmart stores (yahoo.finance, 2017)
across USA.
Financial Analysis
A financial analysis of Kmart has been performed for the quarter ending April, 2017 and the
same has been compared to the last year quarter results. Kmart has a share of 37.37% in Sears
Holdings and hence the financial data for Kmart has been taken as 37.37% of the Sears
Holdings. The financial analysis includes analysing the profitability, asset utilization,
liquidity, solvency and market performance of the company.
Asset Utilization Measurement
Ratio Formula Apr-17 Apr-16
Breakeven point
Goodwill to asset
ratio Goodwill/Total Assets
=101/3390
=3.0%
=101/4176
=2.4%
Interest expense to
debt ratio
Interest expense / total
debt
=48/1600
=3.0%
=32/1404
=2.3%
Investment turnover Net Sales / total
investment
=1493/2918
=0.51
=2139/2286
=0.94
Days of working
capital (Working
capital*365)/Net sales
=(47*365)/
1493
=11.6 days
=(570*365)/
2139
=97.3 days
Sales per person Net sales / total =1493/0.05 =2139/0.07
⊘ This is a preview!⊘
Do you want full access?
Subscribe today to unlock all pages.
Trusted by 1+ million students worldwide
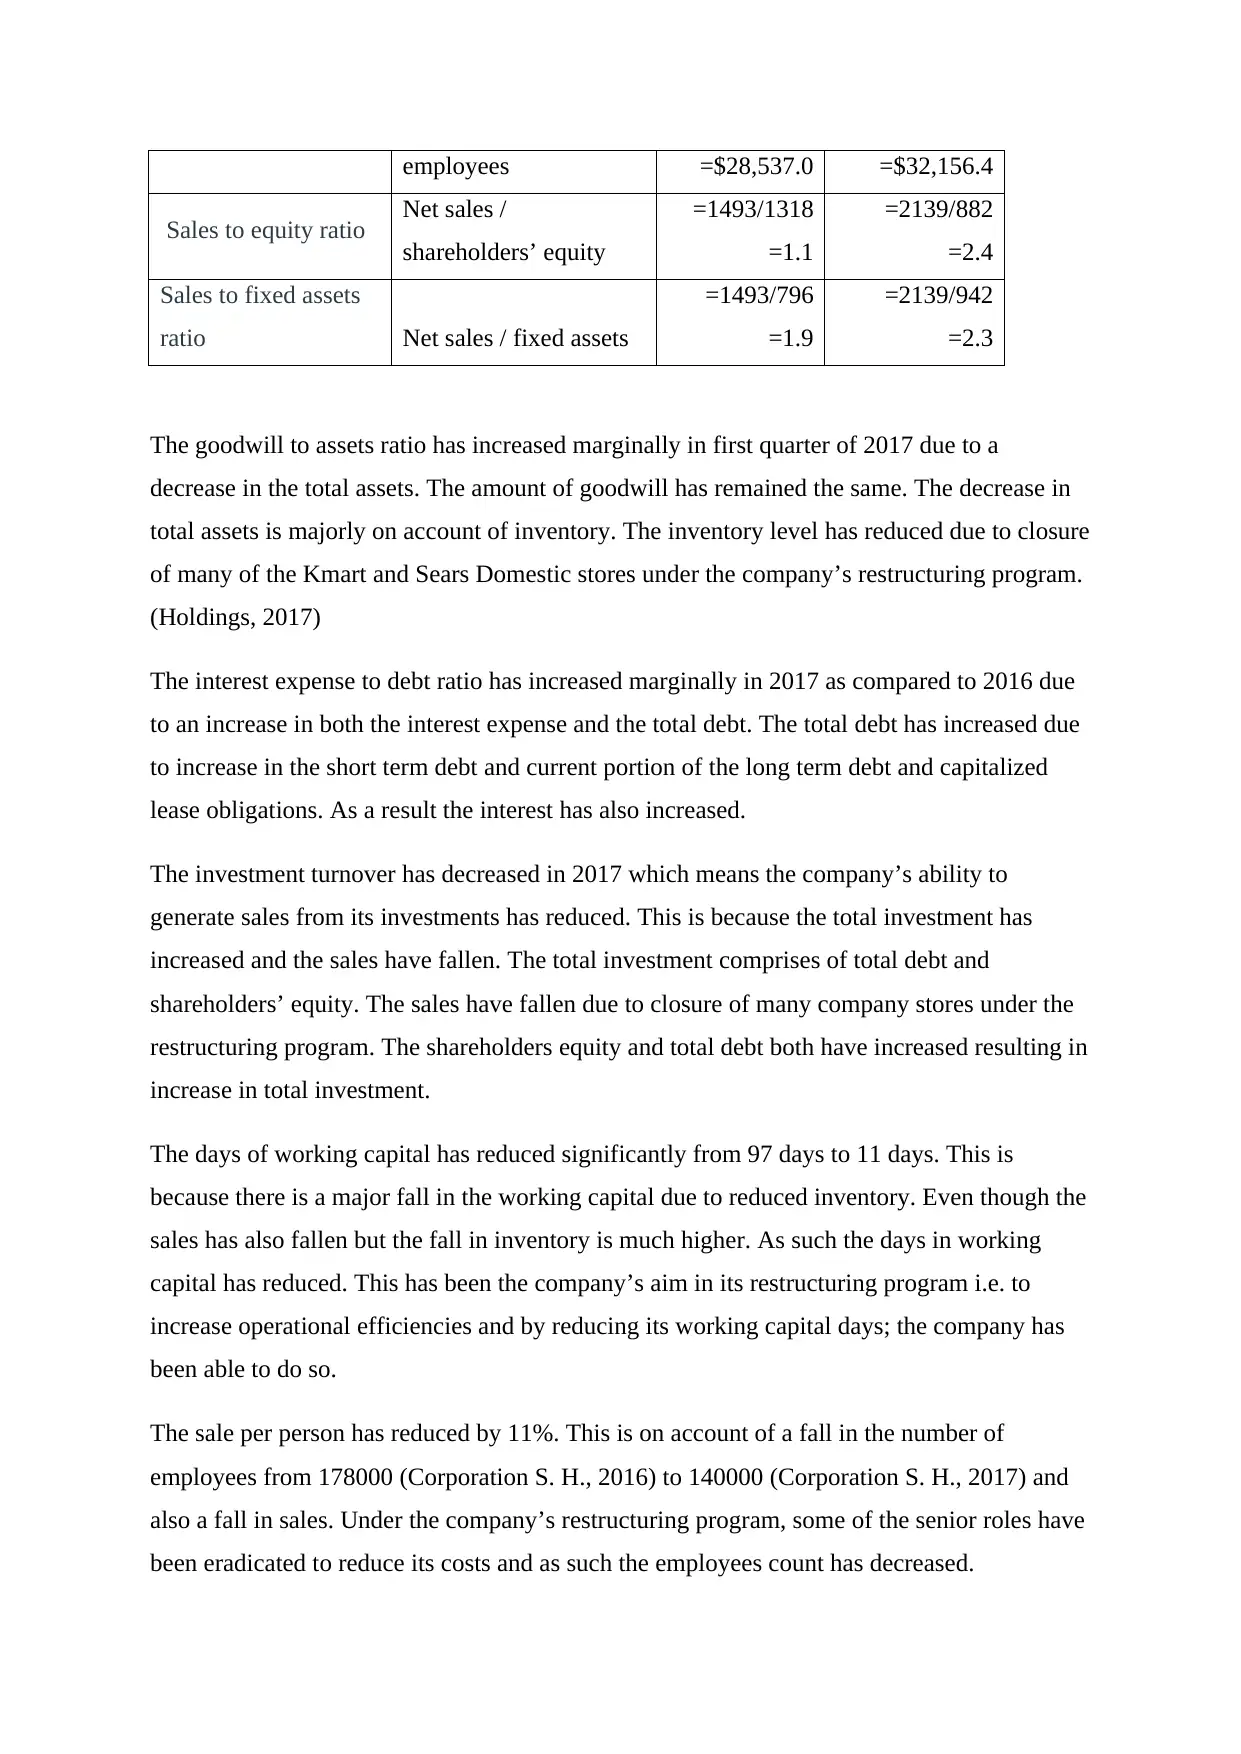
employees =$28,537.0 =$32,156.4
Sales to equity ratio Net sales /
shareholders’ equity
=1493/1318
=1.1
=2139/882
=2.4
Sales to fixed assets
ratio Net sales / fixed assets
=1493/796
=1.9
=2139/942
=2.3
The goodwill to assets ratio has increased marginally in first quarter of 2017 due to a
decrease in the total assets. The amount of goodwill has remained the same. The decrease in
total assets is majorly on account of inventory. The inventory level has reduced due to closure
of many of the Kmart and Sears Domestic stores under the company’s restructuring program.
(Holdings, 2017)
The interest expense to debt ratio has increased marginally in 2017 as compared to 2016 due
to an increase in both the interest expense and the total debt. The total debt has increased due
to increase in the short term debt and current portion of the long term debt and capitalized
lease obligations. As a result the interest has also increased.
The investment turnover has decreased in 2017 which means the company’s ability to
generate sales from its investments has reduced. This is because the total investment has
increased and the sales have fallen. The total investment comprises of total debt and
shareholders’ equity. The sales have fallen due to closure of many company stores under the
restructuring program. The shareholders equity and total debt both have increased resulting in
increase in total investment.
The days of working capital has reduced significantly from 97 days to 11 days. This is
because there is a major fall in the working capital due to reduced inventory. Even though the
sales has also fallen but the fall in inventory is much higher. As such the days in working
capital has reduced. This has been the company’s aim in its restructuring program i.e. to
increase operational efficiencies and by reducing its working capital days; the company has
been able to do so.
The sale per person has reduced by 11%. This is on account of a fall in the number of
employees from 178000 (Corporation S. H., 2016) to 140000 (Corporation S. H., 2017) and
also a fall in sales. Under the company’s restructuring program, some of the senior roles have
been eradicated to reduce its costs and as such the employees count has decreased.
Paraphrase This Document
Need a fresh take? Get an instant paraphrase of this document with our AI Paraphraser
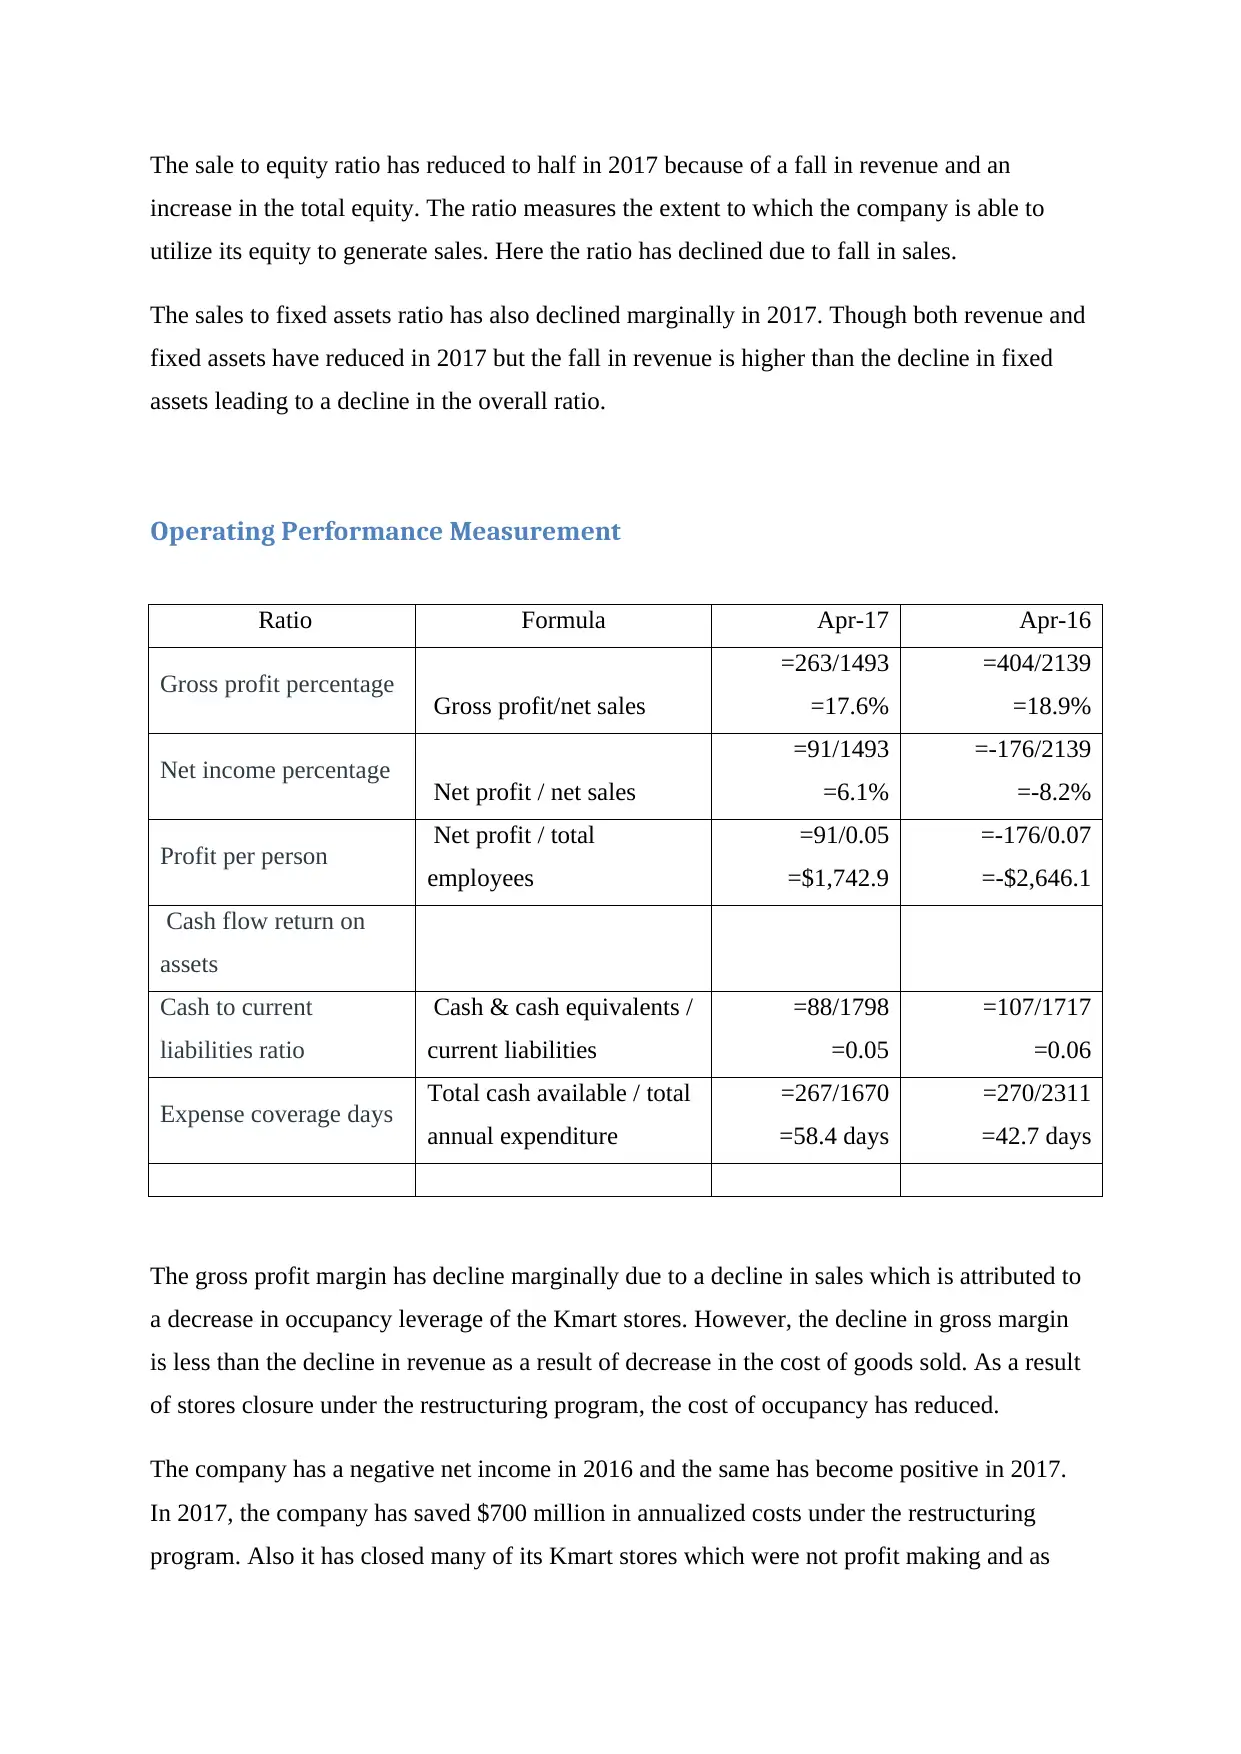
The sale to equity ratio has reduced to half in 2017 because of a fall in revenue and an
increase in the total equity. The ratio measures the extent to which the company is able to
utilize its equity to generate sales. Here the ratio has declined due to fall in sales.
The sales to fixed assets ratio has also declined marginally in 2017. Though both revenue and
fixed assets have reduced in 2017 but the fall in revenue is higher than the decline in fixed
assets leading to a decline in the overall ratio.
Operating Performance Measurement
Ratio Formula Apr-17 Apr-16
Gross profit percentage Gross profit/net sales
=263/1493
=17.6%
=404/2139
=18.9%
Net income percentage Net profit / net sales
=91/1493
=6.1%
=-176/2139
=-8.2%
Profit per person Net profit / total
employees
=91/0.05
=$1,742.9
=-176/0.07
=-$2,646.1
Cash flow return on
assets
Cash to current
liabilities ratio
Cash & cash equivalents /
current liabilities
=88/1798
=0.05
=107/1717
=0.06
Expense coverage days Total cash available / total
annual expenditure
=267/1670
=58.4 days
=270/2311
=42.7 days
The gross profit margin has decline marginally due to a decline in sales which is attributed to
a decrease in occupancy leverage of the Kmart stores. However, the decline in gross margin
is less than the decline in revenue as a result of decrease in the cost of goods sold. As a result
of stores closure under the restructuring program, the cost of occupancy has reduced.
The company has a negative net income in 2016 and the same has become positive in 2017.
In 2017, the company has saved $700 million in annualized costs under the restructuring
program. Also it has closed many of its Kmart stores which were not profit making and as
such there has been a gain on sale of assets. Hence savings in costs and gain on sale of assets
has led to an increase in net profit margin for the company even though the sales have
declined.
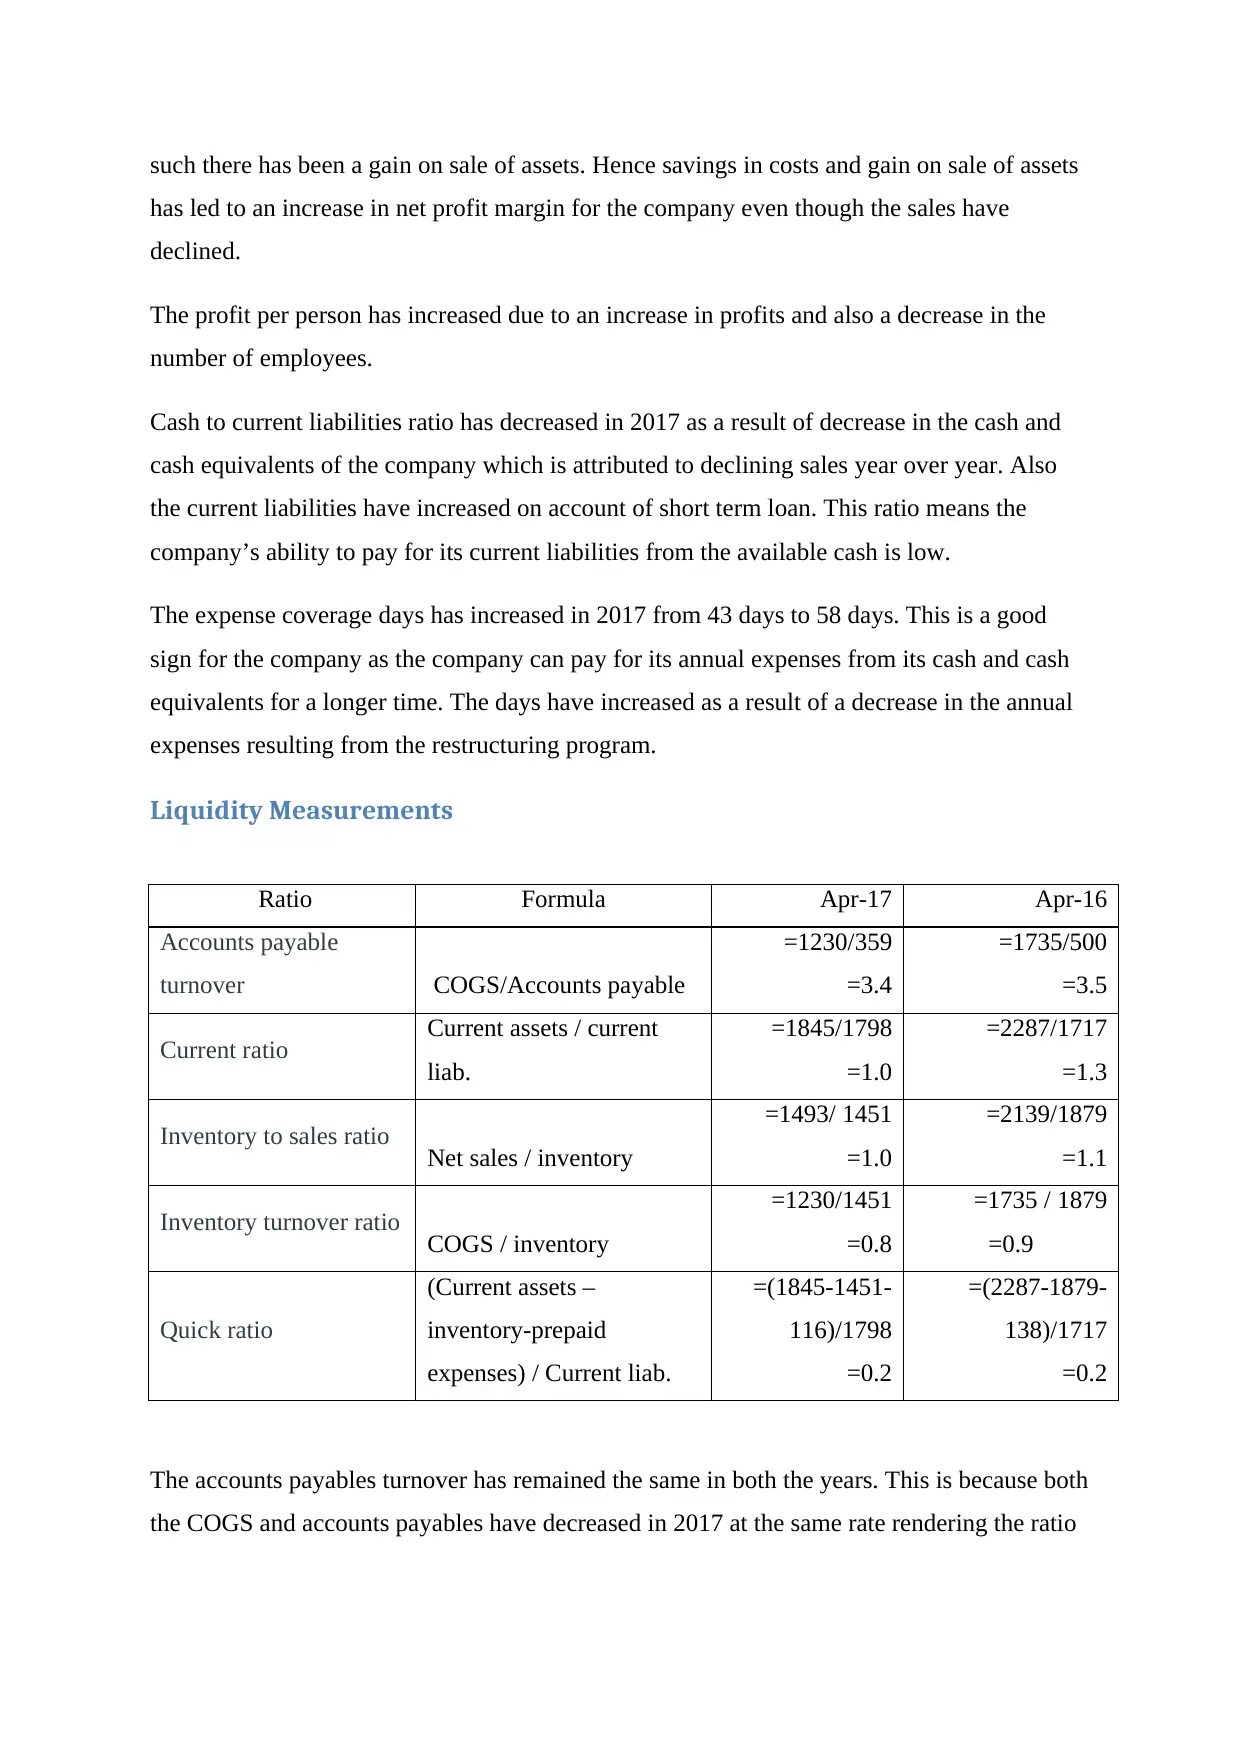
The profit per person has increased due to an increase in profits and also a decrease in the
number of employees.
Cash to current liabilities ratio has decreased in 2017 as a result of decrease in the cash and
cash equivalents of the company which is attributed to declining sales year over year. Also
the current liabilities have increased on account of short term loan. This ratio means the
company’s ability to pay for its current liabilities from the available cash is low.
The expense coverage days has increased in 2017 from 43 days to 58 days. This is a good
sign for the company as the company can pay for its annual expenses from its cash and cash
equivalents for a longer time. The days have increased as a result of a decrease in the annual
expenses resulting from the restructuring program.
Liquidity Measurements
Ratio Formula Apr-17 Apr-16
Accounts payable
turnover COGS/Accounts payable
=1230/359
=3.4
=1735/500
=3.5
Current ratio Current assets / current
liab.
=1845/1798
=1.0
=2287/1717
=1.3
Inventory to sales ratio Net sales / inventory
=1493/ 1451
=1.0
=2139/1879
=1.1
Inventory turnover ratio COGS / inventory
=1230/1451
=0.8
=1735 / 1879
=0.9
Quick ratio
(Current assets –
inventory-prepaid
expenses) / Current liab.
=(1845-1451-
116)/1798
=0.2
=(2287-1879-
138)/1717
=0.2
The accounts payables turnover has remained the same in both the years. This is because both
the COGS and accounts payables have decreased in 2017 at the same rate rendering the ratio
has led to an increase in net profit margin for the company even though the sales have
declined.
The profit per person has increased due to an increase in profits and also a decrease in the
number of employees.
Cash to current liabilities ratio has decreased in 2017 as a result of decrease in the cash and
cash equivalents of the company which is attributed to declining sales year over year. Also
the current liabilities have increased on account of short term loan. This ratio means the
company’s ability to pay for its current liabilities from the available cash is low.
The expense coverage days has increased in 2017 from 43 days to 58 days. This is a good
sign for the company as the company can pay for its annual expenses from its cash and cash
equivalents for a longer time. The days have increased as a result of a decrease in the annual
expenses resulting from the restructuring program.
Liquidity Measurements
Ratio Formula Apr-17 Apr-16
Accounts payable
turnover COGS/Accounts payable
=1230/359
=3.4
=1735/500
=3.5
Current ratio Current assets / current
liab.
=1845/1798
=1.0
=2287/1717
=1.3
Inventory to sales ratio Net sales / inventory
=1493/ 1451
=1.0
=2139/1879
=1.1
Inventory turnover ratio COGS / inventory
=1230/1451
=0.8
=1735 / 1879
=0.9
Quick ratio
(Current assets –
inventory-prepaid
expenses) / Current liab.
=(1845-1451-
116)/1798
=0.2
=(2287-1879-
138)/1717
=0.2
The accounts payables turnover has remained the same in both the years. This is because both
the COGS and accounts payables have decreased in 2017 at the same rate rendering the ratio
⊘ This is a preview!⊘
Do you want full access?
Subscribe today to unlock all pages.
Trusted by 1+ million students worldwide
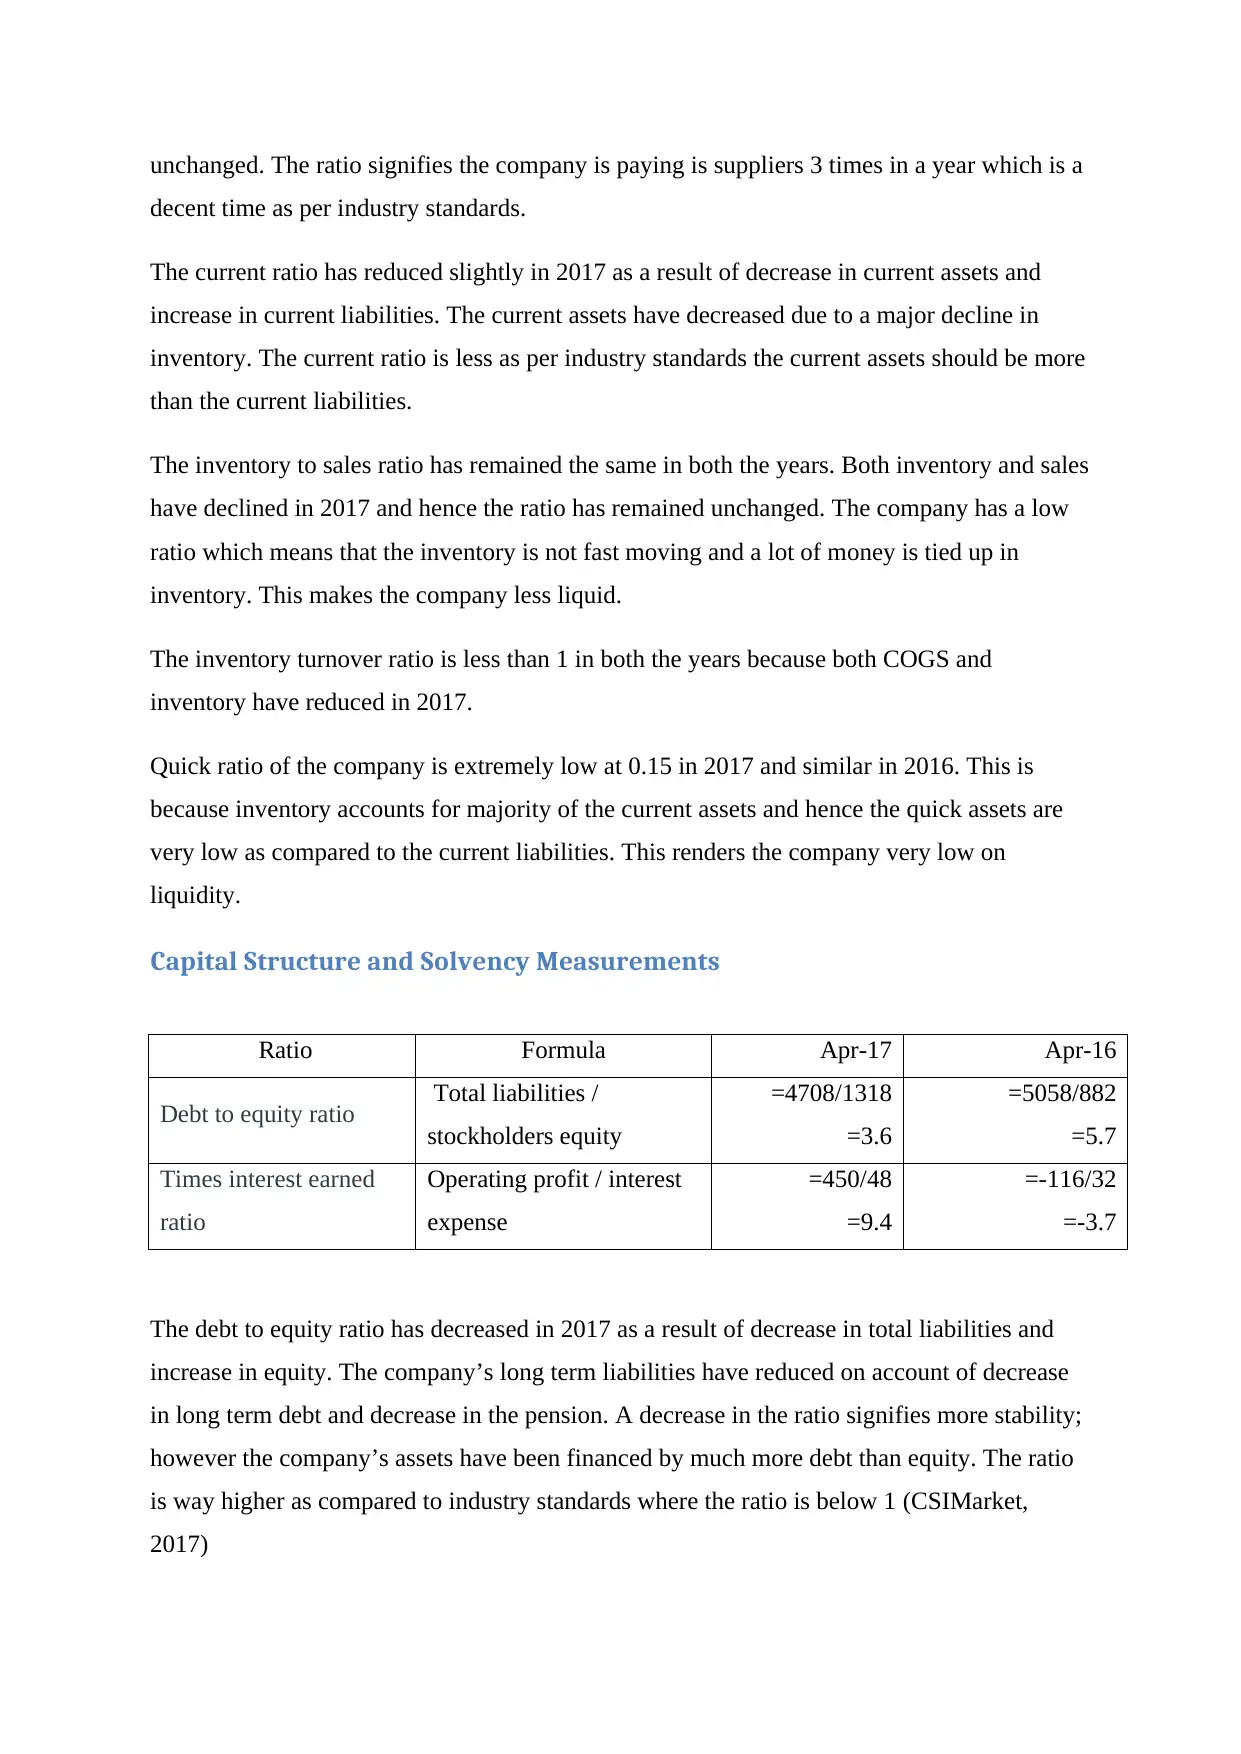
unchanged. The ratio signifies the company is paying is suppliers 3 times in a year which is a
decent time as per industry standards.
The current ratio has reduced slightly in 2017 as a result of decrease in current assets and
increase in current liabilities. The current assets have decreased due to a major decline in
inventory. The current ratio is less as per industry standards the current assets should be more
than the current liabilities.
The inventory to sales ratio has remained the same in both the years. Both inventory and sales
have declined in 2017 and hence the ratio has remained unchanged. The company has a low
ratio which means that the inventory is not fast moving and a lot of money is tied up in
inventory. This makes the company less liquid.
The inventory turnover ratio is less than 1 in both the years because both COGS and
inventory have reduced in 2017.
Quick ratio of the company is extremely low at 0.15 in 2017 and similar in 2016. This is
because inventory accounts for majority of the current assets and hence the quick assets are
very low as compared to the current liabilities. This renders the company very low on
liquidity.
Capital Structure and Solvency Measurements
Ratio Formula Apr-17 Apr-16
Debt to equity ratio Total liabilities /
stockholders equity
=4708/1318
=3.6
=5058/882
=5.7
Times interest earned
ratio
Operating profit / interest
expense
=450/48
=9.4
=-116/32
=-3.7
The debt to equity ratio has decreased in 2017 as a result of decrease in total liabilities and
increase in equity. The company’s long term liabilities have reduced on account of decrease
in long term debt and decrease in the pension. A decrease in the ratio signifies more stability;
however the company’s assets have been financed by much more debt than equity. The ratio
is way higher as compared to industry standards where the ratio is below 1 (CSIMarket,
2017)
Paraphrase This Document
Need a fresh take? Get an instant paraphrase of this document with our AI Paraphraser
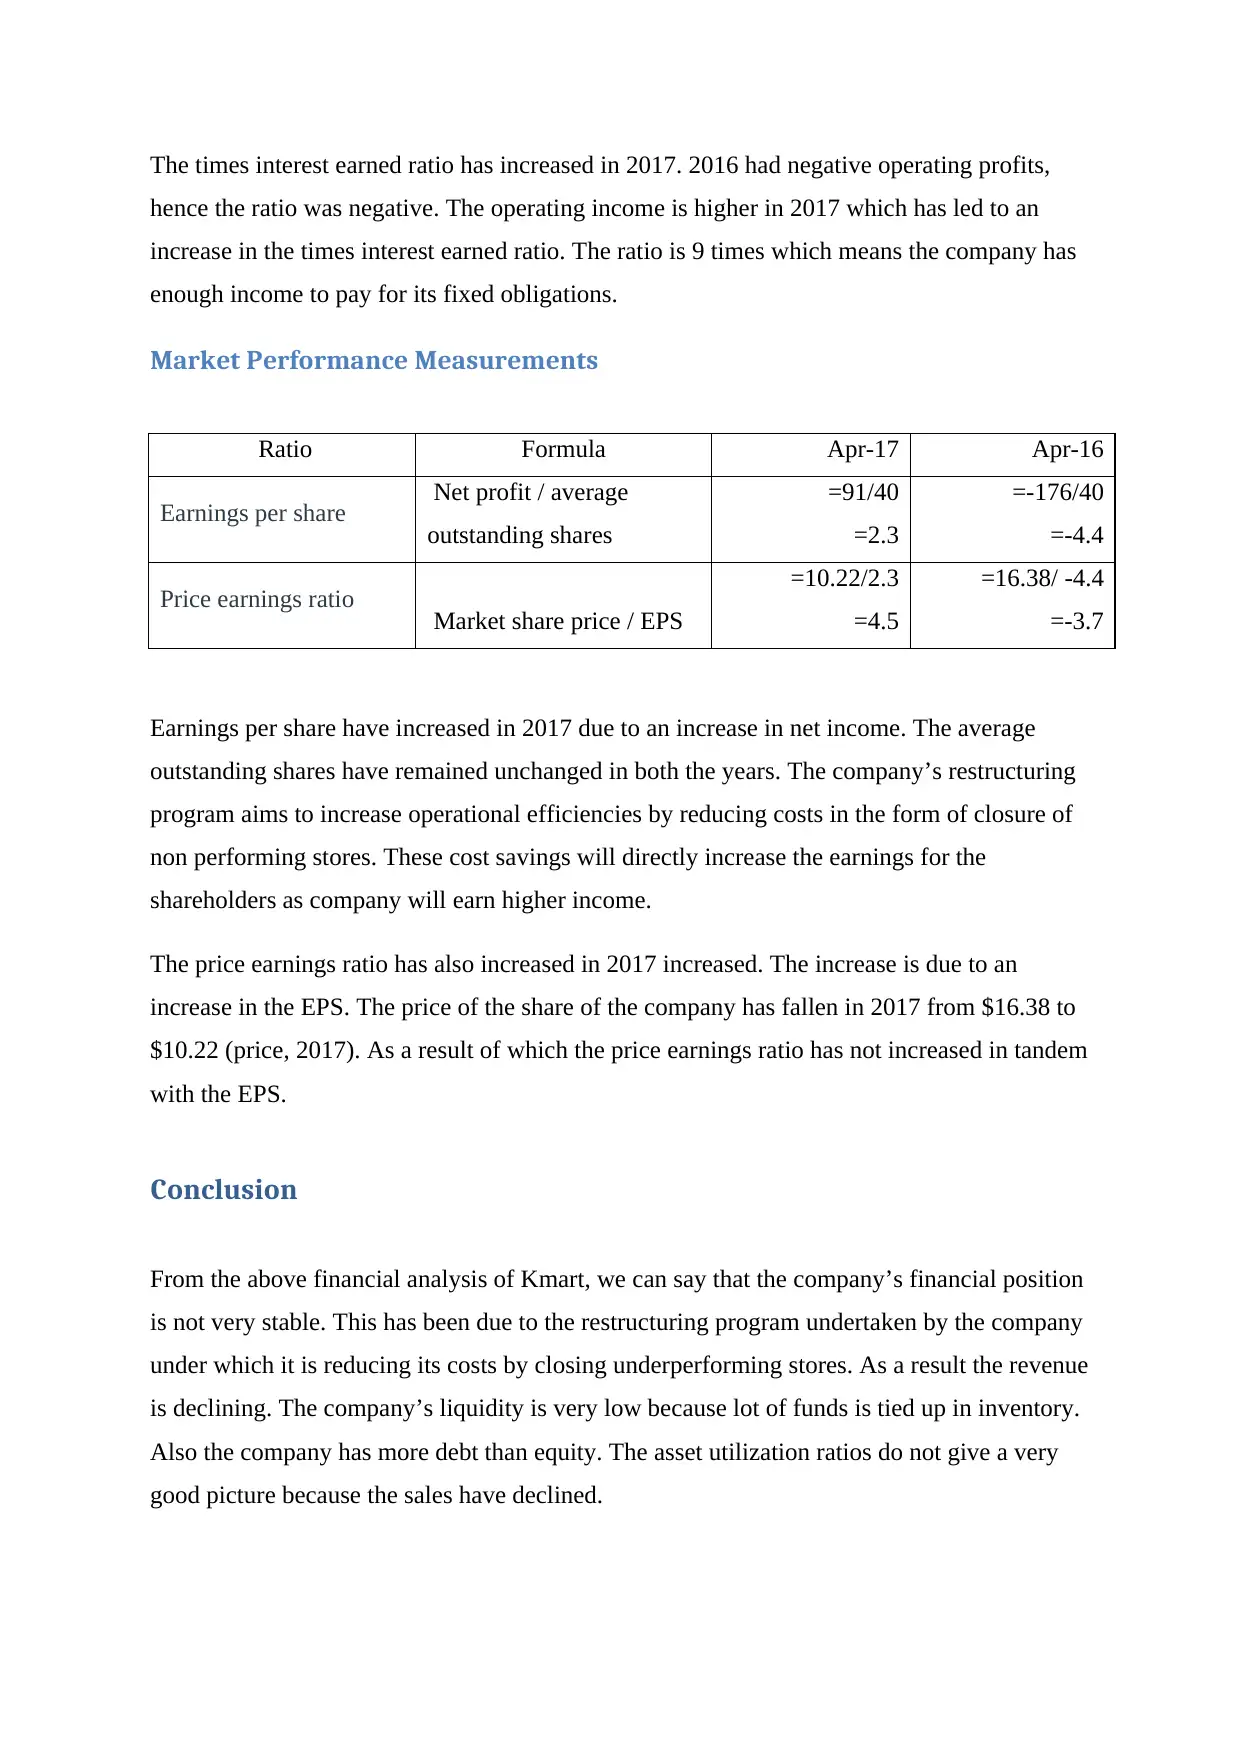
The times interest earned ratio has increased in 2017. 2016 had negative operating profits,
hence the ratio was negative. The operating income is higher in 2017 which has led to an
increase in the times interest earned ratio. The ratio is 9 times which means the company has
enough income to pay for its fixed obligations.
Market Performance Measurements
Ratio Formula Apr-17 Apr-16
Earnings per share Net profit / average
outstanding shares
=91/40
=2.3
=-176/40
=-4.4
Price earnings ratio Market share price / EPS
=10.22/2.3
=4.5
=16.38/ -4.4
=-3.7
Earnings per share have increased in 2017 due to an increase in net income. The average
outstanding shares have remained unchanged in both the years. The company’s restructuring
program aims to increase operational efficiencies by reducing costs in the form of closure of
non performing stores. These cost savings will directly increase the earnings for the
shareholders as company will earn higher income.
The price earnings ratio has also increased in 2017 increased. The increase is due to an
increase in the EPS. The price of the share of the company has fallen in 2017 from $16.38 to
$10.22 (price, 2017). As a result of which the price earnings ratio has not increased in tandem
with the EPS.
Conclusion
From the above financial analysis of Kmart, we can say that the company’s financial position
is not very stable. This has been due to the restructuring program undertaken by the company
under which it is reducing its costs by closing underperforming stores. As a result the revenue
is declining. The company’s liquidity is very low because lot of funds is tied up in inventory.
Also the company has more debt than equity. The asset utilization ratios do not give a very
good picture because the sales have declined.
However, the company is expected to perform better after the restructuring program is over
as the reduced costs will help in increasing profits and the company will run only the
profitable stores.
Bibliography
Corporation, S. H. (2016, January 30). Sears Holding Corporation Form 10-K. Washington, United
States.
Corporation, S. H. (2017, January 28). Sears Holding Corporation Form 10-K. Washington, United
States.
CSIMarket. (2017). Retrieved August 12, 2017, from CSIMarket: https://csimarket.com/stocks/SHLD-
Financial-Strength-Comparisons.html
Holdings, S. (2017, May 25). Sears Holdings Reports First Quarter 2017 Results. USA.
price, H. s. (2017). Retrieved August 12, 2017, from Historicalstockprice.com:
https://www.historicalstockprice.com/history/?
a=historical&ticker=SHLD&month=04&day=28&year=2017&x=9&y=2
yahoo.finance. (2017). Sears Holdings Limited. Retrieved august 11, 2017, from
https://finance.yahoo.com/quote/SHLD/profile?p=SHLD
⊘ This is a preview!⊘
Do you want full access?
Subscribe today to unlock all pages.
Trusted by 1+ million students worldwide
1 out of 9
Related Documents


Your All-in-One AI-Powered Toolkit for Academic Success.
+13062052269
info@desklib.com
Available 24*7 on WhatsApp / Email
![[object Object]](/_next/static/media/star-bottom.7253800d.svg)
Unlock your academic potential
Copyright © 2020–2026 A2Z Services. All Rights Reserved. Developed and managed by ZUCOL.