Statistical Analysis of Koala Population and Tree Height Data - 2018
VerifiedAdded on 2020/05/16
|20
|3290
|133
Homework Assignment
AI Summary
This assignment analyzes a dataset related to koala populations in South East Queensland. The student calculates the proportion of juvenile koalas, performs hypothesis tests to determine if the proportion is less than a historical value, and assesses the normality and homogeneity of variance for tree height data. The solution includes the calculation of confidence intervals for the population mean height of trees, and a hypothesis test to determine if the mean height of trees in which juvenile koalas are sighted is greater than a specified value. Further, the assignment explores the differences in mean tree heights between adult and juvenile koalas using independent samples t-tests and confidence intervals. Finally, a paired t-test is used to determine if the height of juvenile koalas in trees decreases over a three-hour period. The solution incorporates SPSS output and hand calculations, and the student provides interpretations and conclusions based on the statistical results.

Data analysis
Student Name:
University
23rd January 2018
Student Name:
University
23rd January 2018
Paraphrase This Document
Need a fresh take? Get an instant paraphrase of this document with our AI Paraphraser
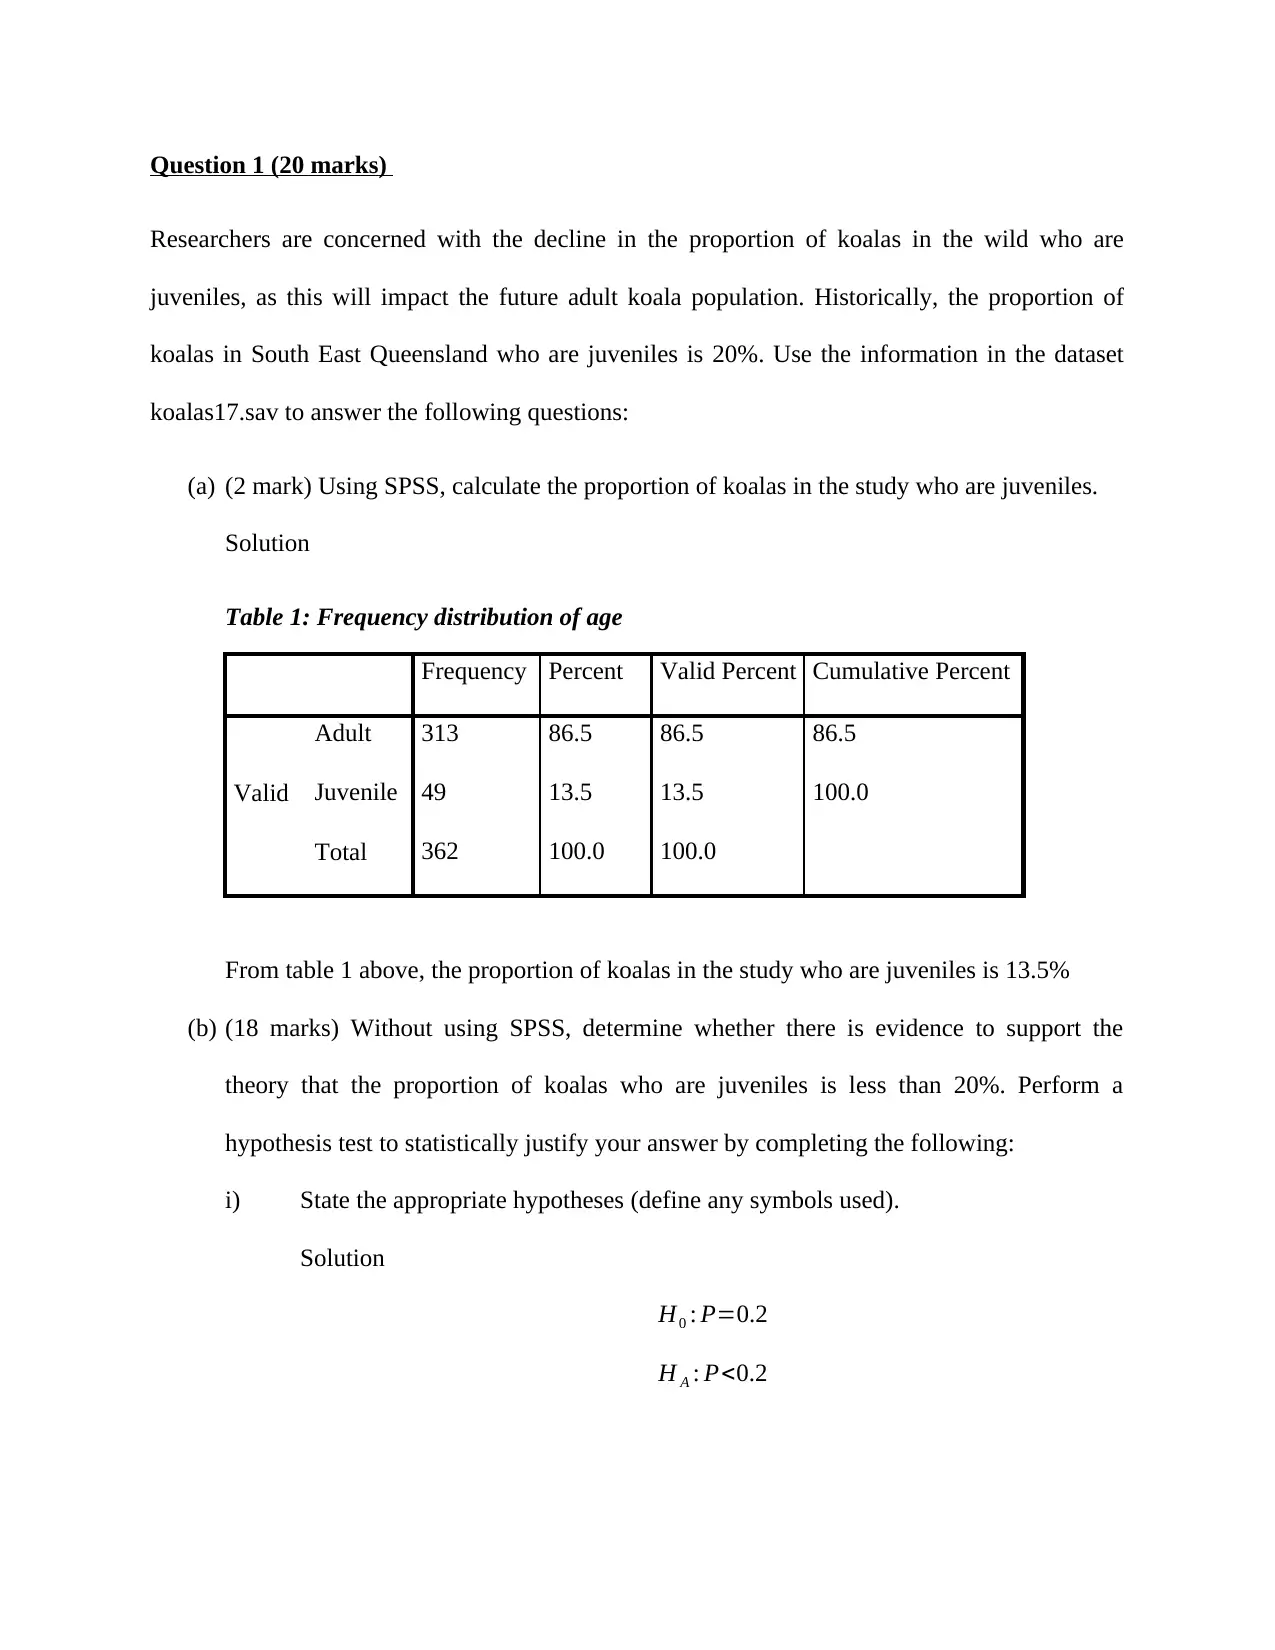
Question 1 (20 marks)
Researchers are concerned with the decline in the proportion of koalas in the wild who are
juveniles, as this will impact the future adult koala population. Historically, the proportion of
koalas in South East Queensland who are juveniles is 20%. Use the information in the dataset
koalas17.sav to answer the following questions:
(a) (2 mark) Using SPSS, calculate the proportion of koalas in the study who are juveniles.
Solution
Table 1: Frequency distribution of age
Frequency Percent Valid Percent Cumulative Percent
Valid
Adult 313 86.5 86.5 86.5
Juvenile 49 13.5 13.5 100.0
Total 362 100.0 100.0
From table 1 above, the proportion of koalas in the study who are juveniles is 13.5%
(b) (18 marks) Without using SPSS, determine whether there is evidence to support the
theory that the proportion of koalas who are juveniles is less than 20%. Perform a
hypothesis test to statistically justify your answer by completing the following:
i) State the appropriate hypotheses (define any symbols used).
Solution
H0 : P=0.2
H A : P<0.2
ii) Check the conditions and assumptions for this test.
Solution
Because of the central limit theorem (large sample size), the sampling distribution
of p is normally distributed
iii) Calculate the test statistic for this test.
Solution
z= ^p− p0
√ p0 (1−p0)
n
p0=0.2
^p= 49
362 =0.135
n=362
z= ^p− p0
√ p0 (1−p0)
n
= 0.135−0.2
√ 0.2(1−0.2)
362
=−3.09177
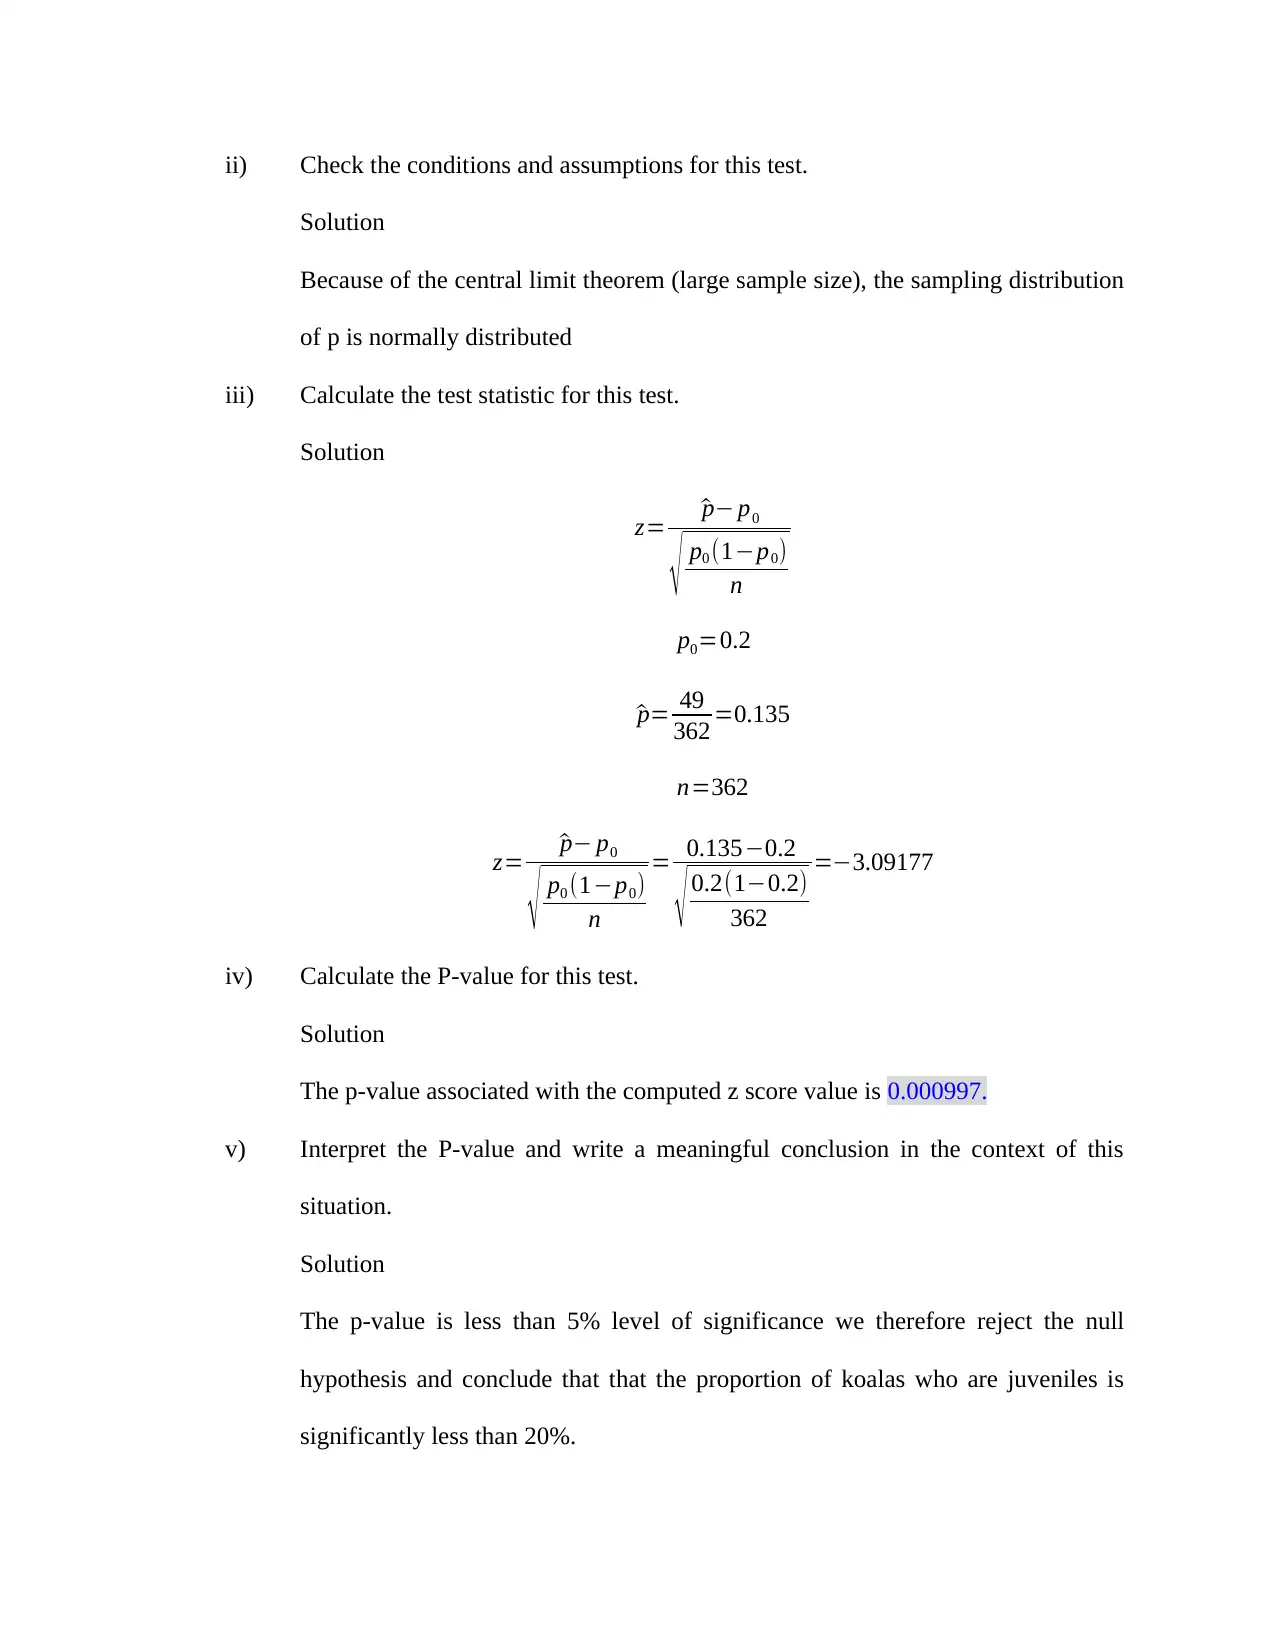
iv) Calculate the P-value for this test.
Solution
The p-value associated with the computed z score value is 0.000997.
v) Interpret the P-value and write a meaningful conclusion in the context of this
situation.
Solution
The p-value is less than 5% level of significance we therefore reject the null
hypothesis and conclude that that the proportion of koalas who are juveniles is
significantly less than 20%.
Solution
Because of the central limit theorem (large sample size), the sampling distribution
of p is normally distributed
iii) Calculate the test statistic for this test.
Solution
z= ^p− p0
√ p0 (1−p0)
n
p0=0.2
^p= 49
362 =0.135
n=362
z= ^p− p0
√ p0 (1−p0)
n
= 0.135−0.2
√ 0.2(1−0.2)
362
=−3.09177
iv) Calculate the P-value for this test.
Solution
The p-value associated with the computed z score value is 0.000997.
v) Interpret the P-value and write a meaningful conclusion in the context of this
situation.
Solution
The p-value is less than 5% level of significance we therefore reject the null
hypothesis and conclude that that the proportion of koalas who are juveniles is
significantly less than 20%.
⊘ This is a preview!⊘
Do you want full access?
Subscribe today to unlock all pages.
Trusted by 1+ million students worldwide
Question 2 (22 marks)
Use the information in the dataset koalas17.sav to answer the following questions. You should
use SPSS to calculate the sample statistics you will need to do this question, but for parts (b) and
(c) you are required to do all other calculations by hand, using a calculator. Regardless of your
answer to part (a), complete all parts of this question.
(a) (7 marks) Check the appropriate conditions and assumptions needed to calculate either a
confidence interval or hypothesis test in relation to the population mean height of the trees in
which juvenile koalas are sighted in South East Queensland. Comment on what these checks
indicate about the appropriateness of proceeding with the analysis. Include an appropriate
graph to support your answer.
Solution
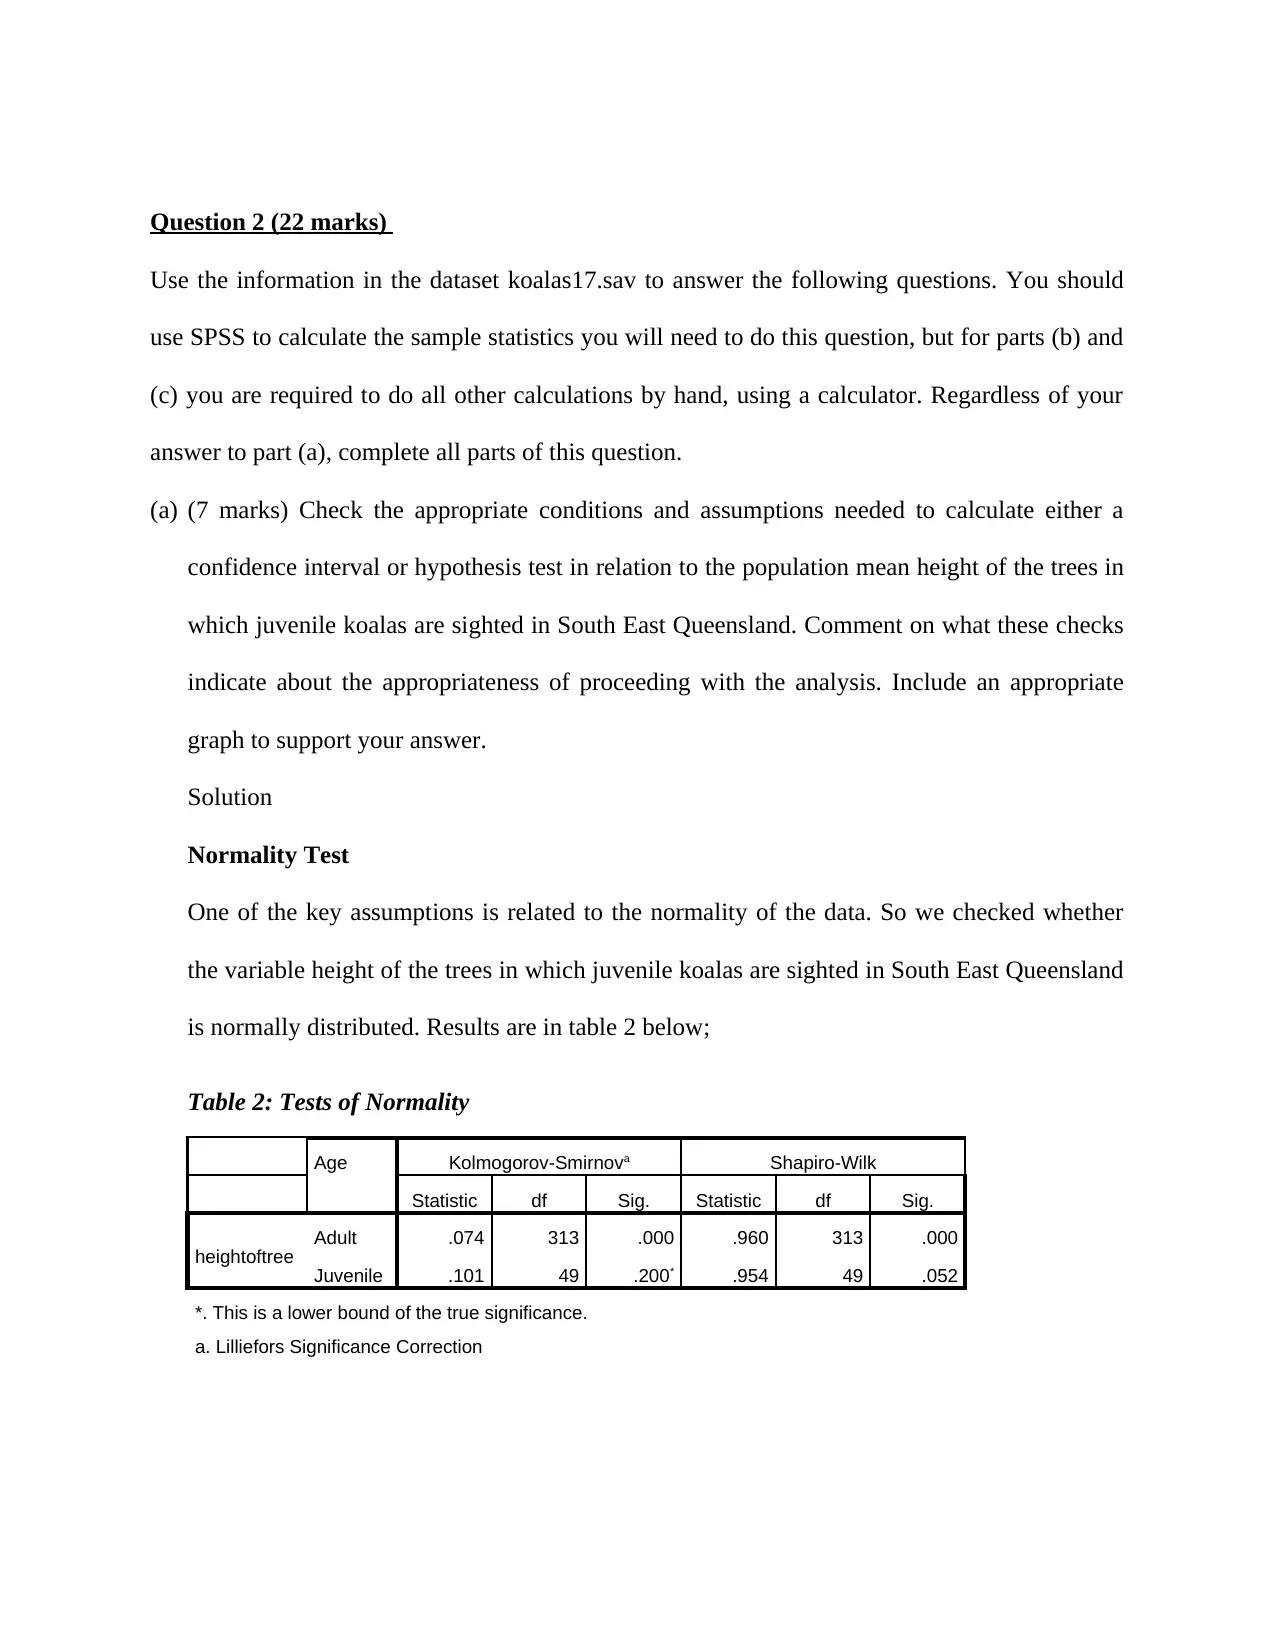
Normality Test
One of the key assumptions is related to the normality of the data. So we checked whether
the variable height of the trees in which juvenile koalas are sighted in South East Queensland
is normally distributed. Results are in table 2 below;
Table 2: Tests of Normality
Age Kolmogorov-Smirnova Shapiro-Wilk
Statistic df Sig. Statistic df Sig.
heightoftree Adult .074 313 .000 .960 313 .000
Juvenile .101 49 .200* .954 49 .052
*. This is a lower bound of the true significance.
a. Lilliefors Significance Correction
Use the information in the dataset koalas17.sav to answer the following questions. You should
use SPSS to calculate the sample statistics you will need to do this question, but for parts (b) and
(c) you are required to do all other calculations by hand, using a calculator. Regardless of your
answer to part (a), complete all parts of this question.
(a) (7 marks) Check the appropriate conditions and assumptions needed to calculate either a
confidence interval or hypothesis test in relation to the population mean height of the trees in
which juvenile koalas are sighted in South East Queensland. Comment on what these checks
indicate about the appropriateness of proceeding with the analysis. Include an appropriate
graph to support your answer.
Solution
Normality Test
One of the key assumptions is related to the normality of the data. So we checked whether
the variable height of the trees in which juvenile koalas are sighted in South East Queensland
is normally distributed. Results are in table 2 below;
Table 2: Tests of Normality
Age Kolmogorov-Smirnova Shapiro-Wilk
Statistic df Sig. Statistic df Sig.
heightoftree Adult .074 313 .000 .960 313 .000
Juvenile .101 49 .200* .954 49 .052
*. This is a lower bound of the true significance.
a. Lilliefors Significance Correction
Paraphrase This Document
Need a fresh take? Get an instant paraphrase of this document with our AI Paraphraser
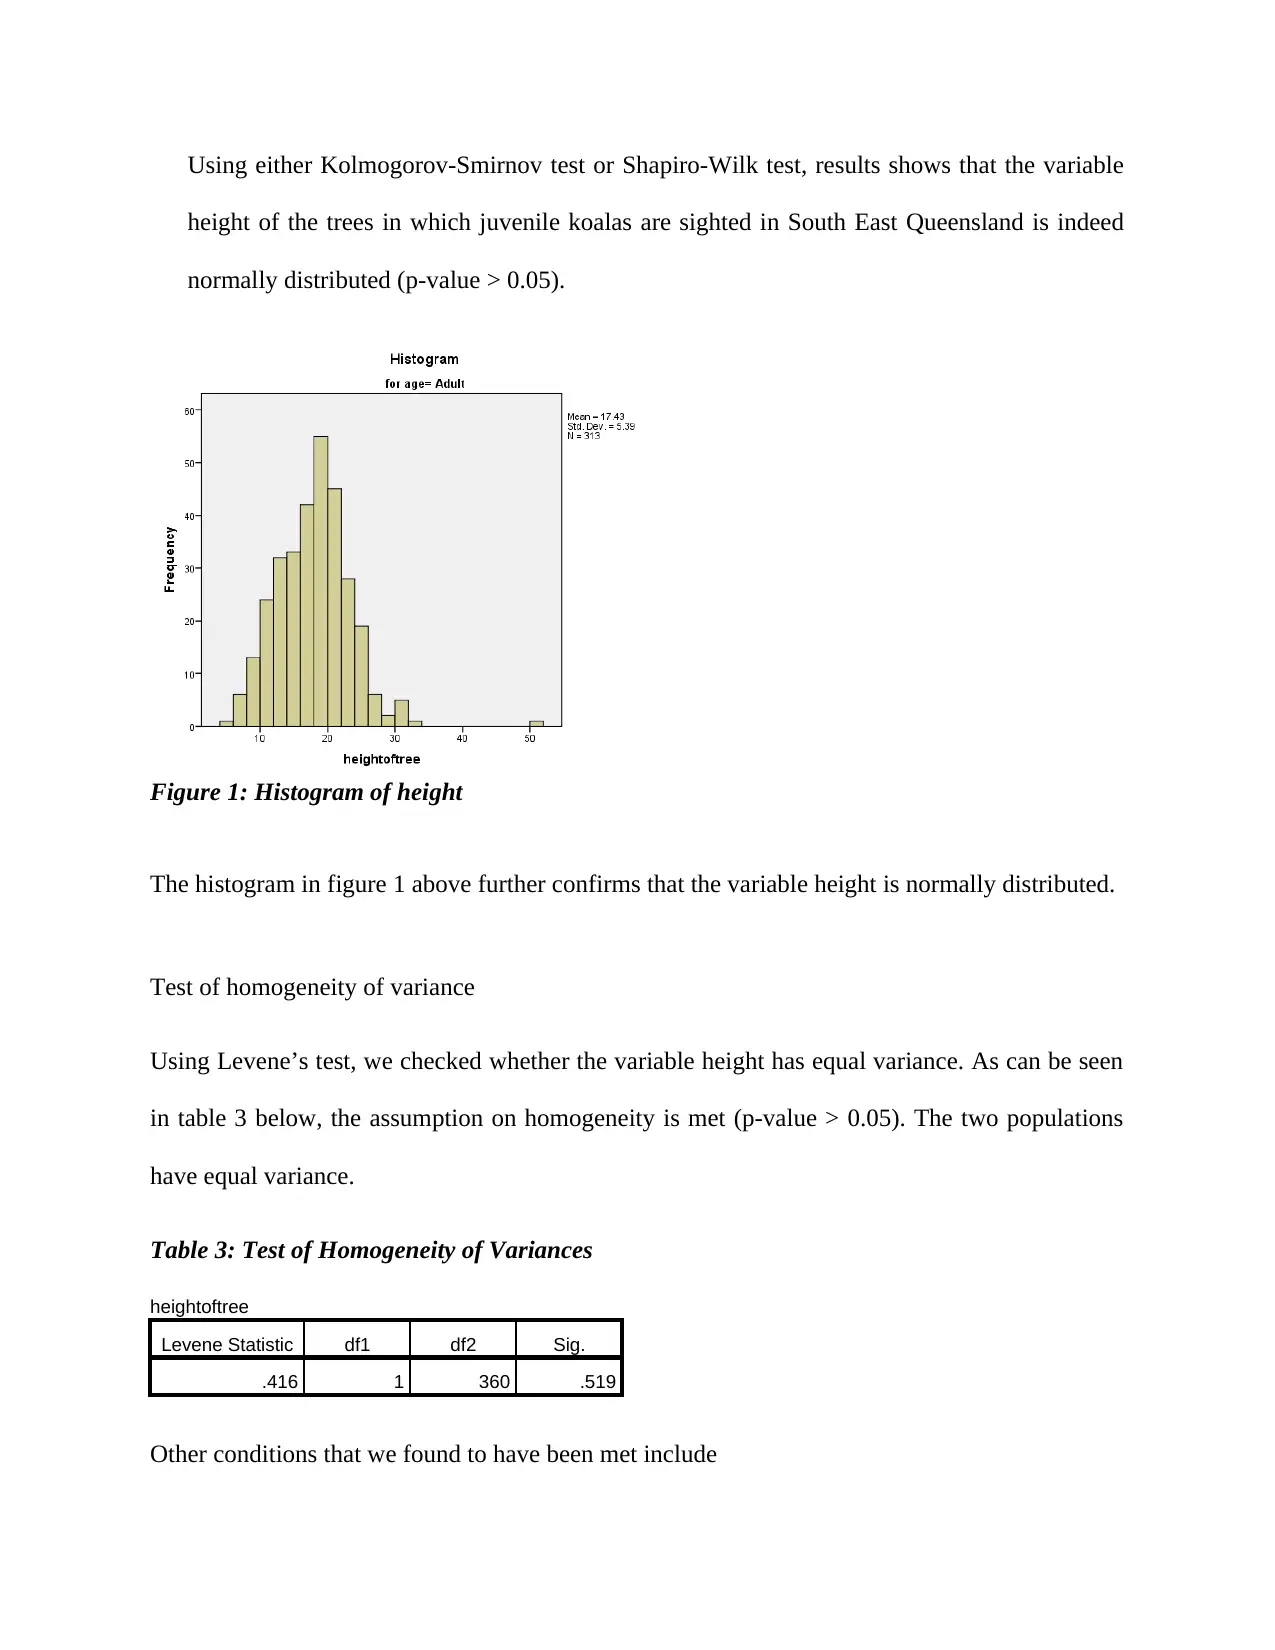
Using either Kolmogorov-Smirnov test or Shapiro-Wilk test, results shows that the variable
height of the trees in which juvenile koalas are sighted in South East Queensland is indeed
normally distributed (p-value > 0.05).
Figure 1: Histogram of height
The histogram in figure 1 above further confirms that the variable height is normally distributed.
Test of homogeneity of variance
Using Levene’s test, we checked whether the variable height has equal variance. As can be seen
in table 3 below, the assumption on homogeneity is met (p-value > 0.05). The two populations
have equal variance.
Table 3: Test of Homogeneity of Variances
heightoftree
Levene Statistic df1 df2 Sig.
.416 1 360 .519
Other conditions that we found to have been met include
Each value in the sample was sampled independently from each other value
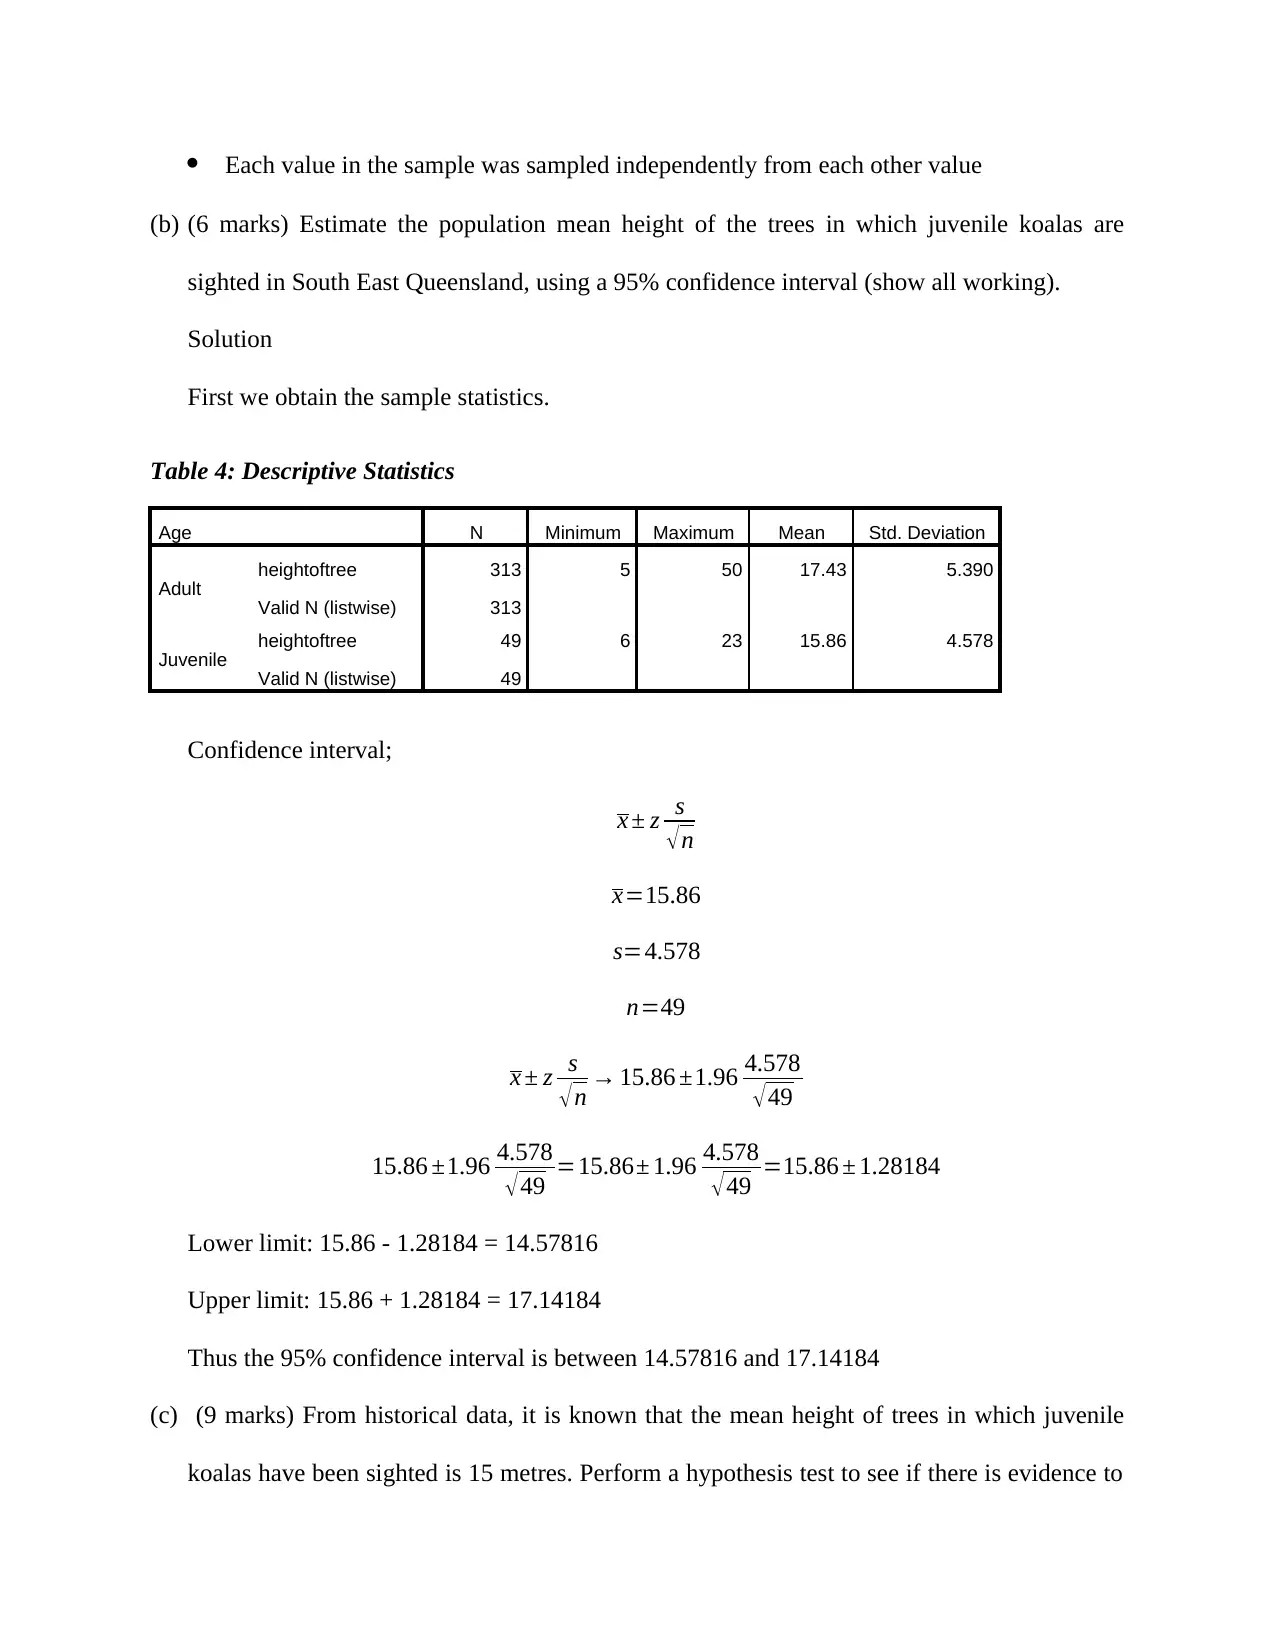
(b) (6 marks) Estimate the population mean height of the trees in which juvenile koalas are
sighted in South East Queensland, using a 95% confidence interval (show all working).
Solution
First we obtain the sample statistics.
Table 4: Descriptive Statistics
Age N Minimum Maximum Mean Std. Deviation
Adult
heightoftree 313 5 50 17.43 5.390
Valid N (listwise) 313
Juvenile heightoftree 49 6 23 15.86 4.578
Valid N (listwise) 49
Confidence interval;
x ± z s
√n
x=15.86
s=4.578
n=49
x ± z s
√ n → 15.86 ±1.96 4.578
√ 49
15.86 ±1.96 4.578
√ 49 =15.86± 1.96 4.578
√49 =15.86 ± 1.28184
Lower limit: 15.86 - 1.28184 = 14.57816
Upper limit: 15.86 + 1.28184 = 17.14184
Thus the 95% confidence interval is between 14.57816 and 17.14184
(c) (9 marks) From historical data, it is known that the mean height of trees in which juvenile
koalas have been sighted is 15 metres. Perform a hypothesis test to see if there is evidence to
⊘ This is a preview!⊘
Do you want full access?
Subscribe today to unlock all pages.
Trusted by 1+ million students worldwide
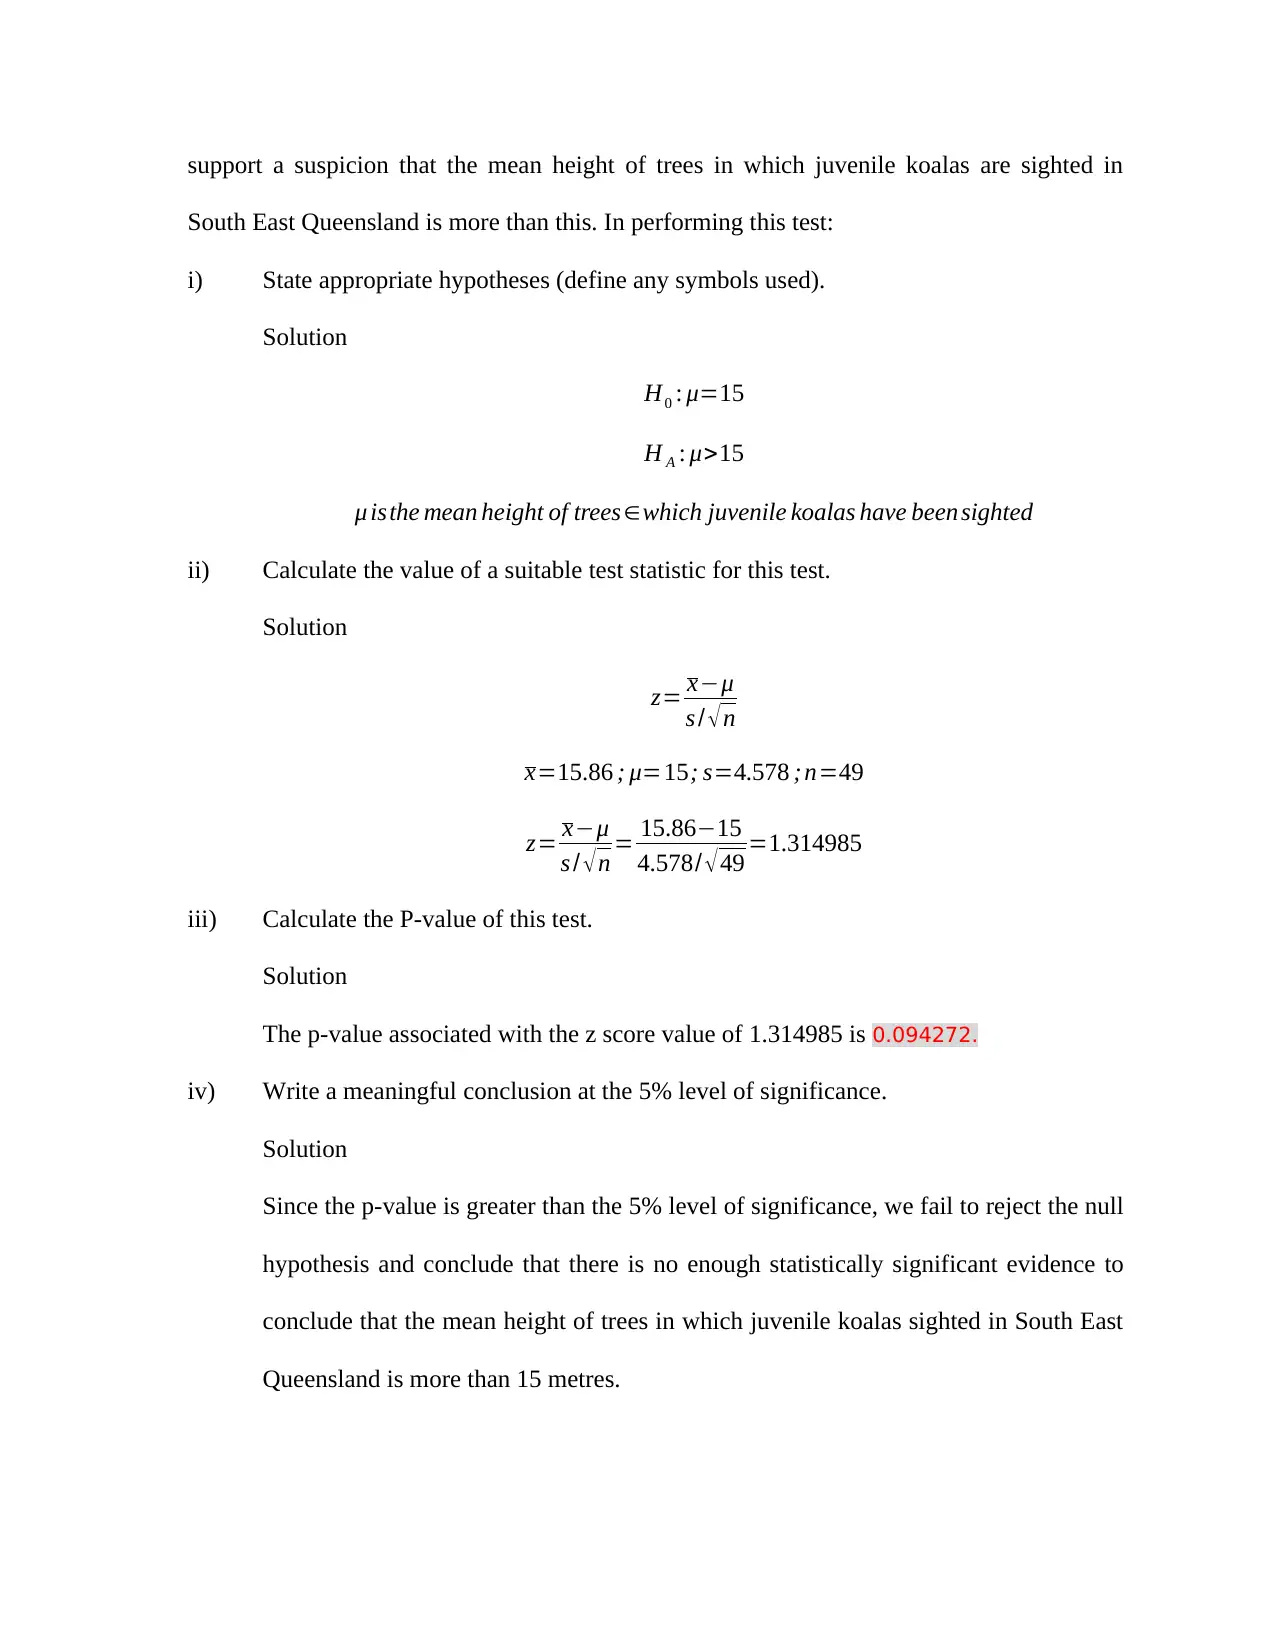
support a suspicion that the mean height of trees in which juvenile koalas are sighted in
South East Queensland is more than this. In performing this test:
i) State appropriate hypotheses (define any symbols used).
Solution
H0 : μ=15
H A : μ>15
μ isthe mean height of trees∈which juvenile koalas have been sighted
ii) Calculate the value of a suitable test statistic for this test.
Solution
z= x−μ
s / √n
x=15.86 ; μ=15; s=4.578 ; n=49
z= x−μ
s / √n = 15.86−15
4.578/ √49 =1.314985
iii) Calculate the P-value of this test.
Solution
The p-value associated with the z score value of 1.314985 is 0.094272.
iv) Write a meaningful conclusion at the 5% level of significance.
Solution
Since the p-value is greater than the 5% level of significance, we fail to reject the null
hypothesis and conclude that there is no enough statistically significant evidence to
conclude that the mean height of trees in which juvenile koalas sighted in South East
Queensland is more than 15 metres.
Paraphrase This Document
Need a fresh take? Get an instant paraphrase of this document with our AI Paraphraser
Question 3 (26 marks)
Use the information in the dataset koalas17.sav to answer the following questions. You should
use SPSS to calculate any sample statistics you will need to do this question, but for parts b(ii)
and (c) you are required to do all other calculations by hand, using a calculator. Koalas of two
broad age groups were sighted in South East Queensland – adult and juvenile. As a researcher
you are interested to see whether there is a difference in the mean height of trees in which these
two groups of koalas are sighted. Regardless of your answer to part (a), complete all parts of this
question.
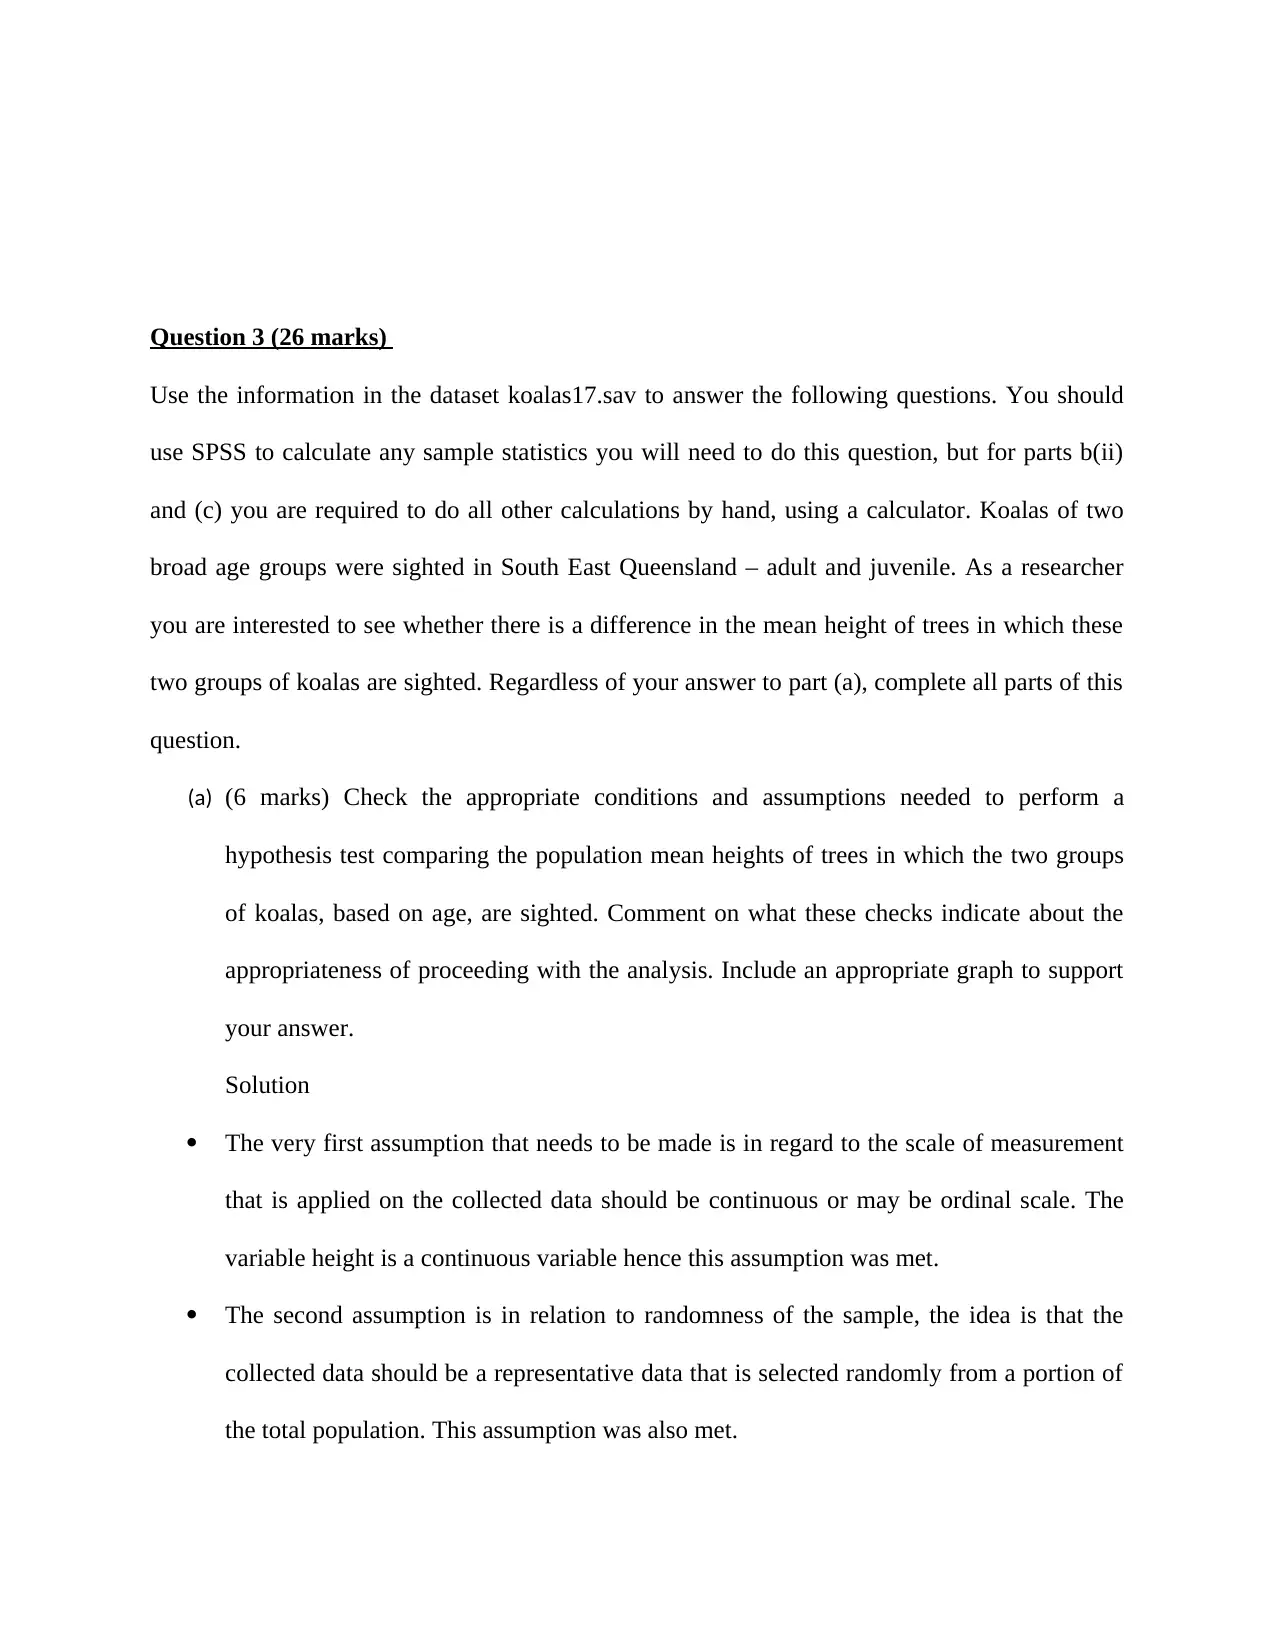
(a) (6 marks) Check the appropriate conditions and assumptions needed to perform a
hypothesis test comparing the population mean heights of trees in which the two groups
of koalas, based on age, are sighted. Comment on what these checks indicate about the
appropriateness of proceeding with the analysis. Include an appropriate graph to support
your answer.
Solution
The very first assumption that needs to be made is in regard to the scale of measurement
that is applied on the collected data should be continuous or may be ordinal scale. The
variable height is a continuous variable hence this assumption was met.
The second assumption is in relation to randomness of the sample, the idea is that the
collected data should be a representative data that is selected randomly from a portion of
the total population. This assumption was also met.
Use the information in the dataset koalas17.sav to answer the following questions. You should
use SPSS to calculate any sample statistics you will need to do this question, but for parts b(ii)
and (c) you are required to do all other calculations by hand, using a calculator. Koalas of two
broad age groups were sighted in South East Queensland – adult and juvenile. As a researcher
you are interested to see whether there is a difference in the mean height of trees in which these
two groups of koalas are sighted. Regardless of your answer to part (a), complete all parts of this
question.
(a) (6 marks) Check the appropriate conditions and assumptions needed to perform a
hypothesis test comparing the population mean heights of trees in which the two groups
of koalas, based on age, are sighted. Comment on what these checks indicate about the
appropriateness of proceeding with the analysis. Include an appropriate graph to support
your answer.
Solution
The very first assumption that needs to be made is in regard to the scale of measurement
that is applied on the collected data should be continuous or may be ordinal scale. The
variable height is a continuous variable hence this assumption was met.
The second assumption is in relation to randomness of the sample, the idea is that the
collected data should be a representative data that is selected randomly from a portion of
the total population. This assumption was also met.
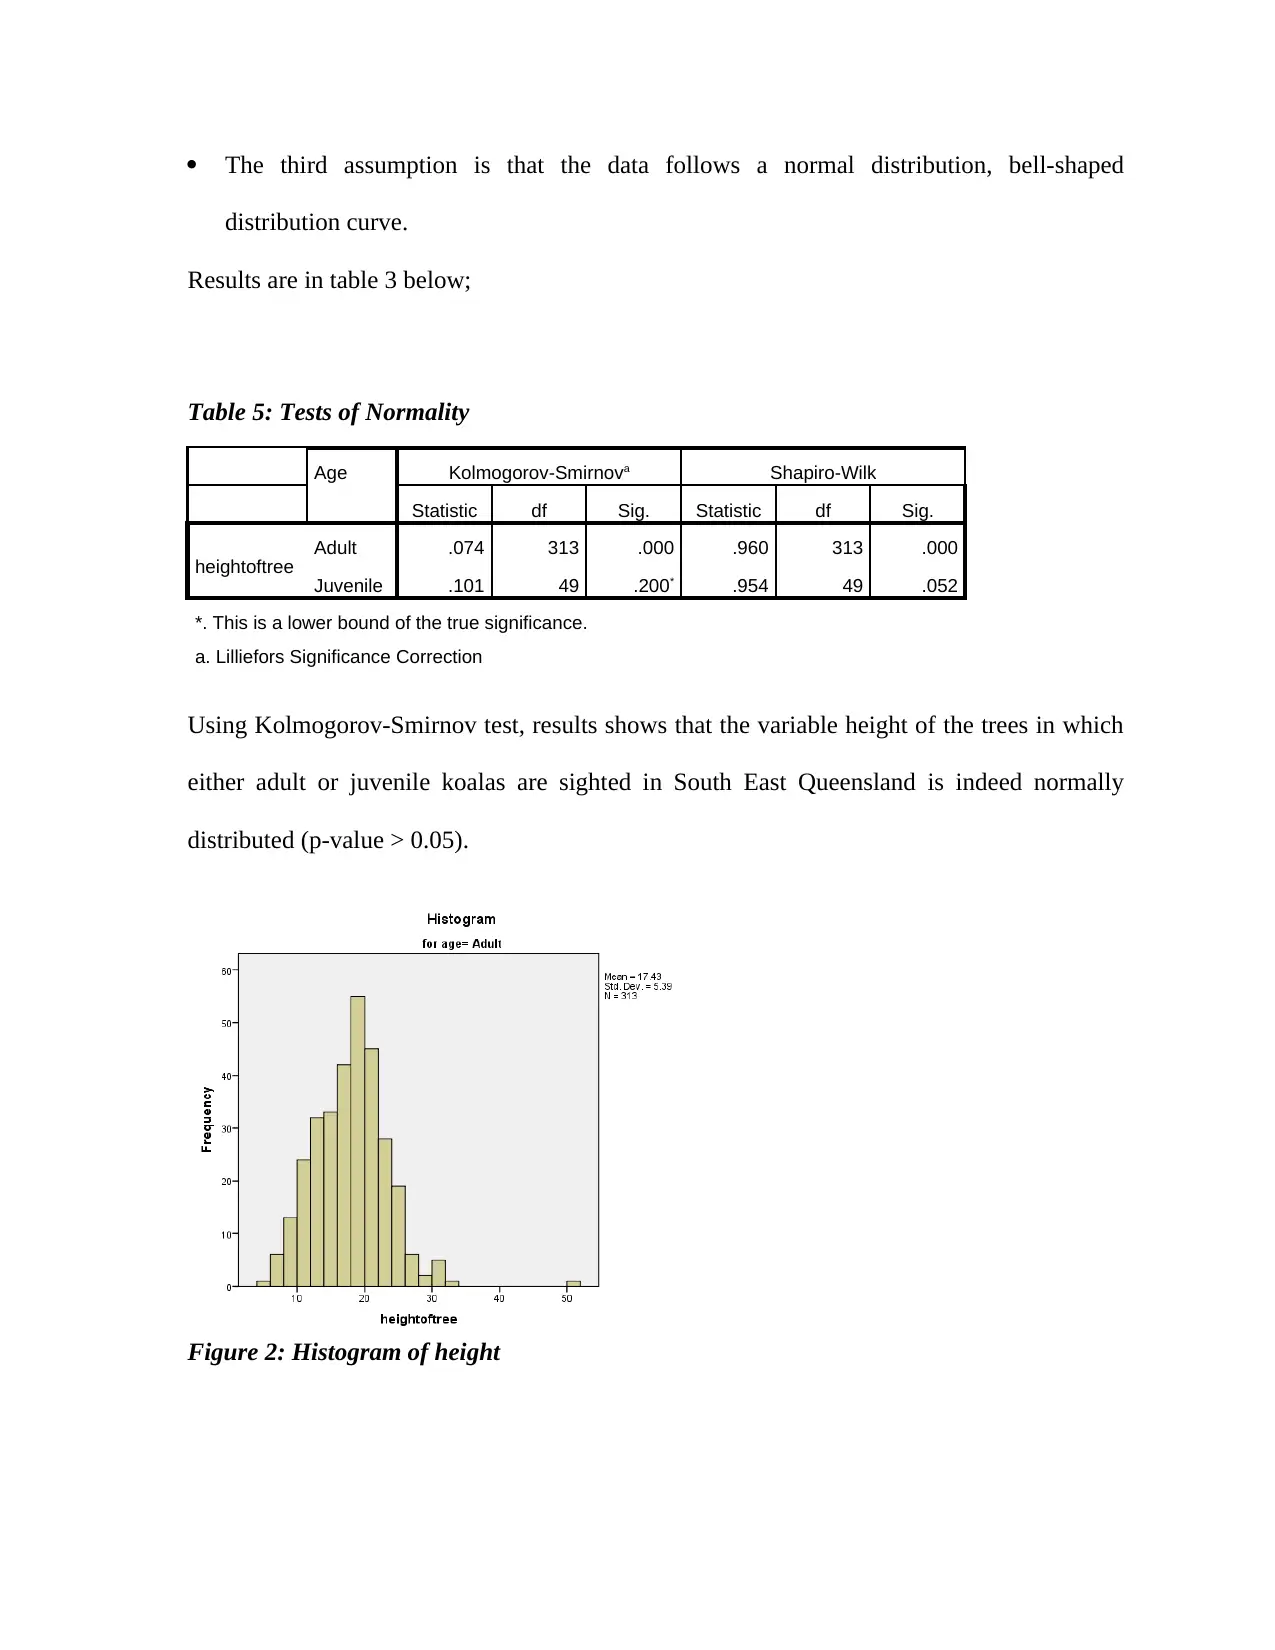
The third assumption is that the data follows a normal distribution, bell-shaped
distribution curve.
Results are in table 3 below;
Table 5: Tests of Normality
Age Kolmogorov-Smirnova Shapiro-Wilk
Statistic df Sig. Statistic df Sig.
heightoftree Adult .074 313 .000 .960 313 .000
Juvenile .101 49 .200* .954 49 .052
*. This is a lower bound of the true significance.
a. Lilliefors Significance Correction
Using Kolmogorov-Smirnov test, results shows that the variable height of the trees in which
either adult or juvenile koalas are sighted in South East Queensland is indeed normally
distributed (p-value > 0.05).
Figure 2: Histogram of height
⊘ This is a preview!⊘
Do you want full access?
Subscribe today to unlock all pages.
Trusted by 1+ million students worldwide
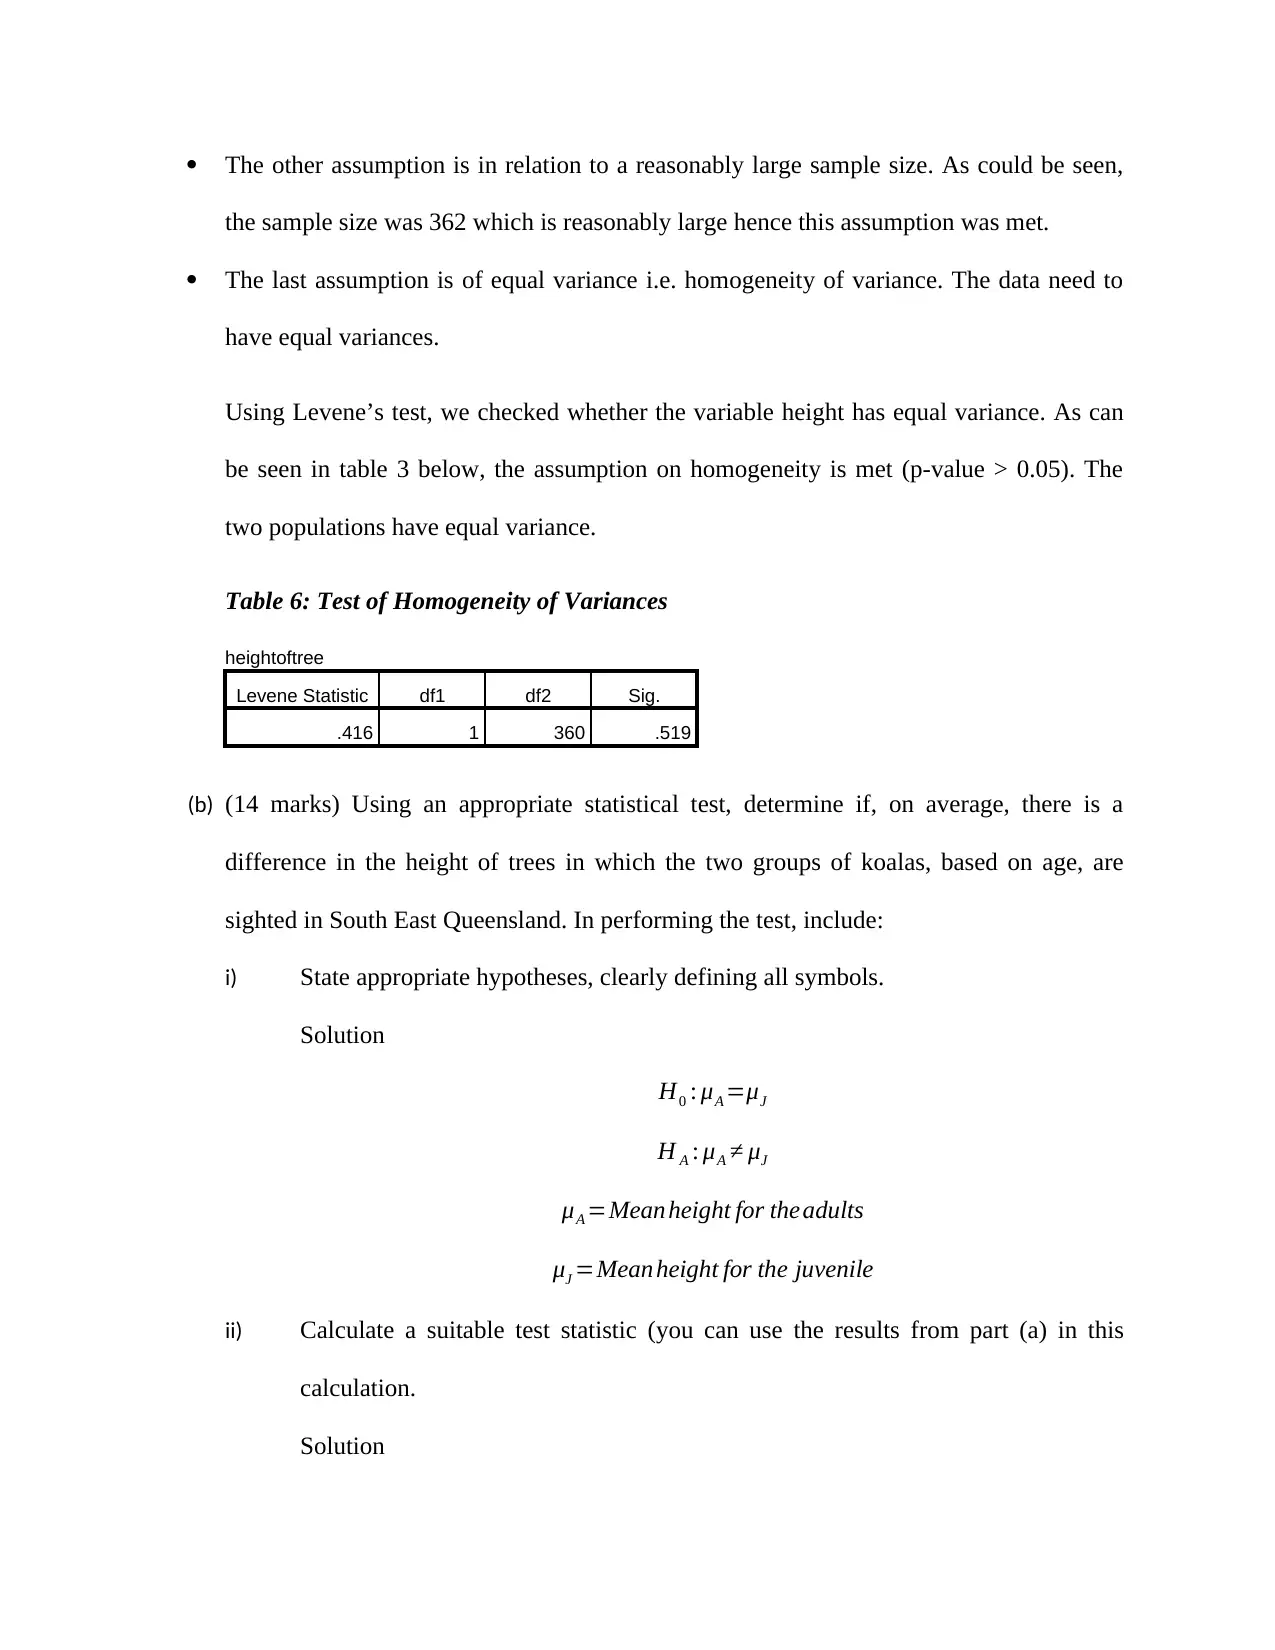
The other assumption is in relation to a reasonably large sample size. As could be seen,
the sample size was 362 which is reasonably large hence this assumption was met.
The last assumption is of equal variance i.e. homogeneity of variance. The data need to
have equal variances.
Using Levene’s test, we checked whether the variable height has equal variance. As can
be seen in table 3 below, the assumption on homogeneity is met (p-value > 0.05). The
two populations have equal variance.
Table 6: Test of Homogeneity of Variances
heightoftree
Levene Statistic df1 df2 Sig.
.416 1 360 .519
(b) (14 marks) Using an appropriate statistical test, determine if, on average, there is a
difference in the height of trees in which the two groups of koalas, based on age, are
sighted in South East Queensland. In performing the test, include:
i) State appropriate hypotheses, clearly defining all symbols.
Solution
H0 : μA =μJ
H A : μA ≠ μJ
μA =Mean height for the adults
μJ =Mean height for the juvenile
ii) Calculate a suitable test statistic (you can use the results from part (a) in this
calculation.
Solution
Paraphrase This Document
Need a fresh take? Get an instant paraphrase of this document with our AI Paraphraser
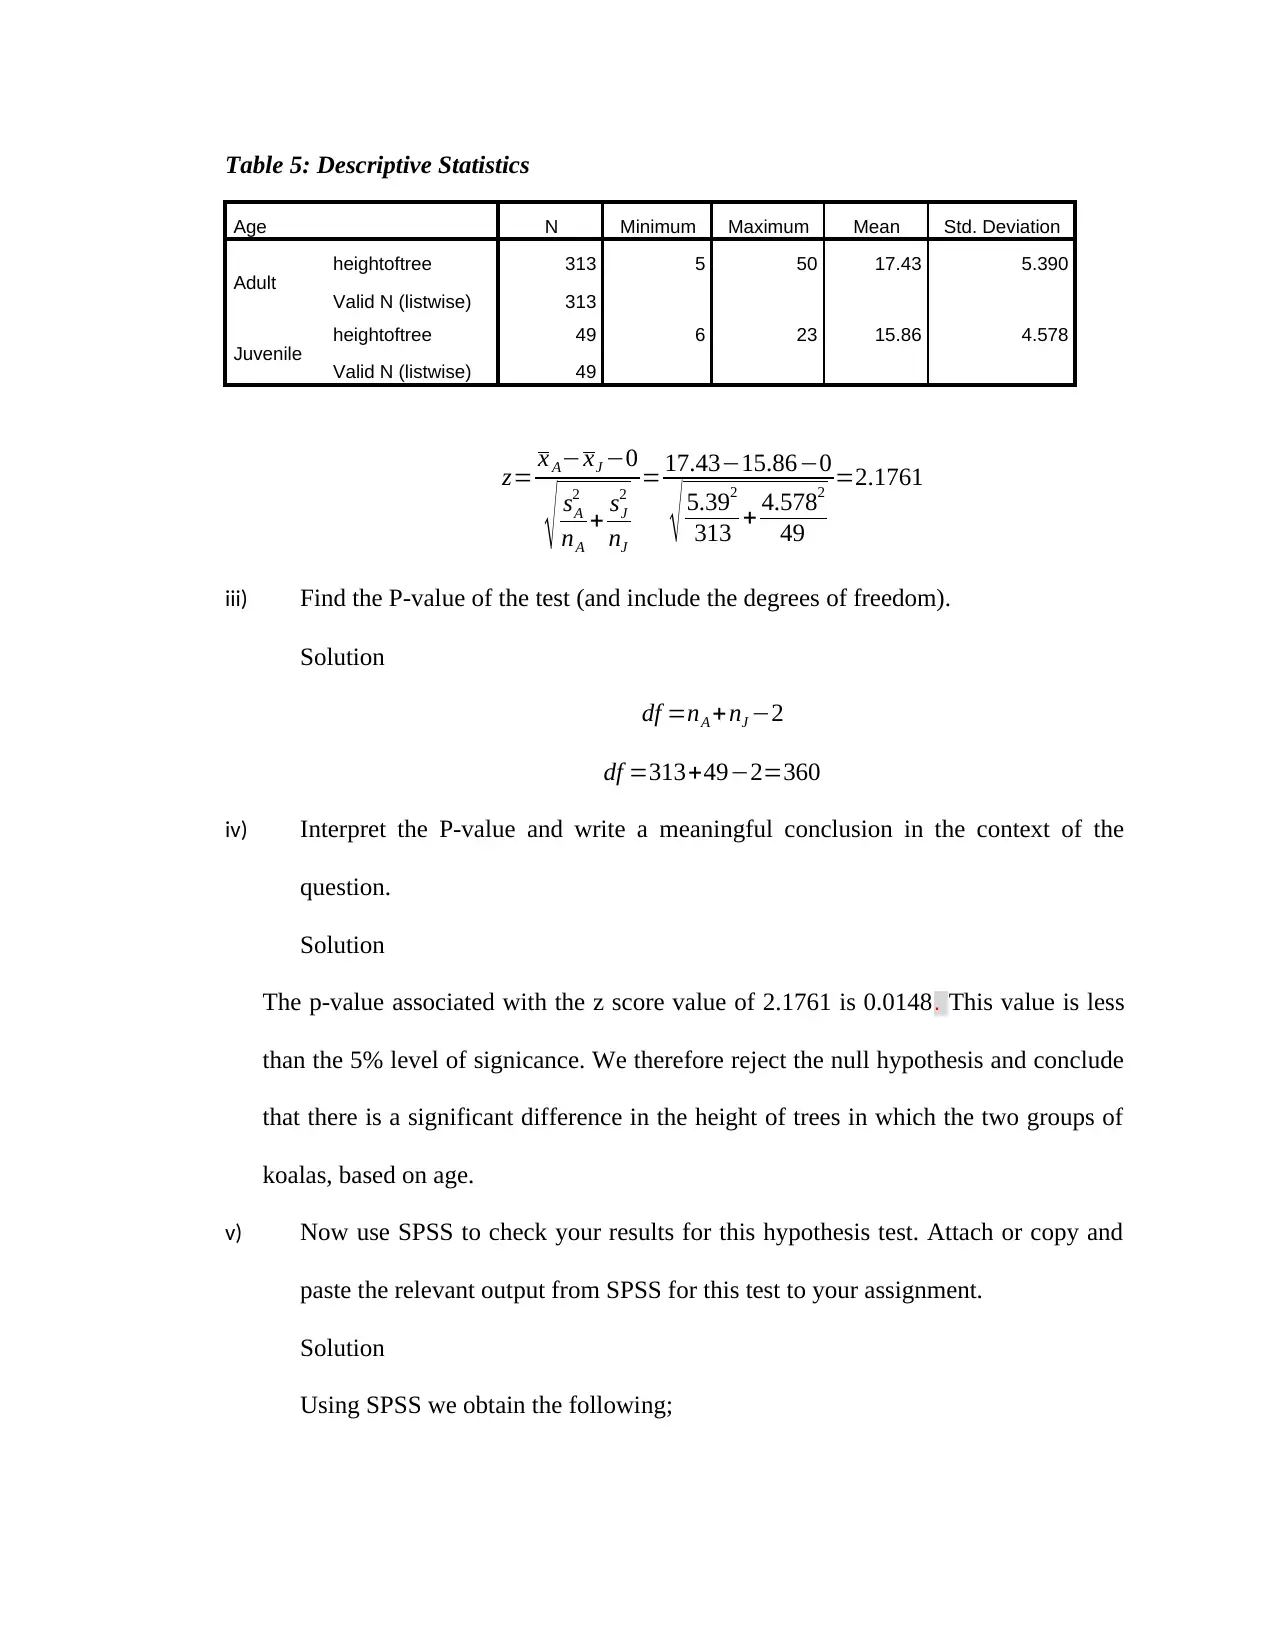
Table 5: Descriptive Statistics
Age N Minimum Maximum Mean Std. Deviation
Adult heightoftree 313 5 50 17.43 5.390
Valid N (listwise) 313
Juvenile heightoftree 49 6 23 15.86 4.578
Valid N (listwise) 49
z= x A−xJ −0
√ sA
2
nA
+ sJ
2
nJ
= 17.43−15.86−0
√ 5.392
313 + 4.5782
49
=2.1761
iii) Find the P-value of the test (and include the degrees of freedom).
Solution
df =nA +nJ −2
df =313+49−2=360
iv) Interpret the P-value and write a meaningful conclusion in the context of the
question.
Solution
The p-value associated with the z score value of 2.1761 is 0.0148. This value is less
than the 5% level of signicance. We therefore reject the null hypothesis and conclude
that there is a significant difference in the height of trees in which the two groups of
koalas, based on age.
v) Now use SPSS to check your results for this hypothesis test. Attach or copy and
paste the relevant output from SPSS for this test to your assignment.
Solution
Using SPSS we obtain the following;
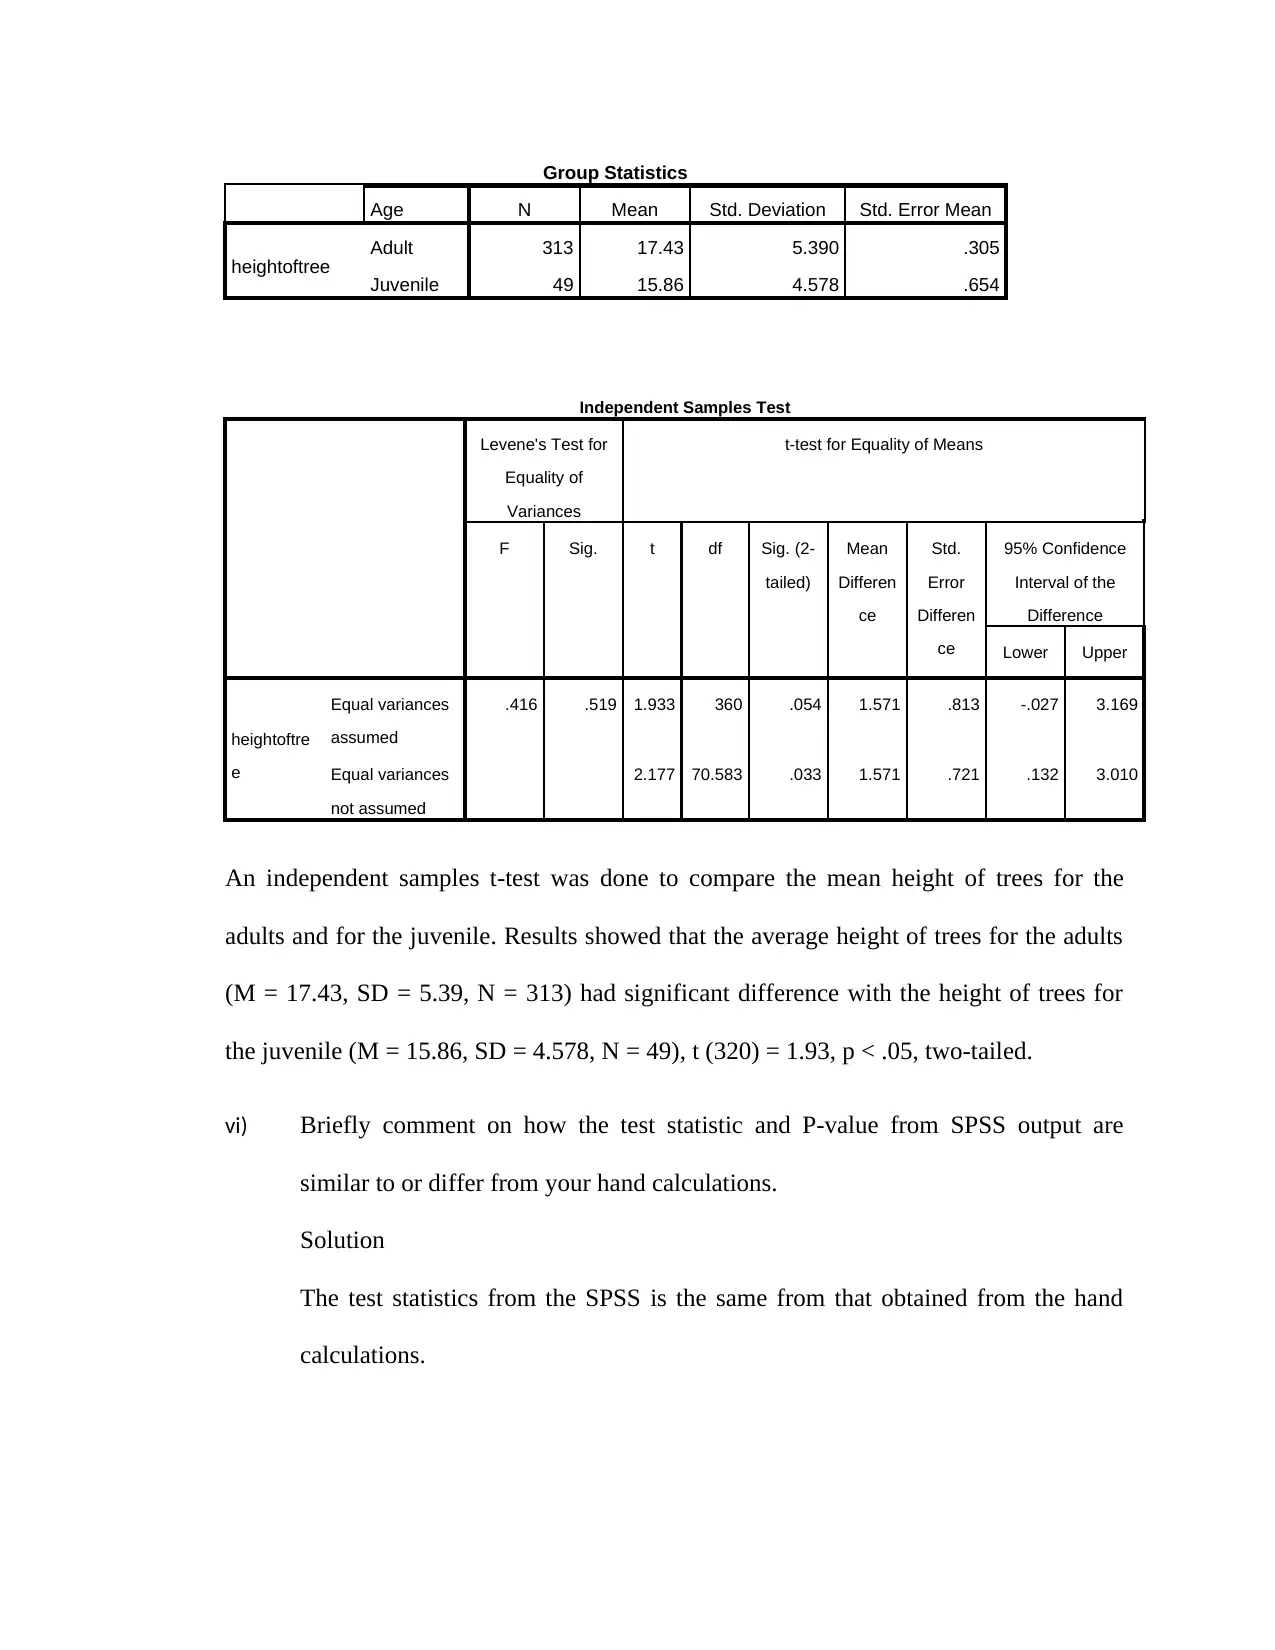
Group Statistics
Age N Mean Std. Deviation Std. Error Mean
heightoftree Adult 313 17.43 5.390 .305
Juvenile 49 15.86 4.578 .654
Independent Samples Test
Levene's Test for
Equality of
Variances
t-test for Equality of Means
F Sig. t df Sig. (2-
tailed)
Mean
Differen
ce
Std.
Error
Differen
ce
95% Confidence
Interval of the
Difference
Lower Upper
heightoftre
e
Equal variances
assumed
.416 .519 1.933 360 .054 1.571 .813 -.027 3.169
Equal variances
not assumed
2.177 70.583 .033 1.571 .721 .132 3.010
An independent samples t-test was done to compare the mean height of trees for the
adults and for the juvenile. Results showed that the average height of trees for the adults
(M = 17.43, SD = 5.39, N = 313) had significant difference with the height of trees for
the juvenile (M = 15.86, SD = 4.578, N = 49), t (320) = 1.93, p < .05, two-tailed.
vi) Briefly comment on how the test statistic and P-value from SPSS output are
similar to or differ from your hand calculations.
Solution
The test statistics from the SPSS is the same from that obtained from the hand
calculations.
⊘ This is a preview!⊘
Do you want full access?
Subscribe today to unlock all pages.
Trusted by 1+ million students worldwide
1 out of 20
Your All-in-One AI-Powered Toolkit for Academic Success.
+13062052269
info@desklib.com
Available 24*7 on WhatsApp / Email
![[object Object]](/_next/static/media/star-bottom.7253800d.svg)
Unlock your academic potential
Copyright © 2020–2026 A2Z Services. All Rights Reserved. Developed and managed by ZUCOL.