University Financial Analysis: Konekt Limited (KKT) Health Care Report
VerifiedAdded on 2020/05/16
|17
|2353
|55
Report
AI Summary
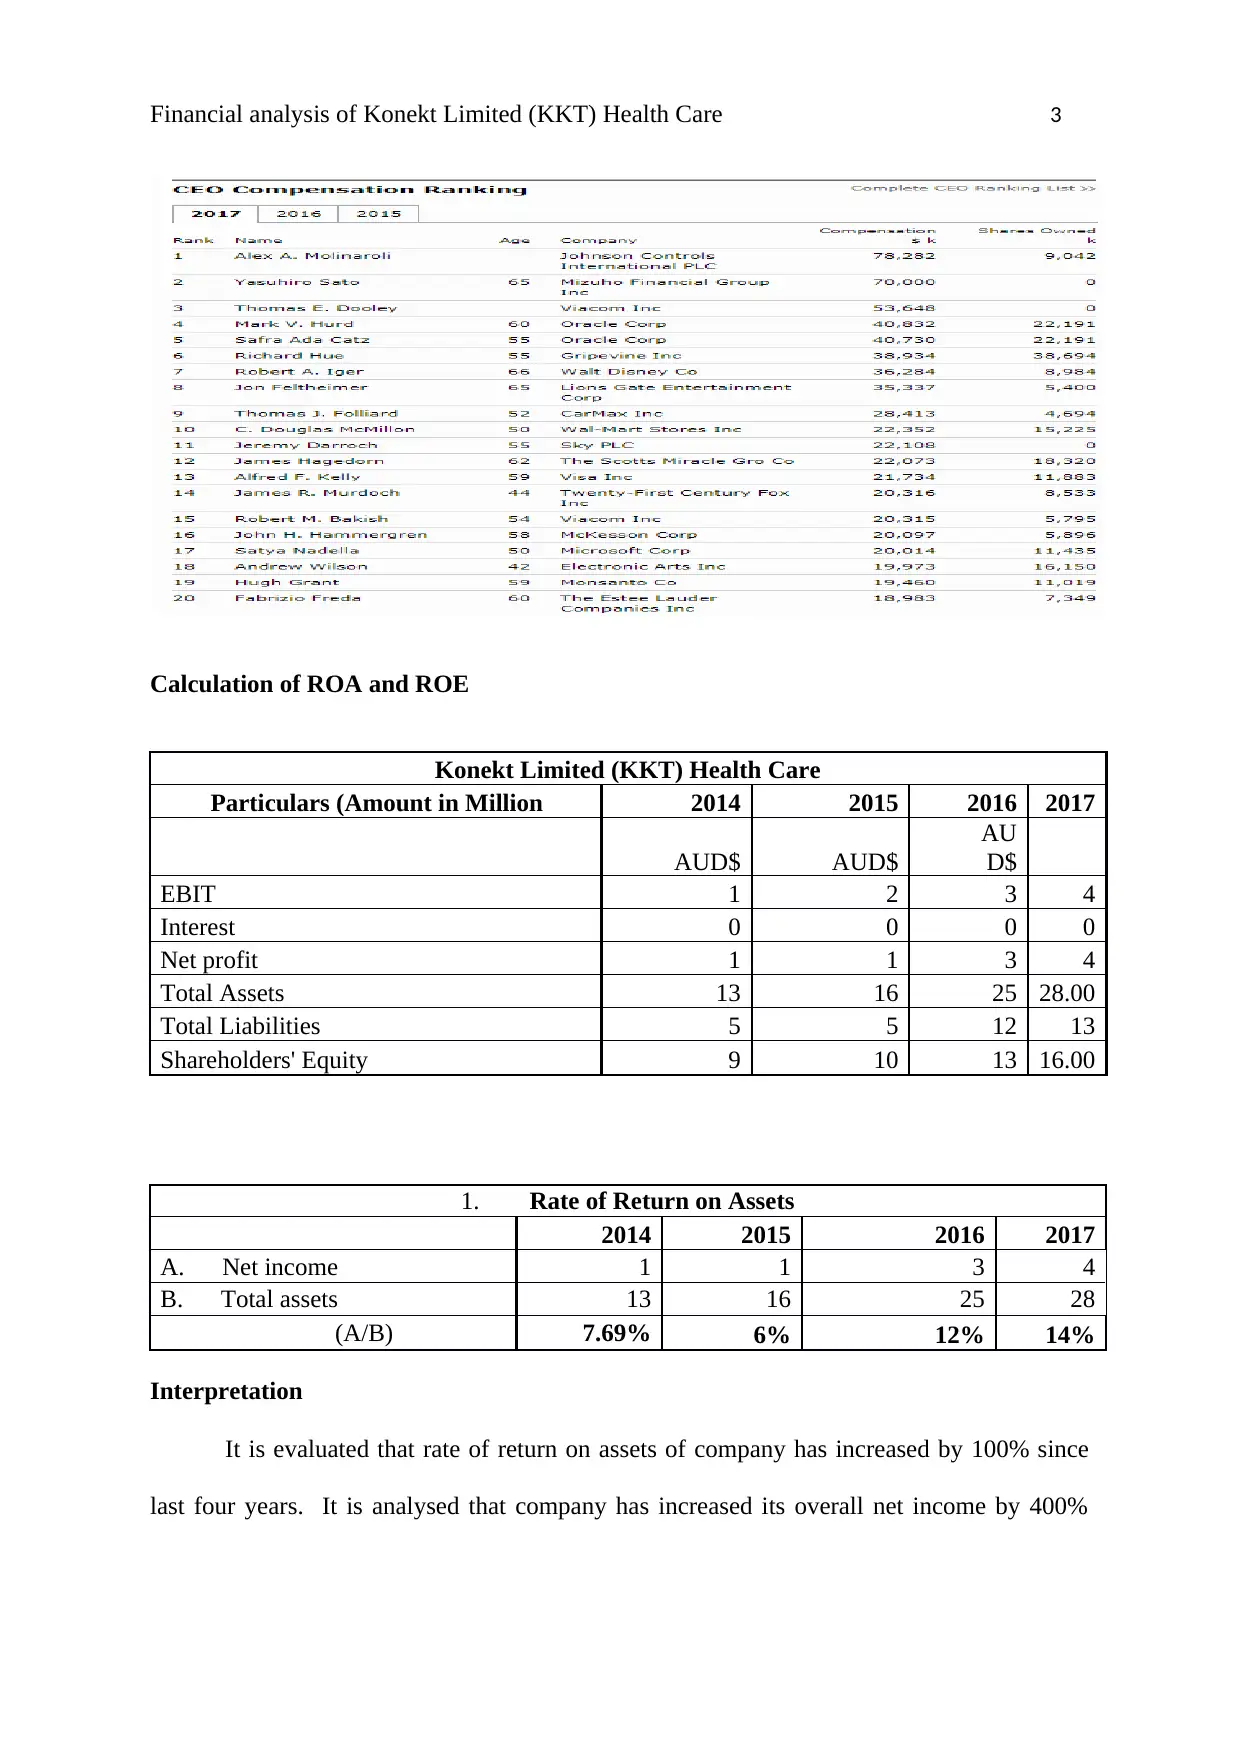
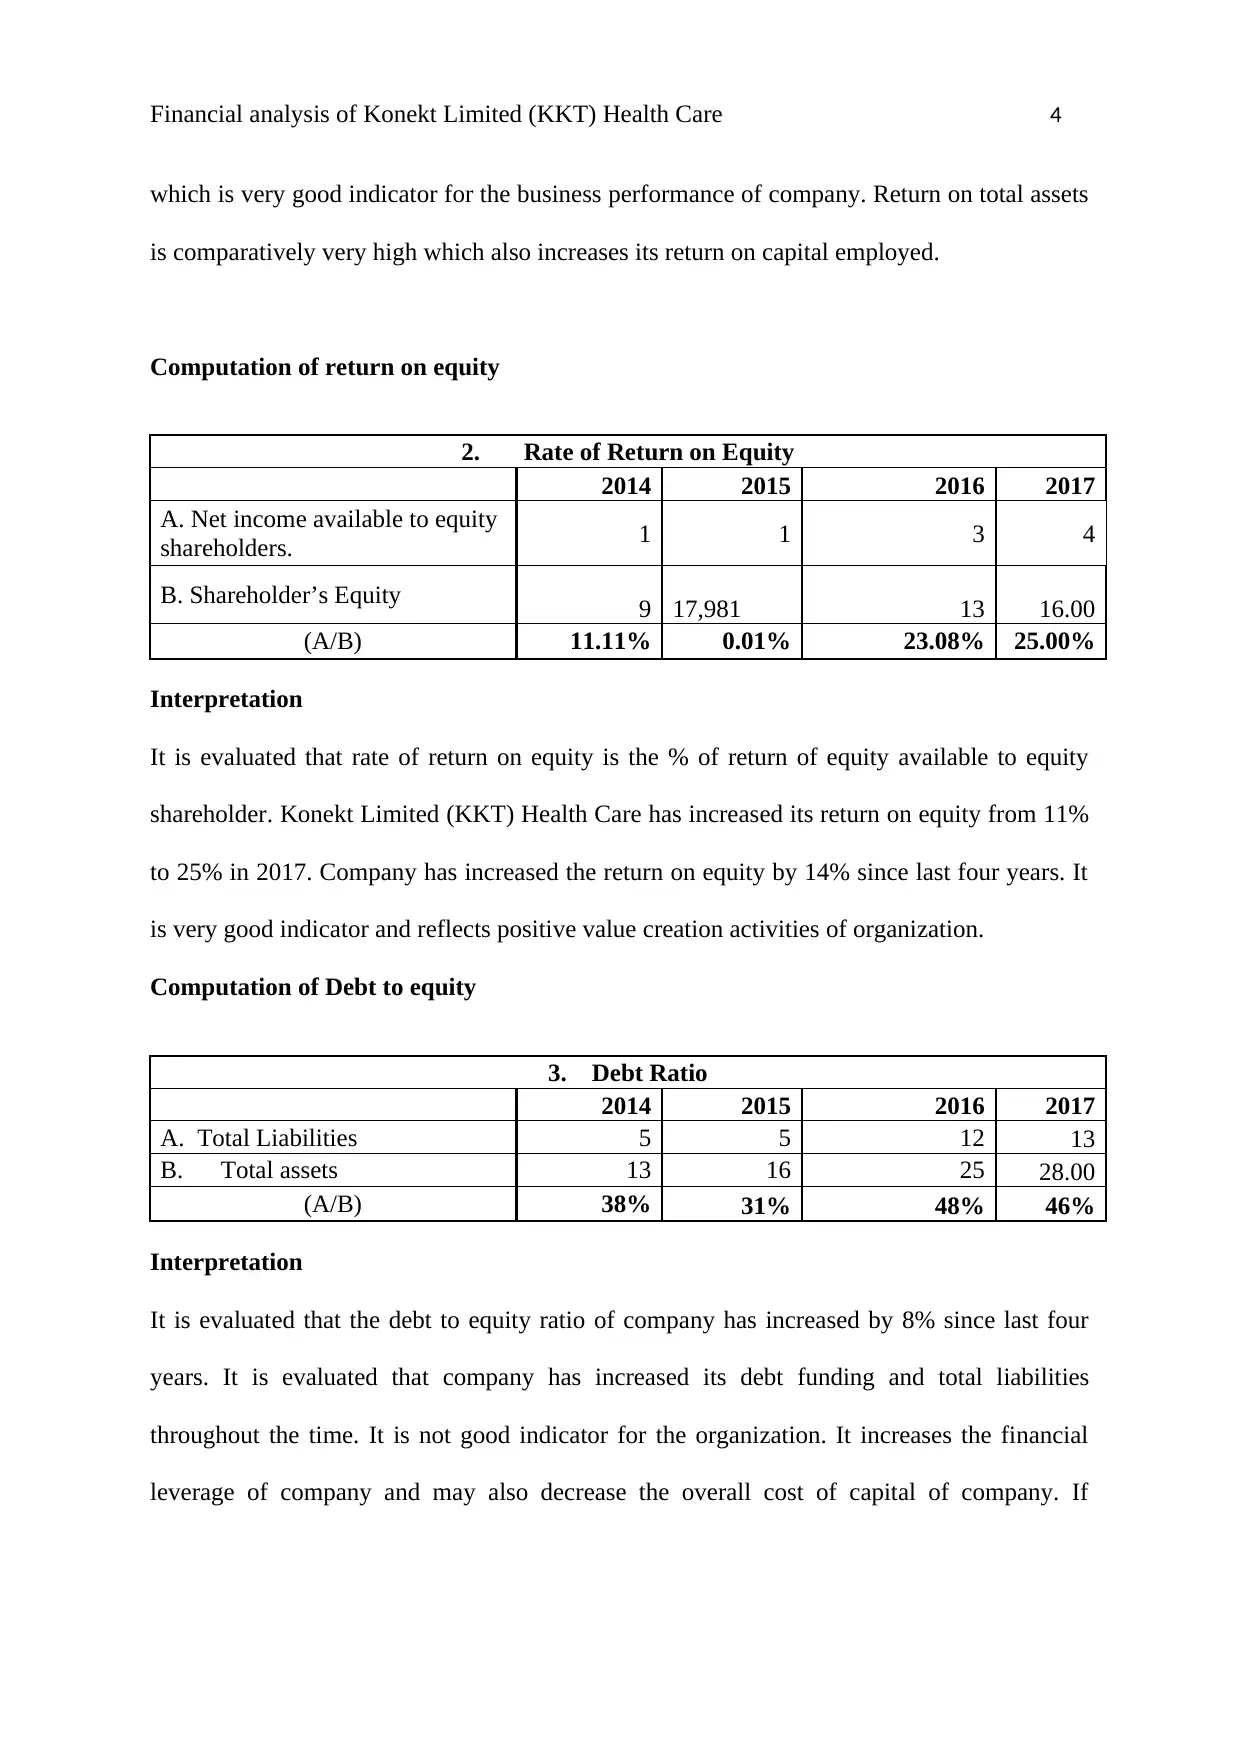
This report presents a detailed financial analysis of Konekt Limited (KKT) Health Care, evaluating its performance from 2014 to 2017. The analysis includes calculations and interpretations of key financial ratios such as Return on Assets (ROA), Return on Equity (ROE), and Debt Ratio. It also examines share price movements, beta valuation, and the Weighted Average Cost of Capital (WACC) using the Capital Asset Pricing Model (CAPM). The report investigates the company's dividend policies, investment strategies, and debt ratios. The findings indicate an increase in business efficiency and overall profitability. The report concludes with a recommendation for investors, considering both the positive aspects of the company's performance and the volatility of its share price. The references include the company's annual reports and other academic sources.

RUNNING HEAD: Financial analysis of Konekt Limited (KKT) Health Care 1
Name of the student
Topic- Financial analysis of Konekt Limited (KKT) Health Care
University name-
Name of the student
Topic- Financial analysis of Konekt Limited (KKT) Health Care
University name-
Paraphrase This Document
Need a fresh take? Get an instant paraphrase of this document with our AI Paraphraser

Financial analysis of Konekt Limited (KKT) Health Care 2
Introduction
This report has been prepared to analyse the financial performance of Konekt Limited
(KKT) Health Care. There are several financial tools such as ratio analysis, bottom up
analysis and share price movement analysis of company has been taken into consideration.
This report has reflected ownership of Konekt Limited (KKT) Health Care and how
performance ratio could help in evaluating the financial performance of Company.
1. Present description of the company
Konekt Limited (KKT) Health Care is organizational health and risk management
solutions. It has increased its share price movement throughout the time.
2. Ownership and governance structure
The CEO of company is Richard who takes all the imperative decisions.
The Gary Barber is the key persons who work as manager of company (Konekt Limited,
2015).
Owner of company

Financial analysis of Konekt Limited (KKT) Health Care 3
Calculation of ROA and ROE
Konekt Limited (KKT) Health Care
Particulars (Amount in Million 2014 2015 2016 2017
AUD$ AUD$
AU
D$
EBIT 1 2 3 4
Interest 0 0 0 0
Net profit 1 1 3 4
Total Assets 13 16 25 28.00
Total Liabilities 5 5 12 13
Shareholders' Equity 9 10 13 16.00
1. Rate of Return on Assets
2014 2015 2016 2017
A. Net income 1 1 3 4
B. Total assets 13 16 25 28
(A/B) 7.69% 6% 12% 14%
Interpretation
It is evaluated that rate of return on assets of company has increased by 100% since
last four years. It is analysed that company has increased its overall net income by 400%
⊘ This is a preview!⊘
Do you want full access?
Subscribe today to unlock all pages.

Trusted by 1+ million students worldwide

Financial analysis of Konekt Limited (KKT) Health Care 4
which is very good indicator for the business performance of company. Return on total assets
is comparatively very high which also increases its return on capital employed.
Computation of return on equity
2. Rate of Return on Equity
2014 2015 2016 2017
A. Net income available to equity
shareholders. 1 1 3 4
B. Shareholder’s Equity 9 17,981 13 16.00
(A/B) 11.11% 0.01% 23.08% 25.00%
Interpretation
It is evaluated that rate of return on equity is the % of return of equity available to equity
shareholder. Konekt Limited (KKT) Health Care has increased its return on equity from 11%
to 25% in 2017. Company has increased the return on equity by 14% since last four years. It
is very good indicator and reflects positive value creation activities of organization.
Computation of Debt to equity
3. Debt Ratio
2014 2015 2016 2017
A. Total Liabilities 5 5 12 13
B. Total assets 13 16 25 28.00
(A/B) 38% 31% 48% 46%
Interpretation
It is evaluated that the debt to equity ratio of company has increased by 8% since last four
years. It is evaluated that company has increased its debt funding and total liabilities
throughout the time. It is not good indicator for the organization. It increases the financial
leverage of company and may also decrease the overall cost of capital of company. If
Paraphrase This Document
Need a fresh take? Get an instant paraphrase of this document with our AI Paraphraser

Financial analysis of Konekt Limited (KKT) Health Care 5
company is having good amount of earning then increasing the financial leverage may be
positive for the company as it increases the overall return on capital employed.
Proving the equation
This equation has been implemented to satisfy the both equation.
EBIT
TA X NPAT
EBIT X TA
OE = NPAT
OE
Providing equation 2014 2015 2016 2017
Net profit After tax/OE 0.11111 0.1 0.23077 0.25
EBIT/TA*NPAT/EBIT*TA/OE 0.11111 0.1 0.23077 0.25
(Please see the excel sheet for the proper calculation)
The equation given above reflects equation equal to each other

Financial analysis of Konekt Limited (KKT) Health Care 6
3. Share price Movement
4.1 Graph of share price movement of Konekt Limited (KKT) Health Care
12/31/2015
2/29/2016
4/30/2016
6/30/2016
8/31/2016
10/31/2016
12/31/2016
2/28/2017
4/30/2017
6/30/2017
8/31/2017
10/31/2017
12/31/2017
-0.30
-0.20
-0.10
0.00
0.10
0.20
0.30
Average return-Konekt Limited
(KKT.AX)
Average return-Konekt
Limited (KKT.AX)
⊘ This is a preview!⊘
Do you want full access?
Subscribe today to unlock all pages.

Trusted by 1+ million students worldwide

Financial analysis of Konekt Limited (KKT) Health Care 7
4.2 Comparison of share price movement of Konekt Limited (KKT.AX) with the all
ordinary shareholders index
2/29/2016
3/31/2016
4/30/2016
5/31/2016
6/30/2016
7/31/2016
8/31/2016
9/30/2016
10/31/2016
11/30/2016
12/31/2016
1/31/2017
2/28/2017
3/31/2017
4/30/2017
5/31/2017
6/30/2017
7/31/2017
8/31/2017
9/30/2017
10/31/2017
11/30/2017
12/31/2017
-0.30
-0.20
-0.10
0.00
0.10
0.20
0.30
Average Return
Average return-Konekt Limited (KKT.AX) 0.00 0.00
Average Return 0.0000 0.0000
Comparison of share price movement of Konekt Limited (KKT.AX) with the all
ordinary shareholders index
It is analysed that share price movement of Konekt Limited (KKT.AX) is highly
fluctuated. The share price of company has high ups and down in its business which is not
good indicators for the organization. On the other hand, price movement of all ordinary
indexes has less fluctuation in the share price movement since last two years. It is analysed
that it is not good indicator for the organization as if investors investing in Konekt Limited
(KKT.AX) may face high amount of loss in their investment (Burns and Walker, 2015).
4. Announcements
1. In 2017, company has high fluctuation in its share price therefore, in order to raise capital; it
has increased its debt portion (Daunfeldt and Hartwig, 2014).
2. Company has sold its share at overvalued amount which is higher than its intrinsic value.
Paraphrase This Document
Need a fresh take? Get an instant paraphrase of this document with our AI Paraphraser

Financial analysis of Konekt Limited (KKT) Health Care 8
5. Research via internet
Stock valuation and beta valuation of company
5.1 Computation of Beta of Konekt Limited (KKT.AX
Regression
Statistics
Multiple R 0.01194041
R Square 0.00014257
Adjusted R
Square -0.0474697
Standard Error 0.10831027
Observations 23
ANOVA
df SS MS F Significance F
Regression 1 3.51284E-05 3.5E-05 0.00299 0.956877441
Residual 21 0.246353418 0.01173
Total 22 0.246388546
Coeffici
ents
Standard
Error t Stat
P-
value
Lower
95%
Upper
95%
Lower
95.0%
Upper
95.0%
Interc
ept
0.02715
672
0.024073
982
1.128
05
0.272
02
-
0.022907
861
0.077221
309
-
0.022907
861
0.077221
309
X
Varia
ble 1
0.05090
716
0.930291
691
0.054
72
0.956
88
-
1.883740
324
1.985554
638
-
1.883740
324
1.985554
638
The beta value of company is .0509. It reflects that share value of company will be
fluctuated by 50% as compared to market fluctuation in the same directions (Brigham and
Ehrhardt, 2013).

Financial analysis of Konekt Limited (KKT) Health Care 9
6.2 Computation of required rate or return of company using CAPM model
E(R) = Rf + ( β∗Rp )
E(R) = Expected rate of return
Rf = Risk free rate of return
β = Beta
Rp= Market Risk Premium (Zhu, 2014).
Calculation of Required rate of return
Risk free rate (A) 4%
Beta (B) 0.050907157
Market Risk premium (C) 6%
Required rate of return [A+(B*C)] 4.31%
(Please see the excel)
The required rate of return of company is 4.31. It is computed on the basis of computed beta,
RF and market risk premium of company (Konekt Limited (KKT) Health Care, 2017).
6.3 Determination of conservative investment
It is analysed that company has highly profitable business. Therefore, the management
department of company is more inclined towards expanding the business by increasing the
overall productivity and efficiency of business. However, instead of investing capital in other
business investment project, company has planned to invest capital in its value chain
activities. Company has followed conservative investment policy plugging back more capital
in its own business due to its own high profitable business (Daunfeldt and Hartwig, 2014).
⊘ This is a preview!⊘
Do you want full access?
Subscribe today to unlock all pages.

Trusted by 1+ million students worldwide

Financial analysis of Konekt Limited (KKT) Health Care 10
6. Computation of Weighted Average Cost of Capital (WACC)
6.1 Cost of equity (calculated above using CAPM
Cost of equity (calculated through CAPM) =
Calculation of Required rate of return
Risk free rate (A) 4%
Beta (B) 0.050907157
Market Risk premium (C) 6%
Required rate of return [A+(B*C)] 4.31%
Cost of Debt = 0%
WACC = Cost of debt (interest rate after tax) + cost of equity
WACC Capital Amount Cost of capital
% of
portion WACC
Equity 16 4.31 100% 4.31
Debt - -
Total capital 16 WACC 4.31%
The cost of debt of company has been taken as zero. As company has zero interest payment
therefore, company has zero cost of debt. The weighted average cost of capital of company is
4.31 (Konekt Limited (KKT.AX), 2016).
7.2 Implications that a higher WACC on investment decision
It is considered that if company is having higher WACC then it will impact the
investment decision of company. It is evaluated that if company has higher WACC then they
needs to accept the investment project which has higher return on investment. In this case,
Konekt Limited (KKT.AX) has 4.31% WACC. It is very good indicator for the organization.
Paraphrase This Document
Need a fresh take? Get an instant paraphrase of this document with our AI Paraphraser

Financial analysis of Konekt Limited (KKT) Health Care 11
It is considered that return on capital employed of company would be higher as company is
having less weighted average cost of capital (Yahoo finance, 2018).
7. Consideration of debt ratio for the company
8.1 Appear to be increasing
The debt ratio of company is increasing throughout the time. It is evaluated that debt
ratio of company has increased from 38% to 46% in 2017. It is not good indicator for the
organization as it will increase the overall financial leverage of company.
3. Debt Ratio
2014 2015 2016 2017
A. Total Liabilities 5 5 12 13
B. Total assets 13 16 25 28.00
(A/B) 38% 31% 48% 46%
If company is having good amount of earning then increasing the financial leverage
may be positive for the company as it increases the overall return on capital employed..
8.2 Gearing ratio discussion
It is observed that company has zero interest payment in its business. It has
maintained zero gearing ratios (Konekt Limited (KKT) Health Care, 2014)
Gearing Ratio
2014 2015 2016 2017
Gearing Ratio 0 0 0 0
8. Divided policies of company
Konekt Limited (KKT) Health Care has adopted profit based dividend policy. It is
observed that company has paid increased dividend amount to its shareholder with the

Financial analysis of Konekt Limited (KKT) Health Care 12
increasing net profit. It is observed that company has increased dividend payment to its
shareholders which is very good indicator for the strong value of the company.
9. Letter of recommendation
All the details and analysis made in this report has reflected that Konekt Limited (KKT)
Health Care has increased its business efficiency and overall profitability of company has
also increased by 100% since last four years. Therefore, it could be determined that investors
should invest their capital in Konekt Limited (KKT) Health Care to create value. However,
the share price movement is very high which not good indicator is for the investors. It is
considered that investors should invest in Konekt Limited (KKT) Health Care for long run
only for creating value on the investment.
⊘ This is a preview!⊘
Do you want full access?
Subscribe today to unlock all pages.

Trusted by 1+ million students worldwide
1 out of 17
Related Documents
Your All-in-One AI-Powered Toolkit for Academic Success.
+13062052269
info@desklib.com
Available 24*7 on WhatsApp / Email
Unlock your academic potential
Copyright © 2020–2025 A2Z Services. All Rights Reserved. Developed and managed by ZUCOL.


