Evaluating Financial Performance: Targets, KPIs, and Ratios Analysis
VerifiedAdded on 2022/11/24
|10
|843
|286
Report
AI Summary
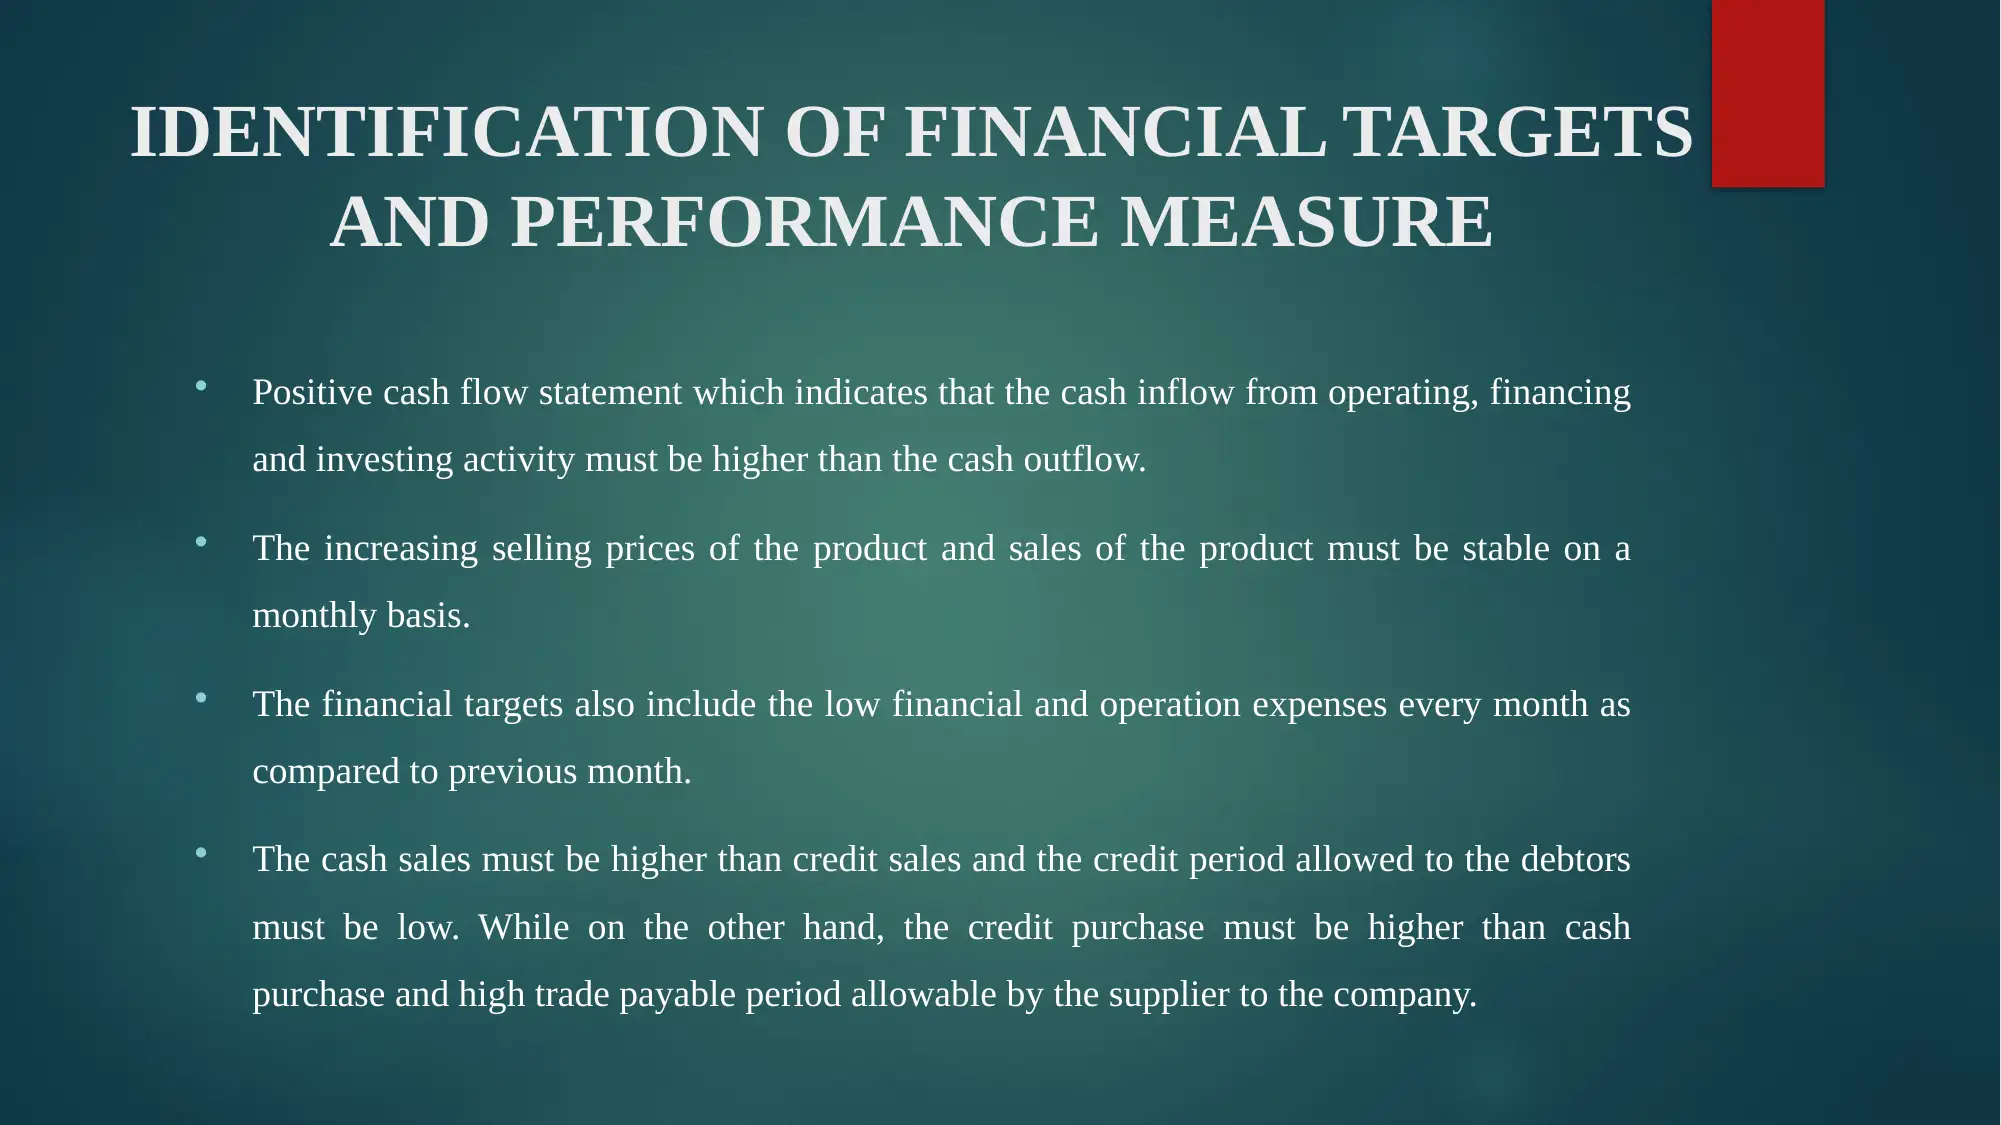
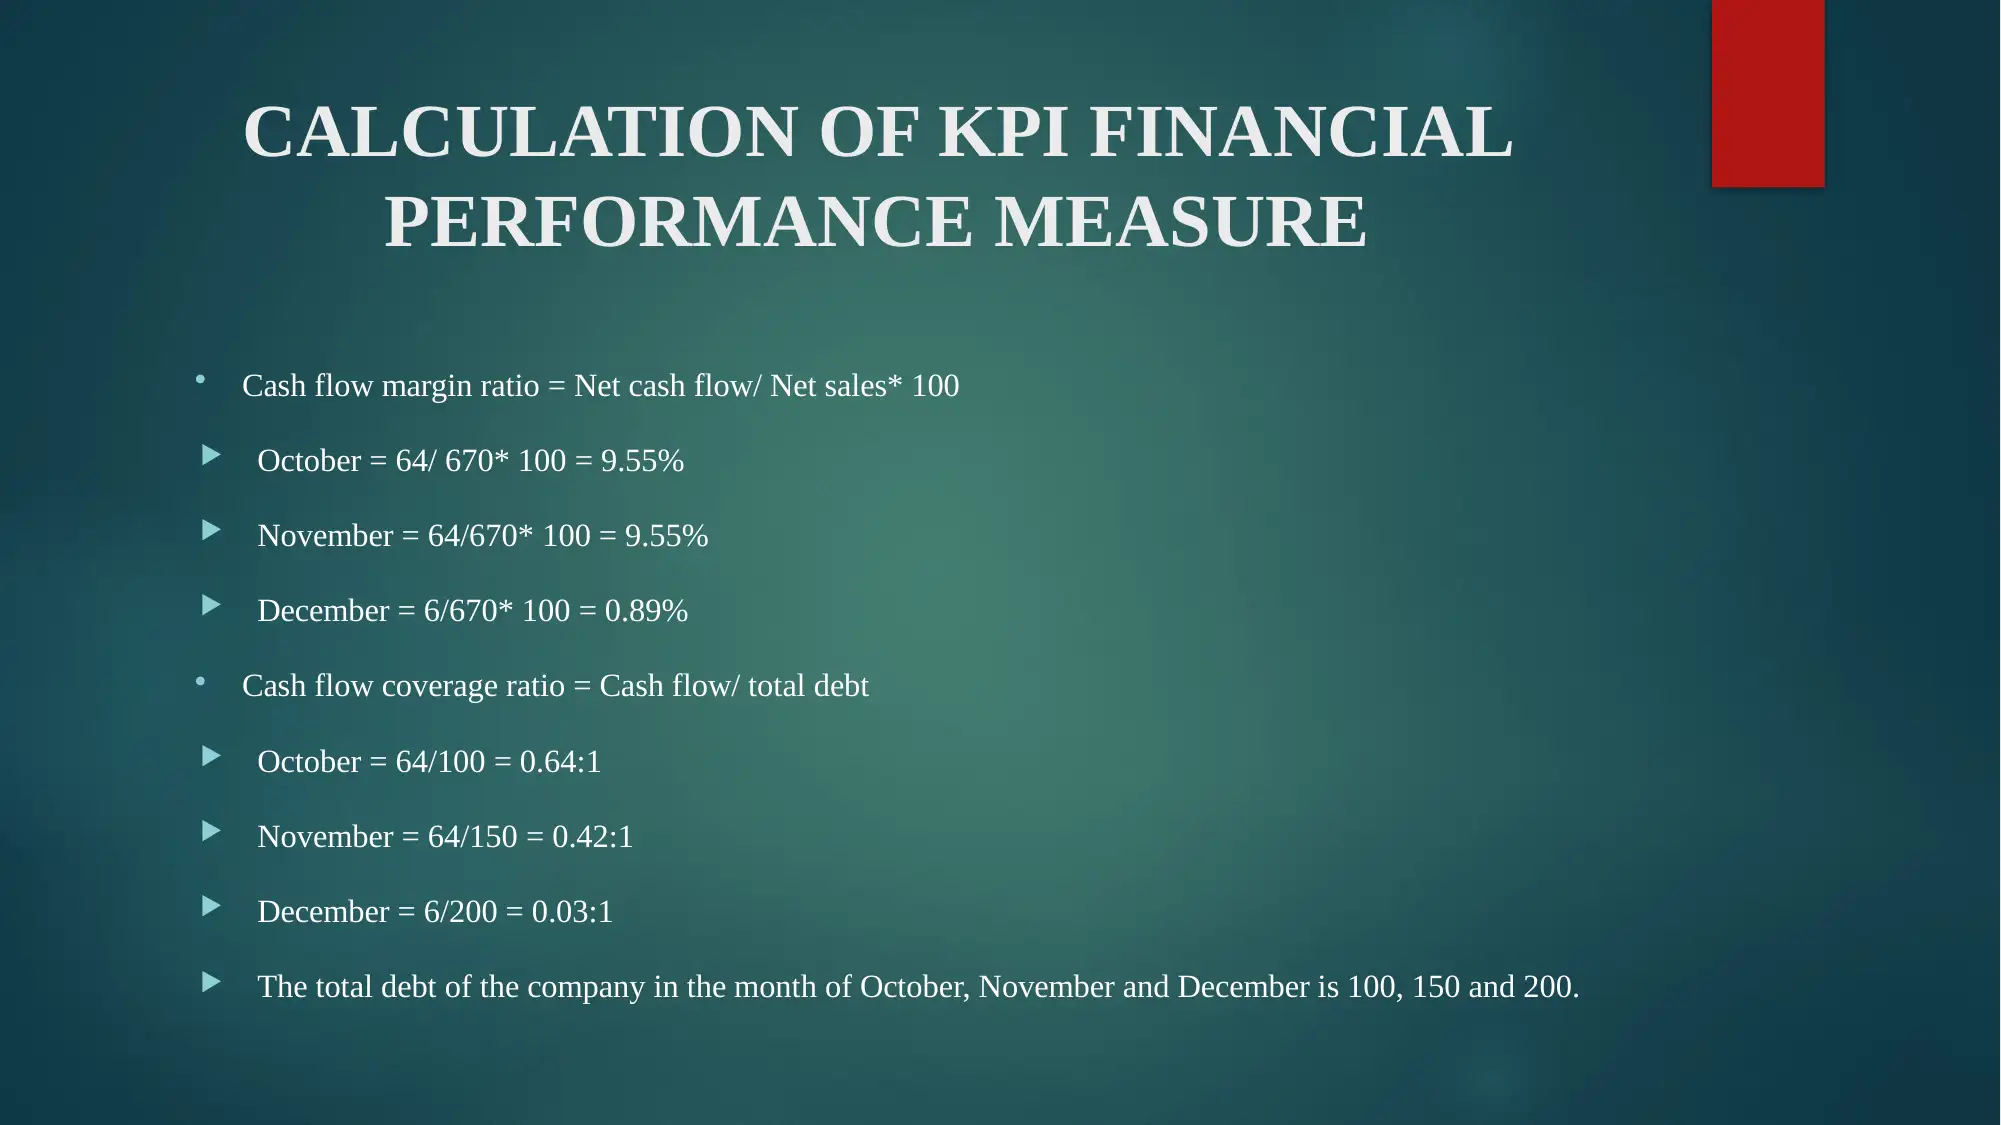
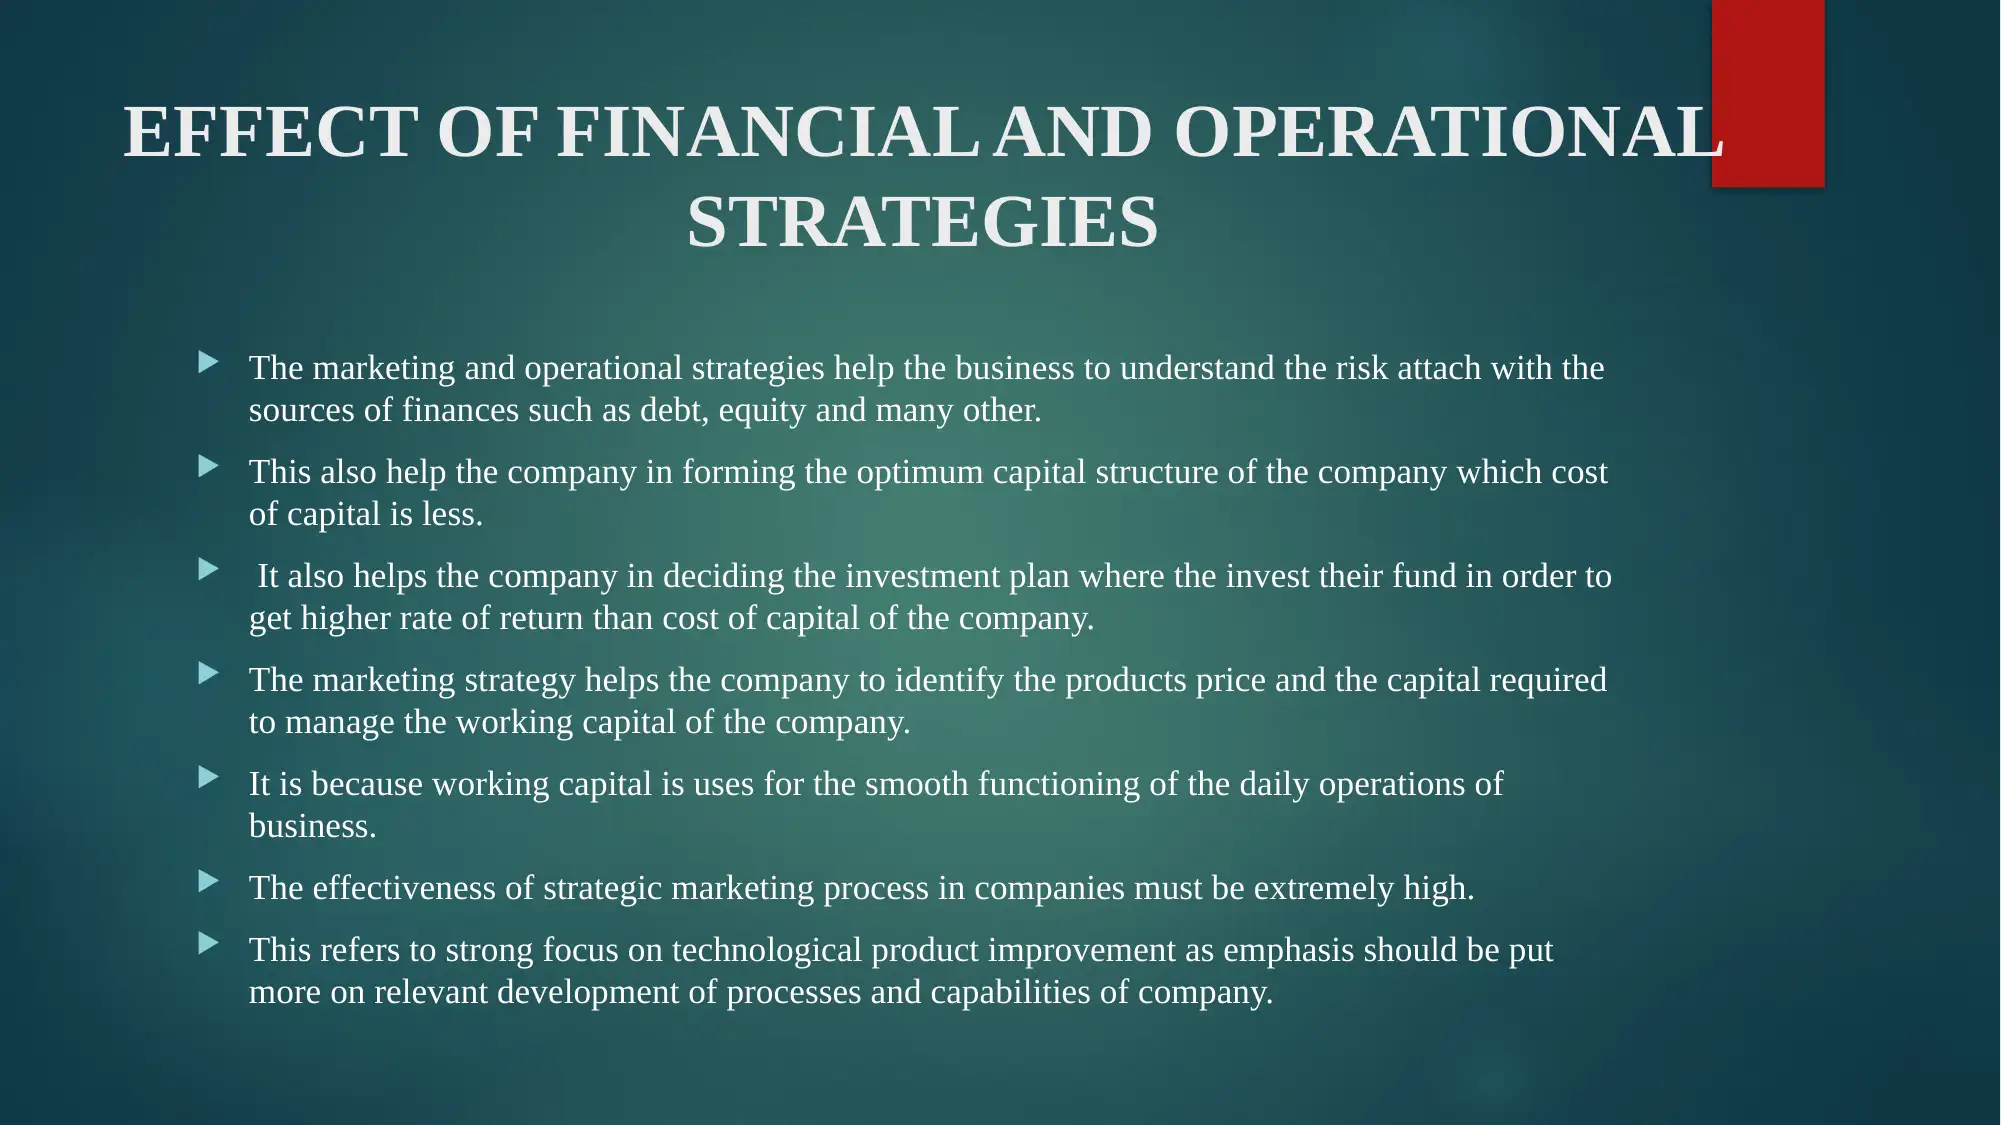
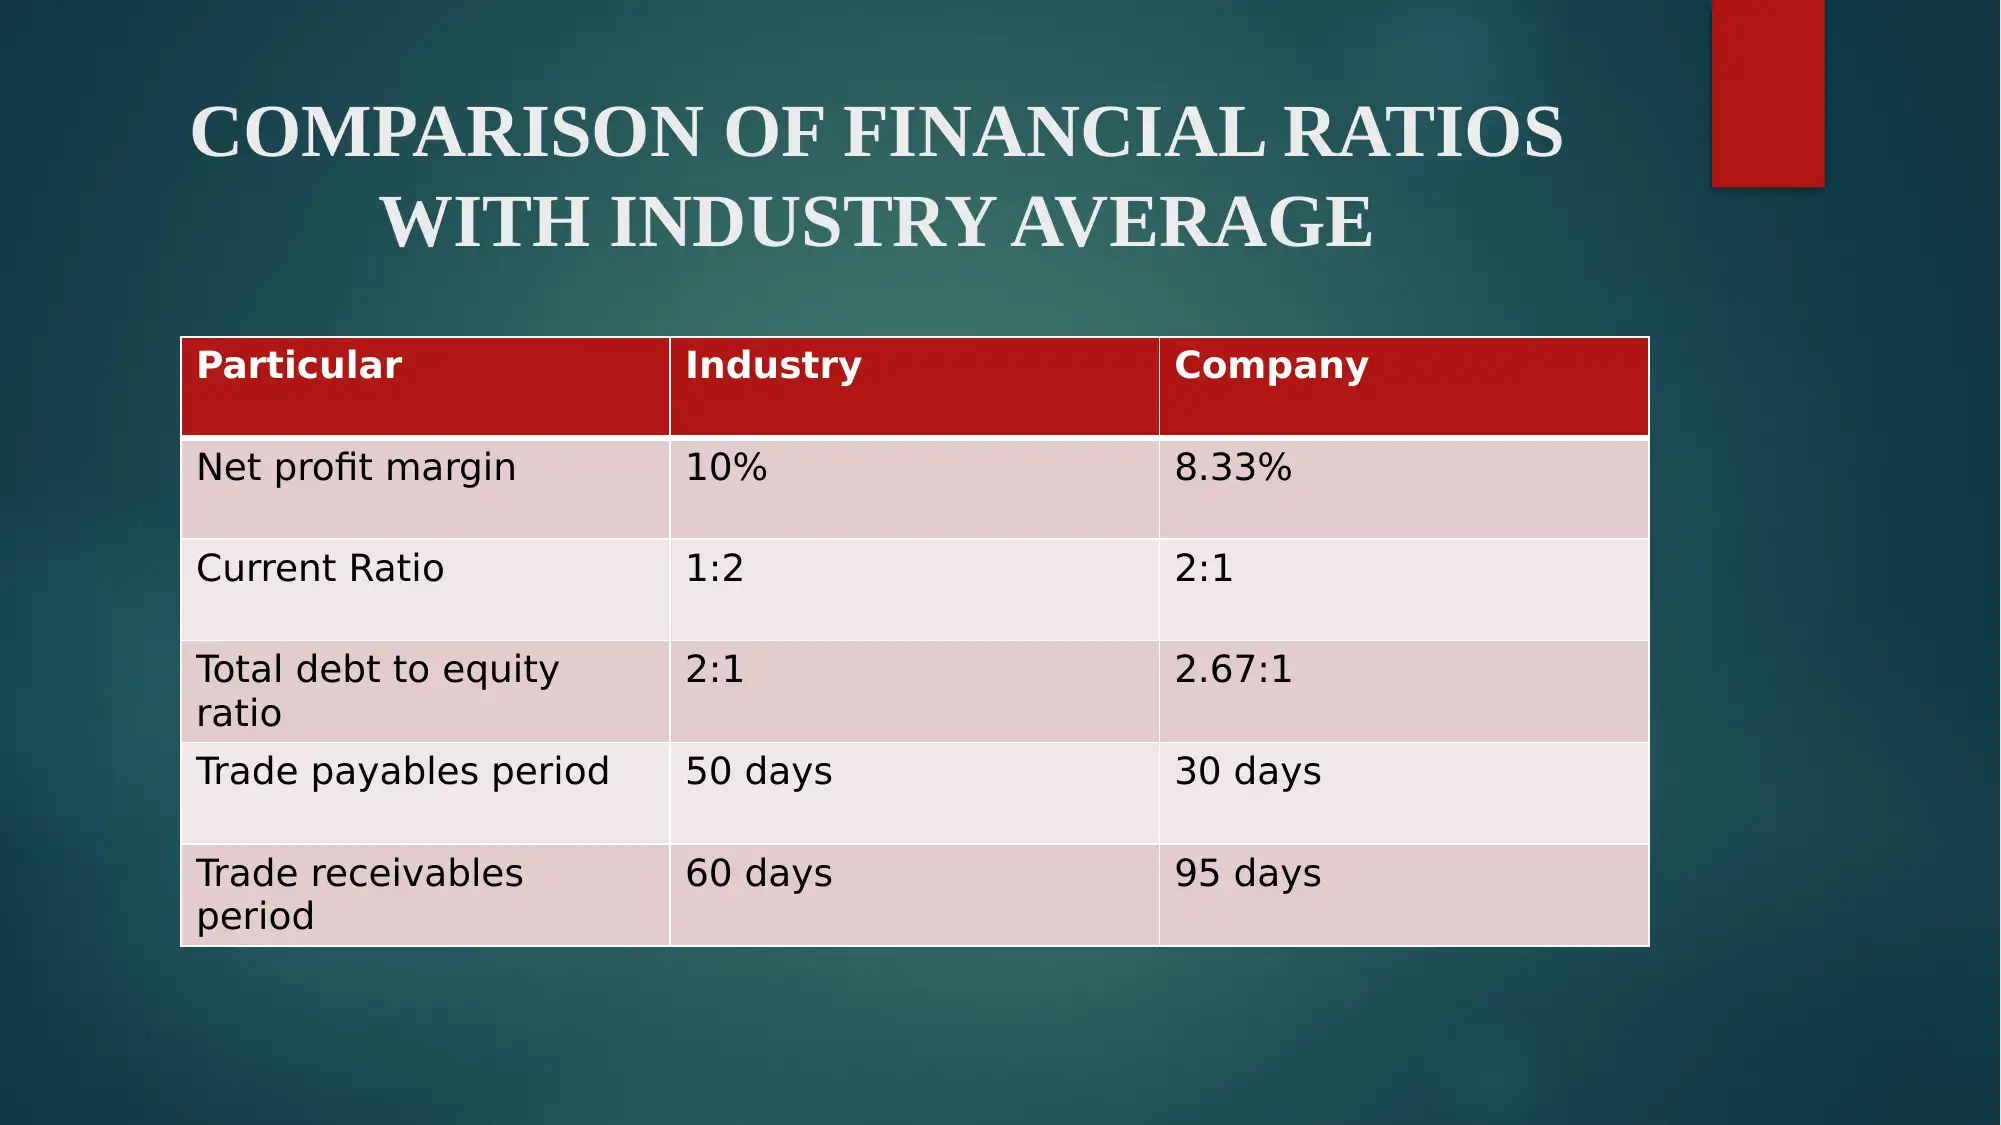
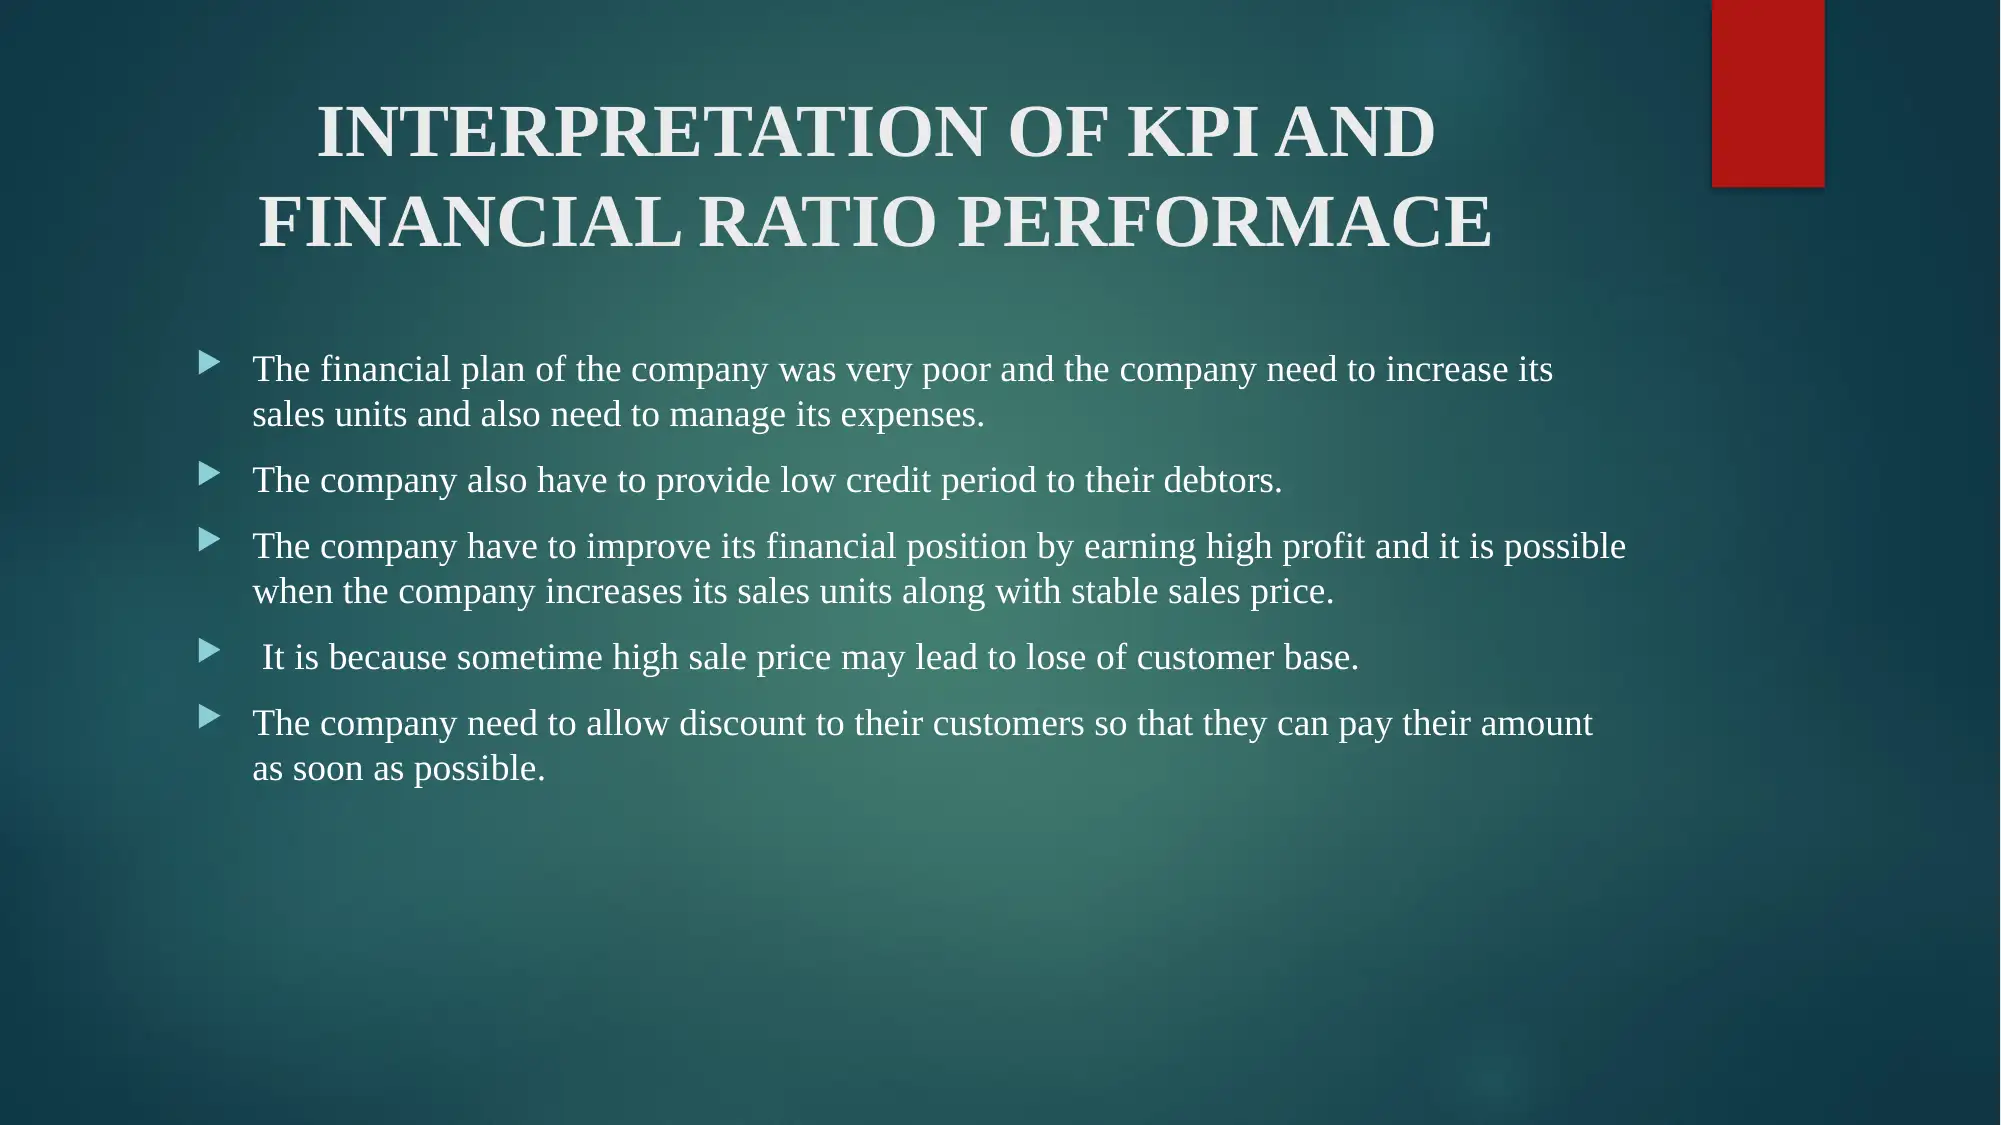
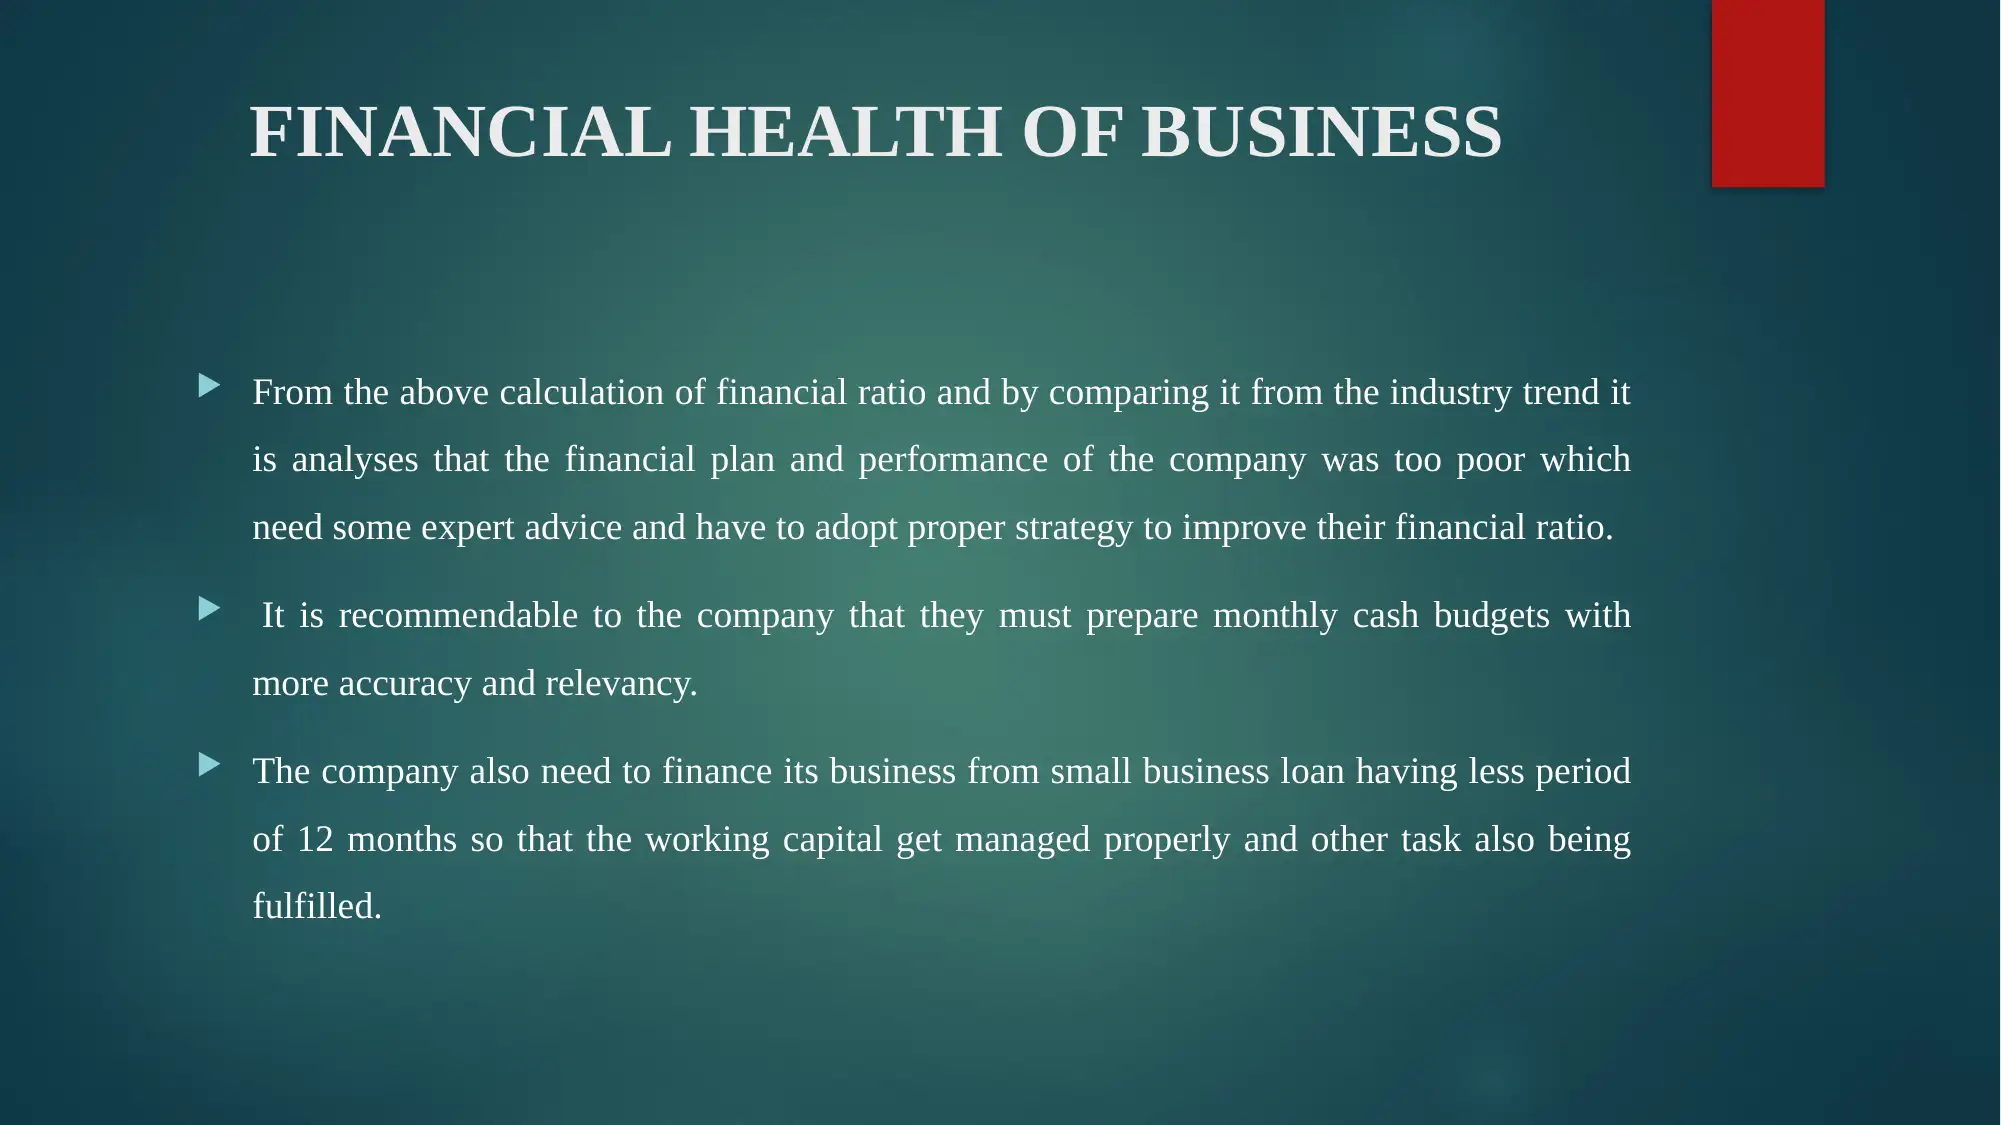
This report identifies financial targets and performance measures for a small business, calculates key performance indicators (KPIs) such as cash flow margin and coverage ratios, and examines the effect of financial and operational strategies. It compares financial ratios like net profit margin, current ratio, and debt-to-equity ratio with industry averages, interpreting KPI and financial ratio performance to assess the financial health of the business. The analysis reveals potential weaknesses in the company's financial planning and suggests improvements, including better cash budgeting and short-term financing strategies, referencing several academic sources to support its findings.

MANAGE SMALL BUSINESS FINANCE
Paraphrase This Document
Need a fresh take? Get an instant paraphrase of this document with our AI Paraphraser

TABLE OF CONTENT
Identification of financial targets and performance measure
Calculation of KPI financial performance measure
Effect of financial and operational strategies
Comparison of financial ratio with industry average
Interpretation of KPI and Financial ratio performance
Financial Health of business
References

IDENTIFICATION OF FINANCIAL TARGETS
AND PERFORMANCE MEASURE
Positive cash flow statement which indicates that the cash inflow from operating, financing
and investing activity must be higher than the cash outflow.
The increasing selling prices of the product and sales of the product must be stable on a
monthly basis.
The financial targets also include the low financial and operation expenses every month as
compared to previous month.
The cash sales must be higher than credit sales and the credit period allowed to the debtors
must be low. While on the other hand, the credit purchase must be higher than cash
purchase and high trade payable period allowable by the supplier to the company.
⊘ This is a preview!⊘
Do you want full access?
Subscribe today to unlock all pages.

Trusted by 1+ million students worldwide

CALCULATION OF KPI FINANCIAL
PERFORMANCE MEASURE
Cash flow margin ratio = Net cash flow/ Net sales* 100
October = 64/ 670* 100 = 9.55%
November = 64/670* 100 = 9.55%
December = 6/670* 100 = 0.89%
Cash flow coverage ratio = Cash flow/ total debt
October = 64/100 = 0.64:1
November = 64/150 = 0.42:1
December = 6/200 = 0.03:1
The total debt of the company in the month of October, November and December is 100, 150 and 200.
Paraphrase This Document
Need a fresh take? Get an instant paraphrase of this document with our AI Paraphraser

EFFECT OF FINANCIAL AND OPERATIONAL
STRATEGIES
The marketing and operational strategies help the business to understand the risk attach with the
sources of finances such as debt, equity and many other.
This also help the company in forming the optimum capital structure of the company which cost
of capital is less.
It also helps the company in deciding the investment plan where the invest their fund in order to
get higher rate of return than cost of capital of the company.
The marketing strategy helps the company to identify the products price and the capital required
to manage the working capital of the company.
It is because working capital is uses for the smooth functioning of the daily operations of
business.
The effectiveness of strategic marketing process in companies must be extremely high.
This refers to strong focus on technological product improvement as emphasis should be put
more on relevant development of processes and capabilities of company.

COMPARISON OF FINANCIAL RATIOS
WITH INDUSTRY AVERAGE
Particular Industry Company
Net profit margin 10% 8.33%
Current Ratio 1:2 2:1
Total debt to equity
ratio
2:1 2.67:1
Trade payables period 50 days 30 days
Trade receivables
period
60 days 95 days
WITH INDUSTRY AVERAGE
Particular Industry Company
Net profit margin 10% 8.33%
Current Ratio 1:2 2:1
Total debt to equity
ratio
2:1 2.67:1
Trade payables period 50 days 30 days
Trade receivables
period
60 days 95 days
⊘ This is a preview!⊘
Do you want full access?
Subscribe today to unlock all pages.

Trusted by 1+ million students worldwide

INTERPRETATION OF KPI AND
FINANCIAL RATIO PERFORMACE
The financial plan of the company was very poor and the company need to increase its
sales units and also need to manage its expenses.
The company also have to provide low credit period to their debtors.
The company have to improve its financial position by earning high profit and it is possible
when the company increases its sales units along with stable sales price.
It is because sometime high sale price may lead to lose of customer base.
The company need to allow discount to their customers so that they can pay their amount
as soon as possible.
Paraphrase This Document
Need a fresh take? Get an instant paraphrase of this document with our AI Paraphraser

FINANCIAL HEALTH OF BUSINESS
From the above calculation of financial ratio and by comparing it from the industry trend it
is analyses that the financial plan and performance of the company was too poor which
need some expert advice and have to adopt proper strategy to improve their financial ratio.
It is recommendable to the company that they must prepare monthly cash budgets with
more accuracy and relevancy.
The company also need to finance its business from small business loan having less period
of 12 months so that the working capital get managed properly and other task also being
fulfilled.

REFERENCES
Spulbar, C. and Birau, R. eds., 2019. Emerging research on monetary policy, banking, and financial
markets. IGI Global.
Shahzad, S. J. H. and et.al., 2017. Journal of International Financial Markets, Institutions & Money.
Matkovskyy, R., Jalan, A. and Dowling, M., 2020. Effects of economic policy uncertainty shocks on
the interdependence between Bitcoin and traditional financial markets. The Quarterly Review of
Economics and Finance. 77. pp.150-155.
Negi, V., 2017. Changes in international financial markets and its implications for the developing
countries.
Ferrara, F. M. and Sattler, T., 2018. The political economy of financial markets.
⊘ This is a preview!⊘
Do you want full access?
Subscribe today to unlock all pages.

Trusted by 1+ million students worldwide

THANK YOU
1 out of 10
Related Documents

Your All-in-One AI-Powered Toolkit for Academic Success.
+13062052269
info@desklib.com
Available 24*7 on WhatsApp / Email
Unlock your academic potential
Copyright © 2020–2025 A2Z Services. All Rights Reserved. Developed and managed by ZUCOL.