Comprehensive Financial Analysis and Performance Report for KYCKR Ltd
VerifiedAdded on 2021/06/17
|20
|3984
|87
Report
AI Summary
This report provides a detailed financial analysis of KYCKR Ltd, a global business register. It examines the company's ownership structure, including substantial shareholdings and key personnel involved in governance. The report calculates various financial ratios, including liquidity, leverage, efficiency, profitability, and market value ratios, to assess KYCKR Ltd's financial health. It also analyzes share price movements, identifies factors influencing these movements (such as company focus, macroeconomic factors, and industry risks), and calculates the beta value and required rate of return using the Capital Asset Pricing Model (CAPM). Furthermore, the report computes the Weighted Average Cost of Capital (WACC), discusses the implications of a higher WACC on investment prospects, assesses the company's debt ratio, and analyzes its dividend policy. Finally, the report offers recommendations to potential investors regarding the viability of investing in KYCKR Ltd.
Running head: FINANCE FOR BUSINESS
Finance for Business
Name of the Student
Name of the University
Authors Note
Course ID
Finance for Business
Name of the Student
Name of the University
Authors Note
Course ID
Paraphrase This Document
Need a fresh take? Get an instant paraphrase of this document with our AI Paraphraser
1FINANCE FOR BUSINESS
Table of Contents
Introduction:...............................................................................................................................2
Description of the Company:.....................................................................................................2
Corporate Governance Structure and Ownership:.....................................................................3
Substantial Shareholdings:.....................................................................................................3
Major people involved in the governance of the Firm:..........................................................4
Calculations of the Fundamental Ratios:...................................................................................5
Liquidity Ratios:.....................................................................................................................5
Financial Leverage Ratios:.....................................................................................................6
Efficiency Ratio:....................................................................................................................6
Profitability Ratios:................................................................................................................7
Market Value Ratios:.............................................................................................................7
Description of Results through Share Price Movement:........................................................8
Significant factor influencing the share price movement of the company are stated below:....9
Calculations of the Beta values and the anticipated rate of return by employing CAPM:......10
Computation of Beta Values................................................................................................10
Computation of Required Rate of Return:...........................................................................10
Conservative Investment:.....................................................................................................11
Computation of the Weighted Average Cost of Capital:.....................................................12
Implications of higher WACC on the management evaluations of investment prospects:..12
Debt ratio of KYCKR Ltd:.......................................................................................................13
2FINANCE FOR BUSINESS
Dividend Policy:.......................................................................................................................14
Letter of Recommendations:....................................................................................................14
Conclusion:..............................................................................................................................15
Reference list:...........................................................................................................................16
⊘ This is a preview!⊘
Do you want full access?
Subscribe today to unlock all pages.
Trusted by 1+ million students worldwide
3FINANCE FOR BUSINESS
Introduction:
The report is based on understanding the financial performance of the KYCKR Ltd
and providing the necessary financial advice to the investors so that a viability related to
sound investment can be provided. The report would be focusing on the segments of
ownership of the KYCKR Ltd along with a descriptive summary of the overall existence. To
better gauge into the financial performance of the KYCKR Ltd a computation of ratios has
been performed to understand the liquidity, profitability, solvency, market leverage and
gearing of KYCKR Ltd. The movement in the share prices would be reflected with the help
of the graphical description of the results for KYCKR Ltd.
The study would also place emphasis on the significant factors that would be creating
an influence on the share price of the KYCKR Ltd. Additionally, to support the identified
factors of share price movement a weighted average cost of capital will be computed that
would highlight the required the rate of return for KYCKR Ltd. Emphasis would also be
placed on the debt ratio for the KYCKR Ltd to understand whether the company has followed
debt structure in the management of its capital. Analysis of the dividend policy would be
made for KYCKR Ltd and a letter of recommendations would be provided to address the
potential investors regarding the viability of making investment in KYCKR Ltd.
Description of the Company:
KYCKR Ltd is regarded as the worldwide business register that is established in
Waterford, Ireland from the year 2007. KYCKR Ltd is controlled and publicly traded
company on the Australian Securities Exchange (Kyckr 2018). The business of KYCKR Ltd
began with the simple idea of creating a business for the customers that could obtain the
access in real time from several countries across the Europe. Ben Cronin and Robert Leslie
Paraphrase This Document
Need a fresh take? Get an instant paraphrase of this document with our AI Paraphraser
4FINANCE FOR BUSINESS
are regarded as the founder of the KYCKR Ltd with the initial idea of creating a Global
Business Register Limited in the year 2007.
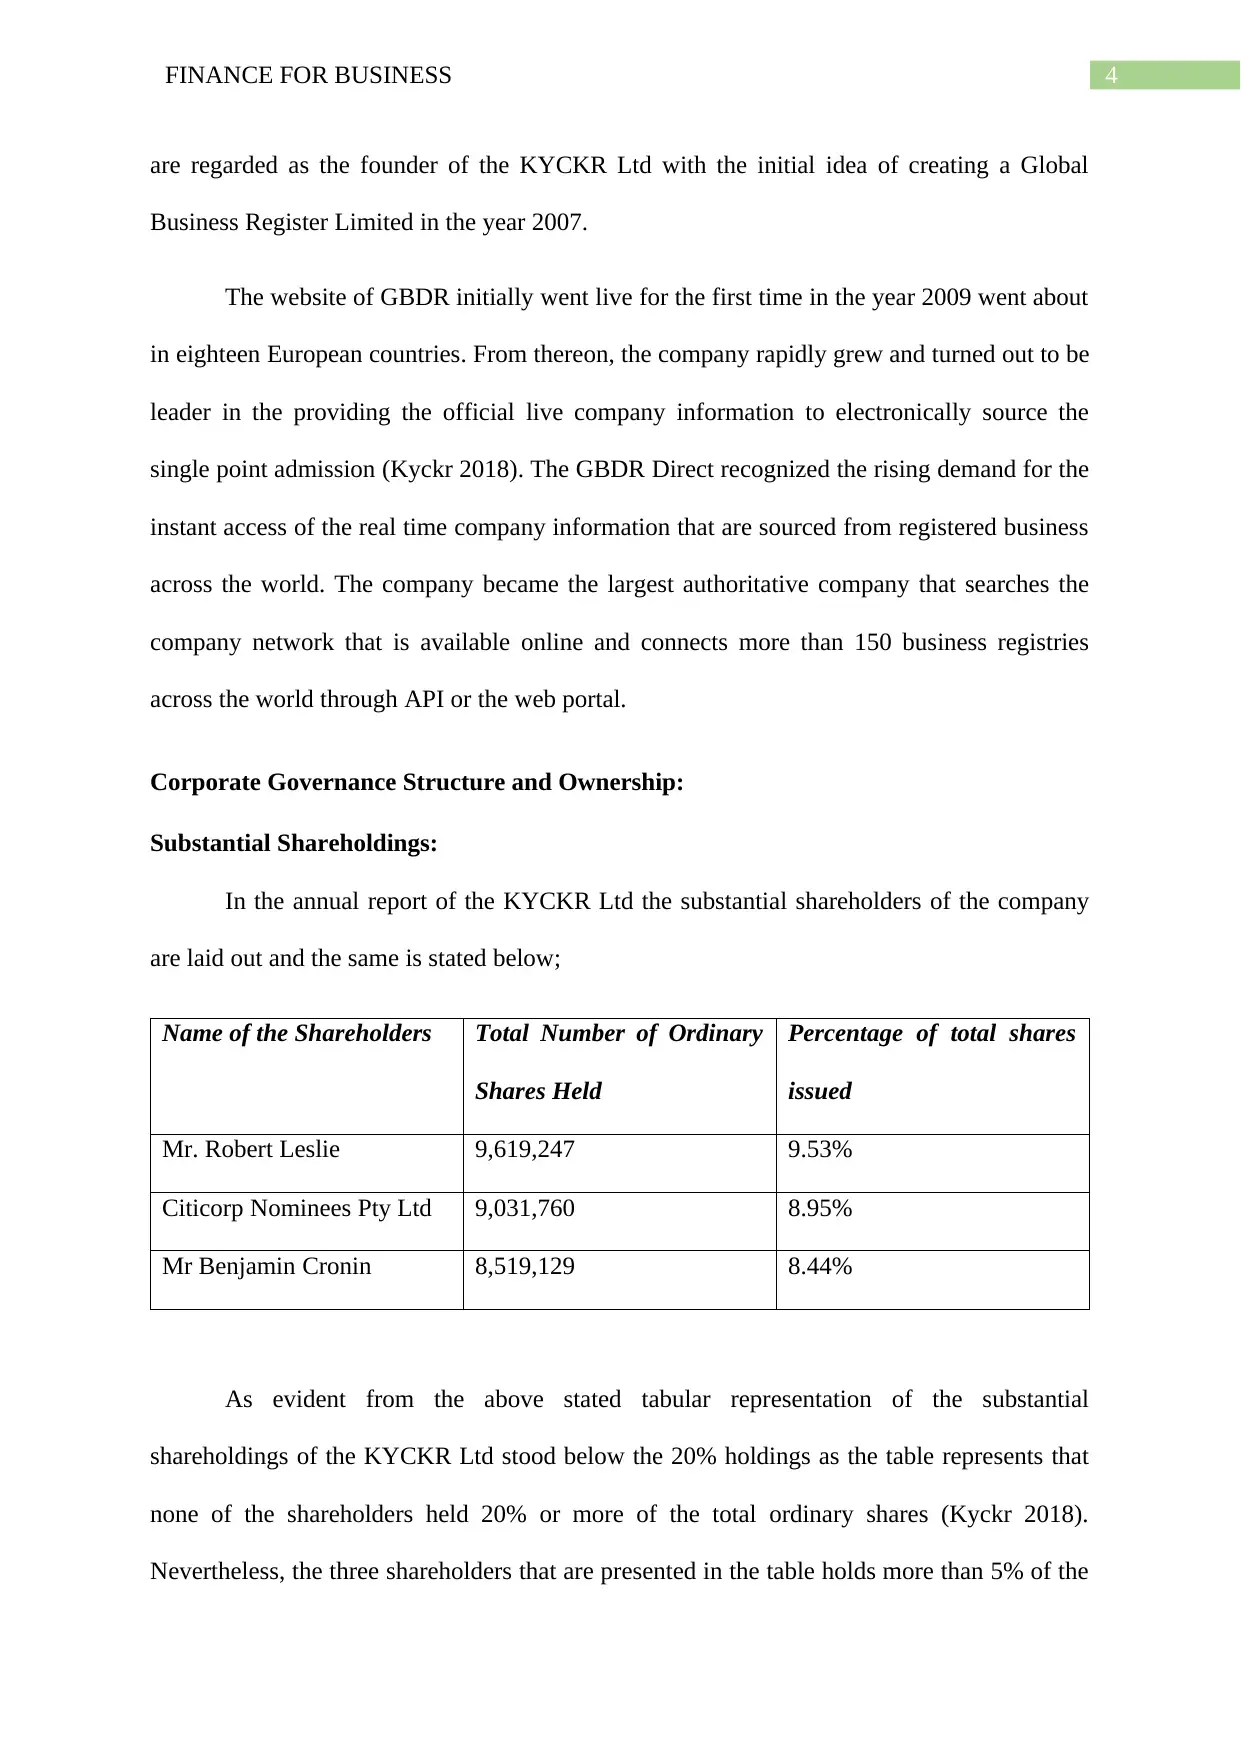
The website of GBDR initially went live for the first time in the year 2009 went about
in eighteen European countries. From thereon, the company rapidly grew and turned out to be
leader in the providing the official live company information to electronically source the
single point admission (Kyckr 2018). The GBDR Direct recognized the rising demand for the
instant access of the real time company information that are sourced from registered business
across the world. The company became the largest authoritative company that searches the
company network that is available online and connects more than 150 business registries
across the world through API or the web portal.
Corporate Governance Structure and Ownership:
Substantial Shareholdings:
In the annual report of the KYCKR Ltd the substantial shareholders of the company
are laid out and the same is stated below;
Name of the Shareholders Total Number of Ordinary
Shares Held
Percentage of total shares
issued
Mr. Robert Leslie 9,619,247 9.53%
Citicorp Nominees Pty Ltd 9,031,760 8.95%
Mr Benjamin Cronin 8,519,129 8.44%
As evident from the above stated tabular representation of the substantial
shareholdings of the KYCKR Ltd stood below the 20% holdings as the table represents that
none of the shareholders held 20% or more of the total ordinary shares (Kyckr 2018).
Nevertheless, the three shareholders that are presented in the table holds more than 5% of the
are regarded as the founder of the KYCKR Ltd with the initial idea of creating a Global
Business Register Limited in the year 2007.
The website of GBDR initially went live for the first time in the year 2009 went about
in eighteen European countries. From thereon, the company rapidly grew and turned out to be
leader in the providing the official live company information to electronically source the
single point admission (Kyckr 2018). The GBDR Direct recognized the rising demand for the
instant access of the real time company information that are sourced from registered business
across the world. The company became the largest authoritative company that searches the
company network that is available online and connects more than 150 business registries
across the world through API or the web portal.
Corporate Governance Structure and Ownership:
Substantial Shareholdings:
In the annual report of the KYCKR Ltd the substantial shareholders of the company
are laid out and the same is stated below;
Name of the Shareholders Total Number of Ordinary
Shares Held
Percentage of total shares
issued
Mr. Robert Leslie 9,619,247 9.53%
Citicorp Nominees Pty Ltd 9,031,760 8.95%
Mr Benjamin Cronin 8,519,129 8.44%
As evident from the above stated tabular representation of the substantial
shareholdings of the KYCKR Ltd stood below the 20% holdings as the table represents that
none of the shareholders held 20% or more of the total ordinary shares (Kyckr 2018).
Nevertheless, the three shareholders that are presented in the table holds more than 5% of the
5FINANCE FOR BUSINESS
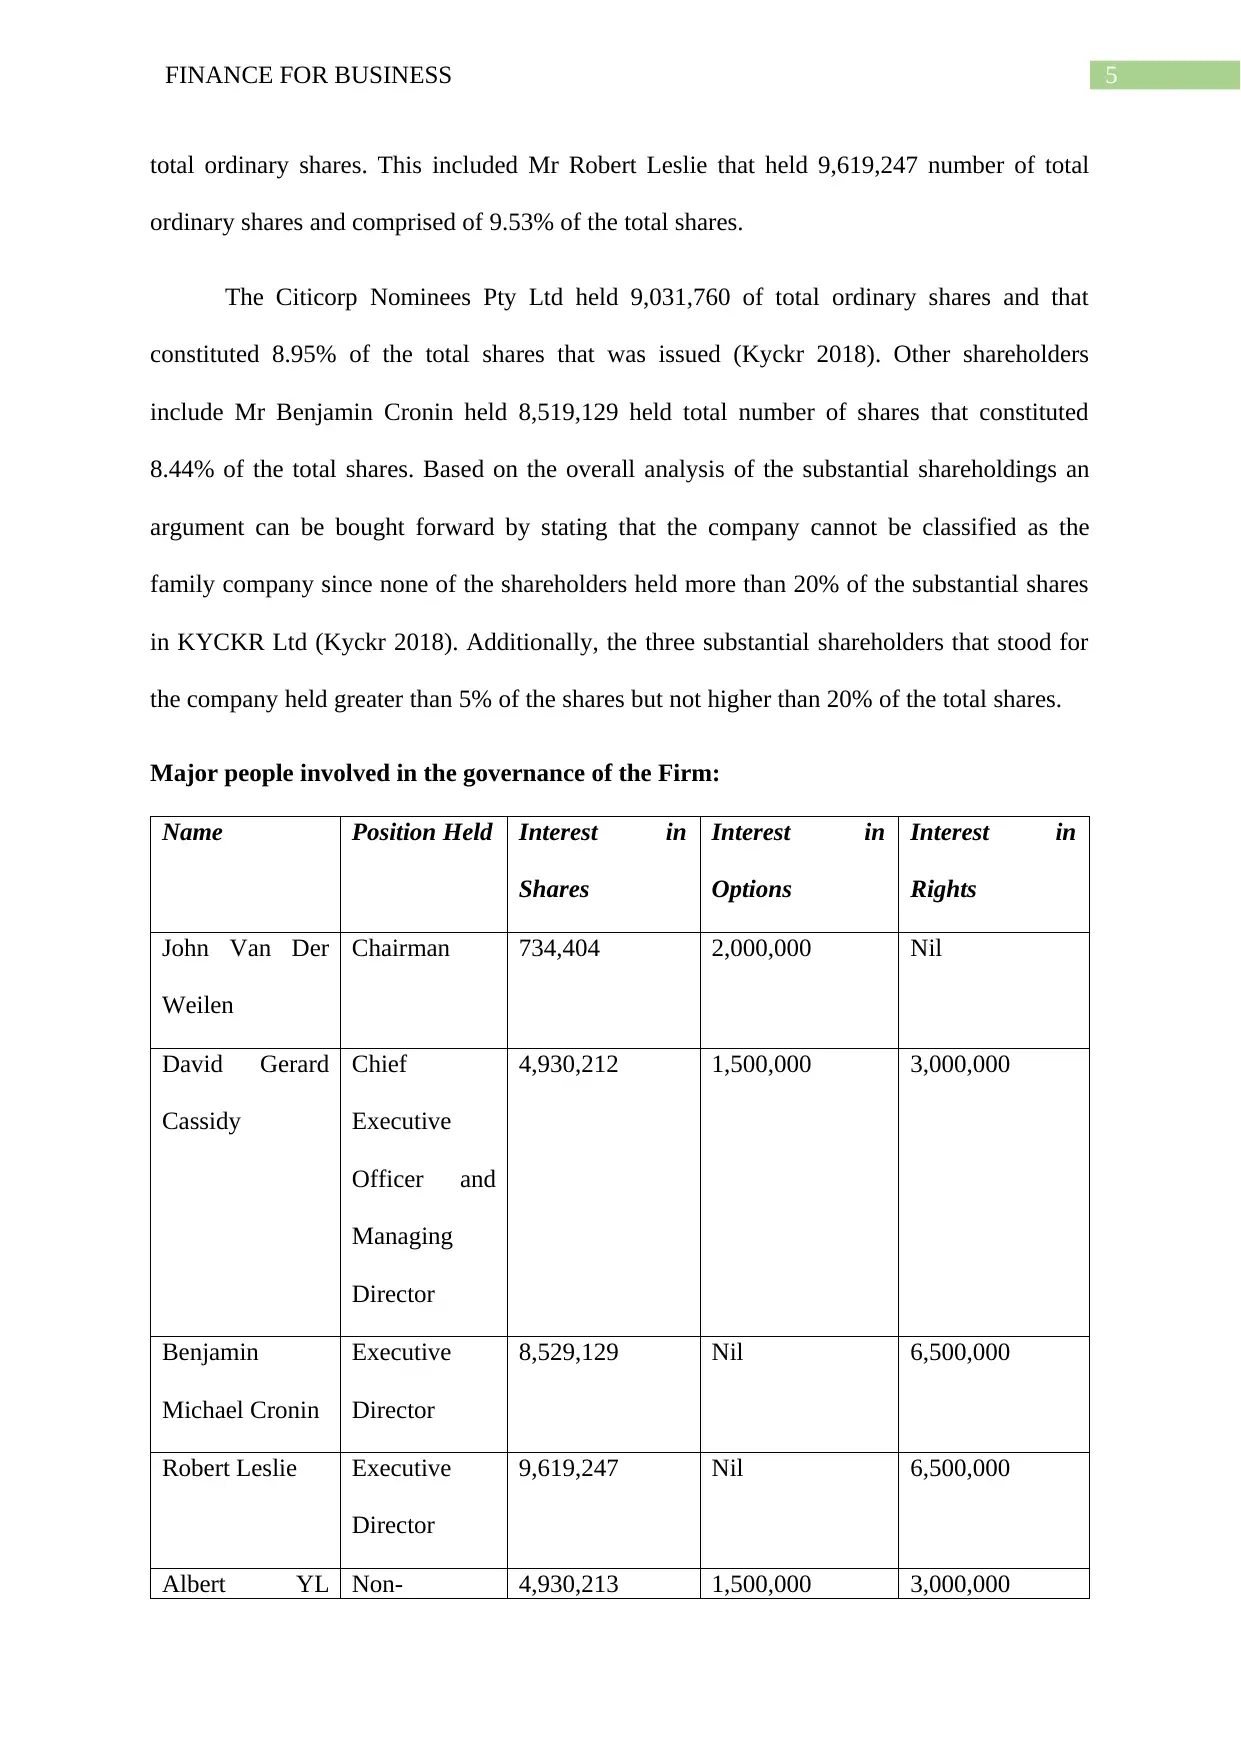
total ordinary shares. This included Mr Robert Leslie that held 9,619,247 number of total
ordinary shares and comprised of 9.53% of the total shares.
The Citicorp Nominees Pty Ltd held 9,031,760 of total ordinary shares and that
constituted 8.95% of the total shares that was issued (Kyckr 2018). Other shareholders
include Mr Benjamin Cronin held 8,519,129 held total number of shares that constituted
8.44% of the total shares. Based on the overall analysis of the substantial shareholdings an
argument can be bought forward by stating that the company cannot be classified as the
family company since none of the shareholders held more than 20% of the substantial shares
in KYCKR Ltd (Kyckr 2018). Additionally, the three substantial shareholders that stood for
the company held greater than 5% of the shares but not higher than 20% of the total shares.
Major people involved in the governance of the Firm:
Name Position Held Interest in
Shares
Interest in
Options
Interest in
Rights
John Van Der
Weilen
Chairman 734,404 2,000,000 Nil
David Gerard
Cassidy
Chief
Executive
Officer and
Managing
Director
4,930,212 1,500,000 3,000,000
Benjamin
Michael Cronin
Executive
Director
8,529,129 Nil 6,500,000
Robert Leslie Executive
Director
9,619,247 Nil 6,500,000
Albert YL Non- 4,930,213 1,500,000 3,000,000
⊘ This is a preview!⊘
Do you want full access?
Subscribe today to unlock all pages.
Trusted by 1+ million students worldwide
6FINANCE FOR BUSINESS
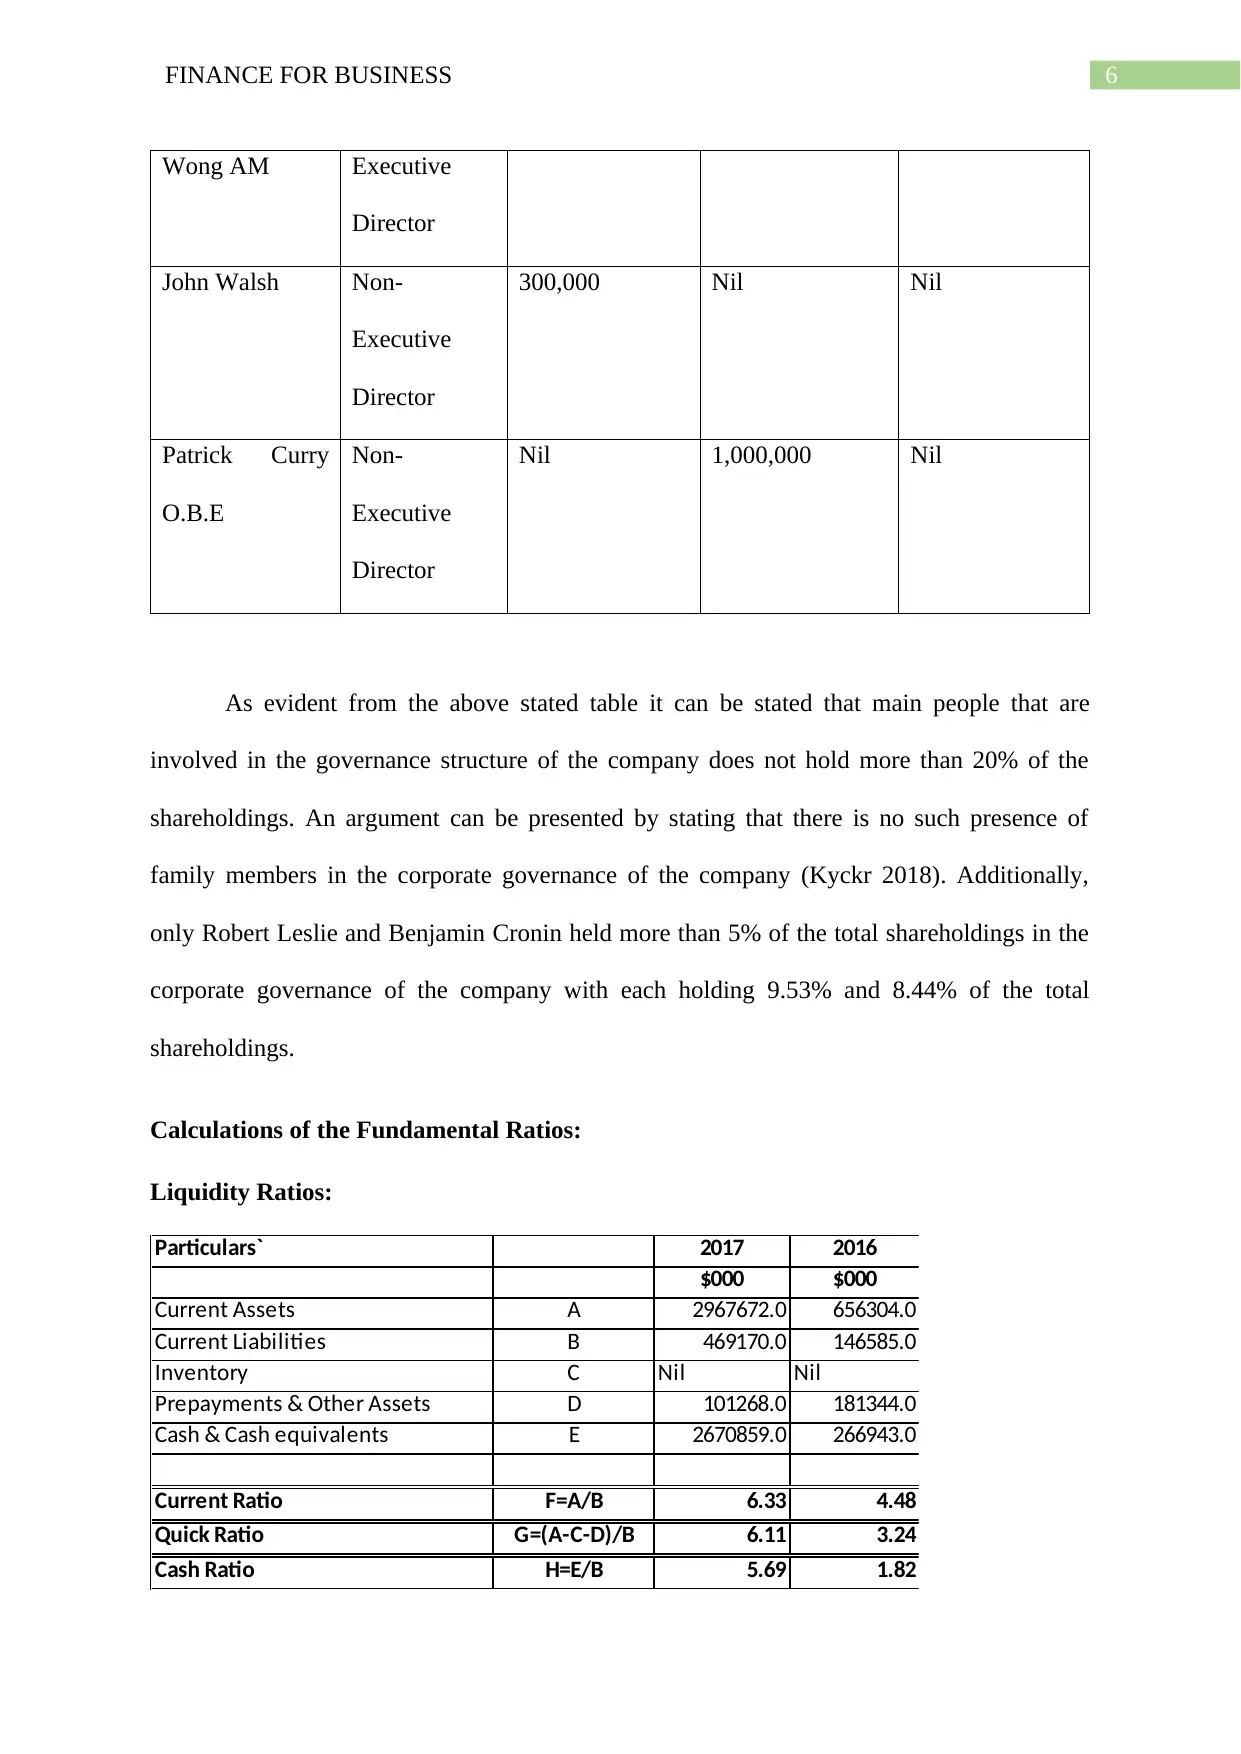
Wong AM Executive
Director
John Walsh Non-
Executive
Director
300,000 Nil Nil
Patrick Curry
O.B.E
Non-
Executive
Director
Nil 1,000,000 Nil
As evident from the above stated table it can be stated that main people that are
involved in the governance structure of the company does not hold more than 20% of the
shareholdings. An argument can be presented by stating that there is no such presence of
family members in the corporate governance of the company (Kyckr 2018). Additionally,
only Robert Leslie and Benjamin Cronin held more than 5% of the total shareholdings in the
corporate governance of the company with each holding 9.53% and 8.44% of the total
shareholdings.
Calculations of the Fundamental Ratios:
Liquidity Ratios:
Particulars` 2017 2016
$000 $000
Current Assets A 2967672.0 656304.0
Current Liabilities B 469170.0 146585.0
Inventory C Nil Nil
Prepayments & Other Assets D 101268.0 181344.0
Cash & Cash equivalents E 2670859.0 266943.0
Current Ratio F=A/B 6.33 4.48
Quick Ratio G=(A-C-D)/B 6.11 3.24
Cash Ratio H=E/B 5.69 1.82
Paraphrase This Document
Need a fresh take? Get an instant paraphrase of this document with our AI Paraphraser
7FINANCE FOR BUSINESS
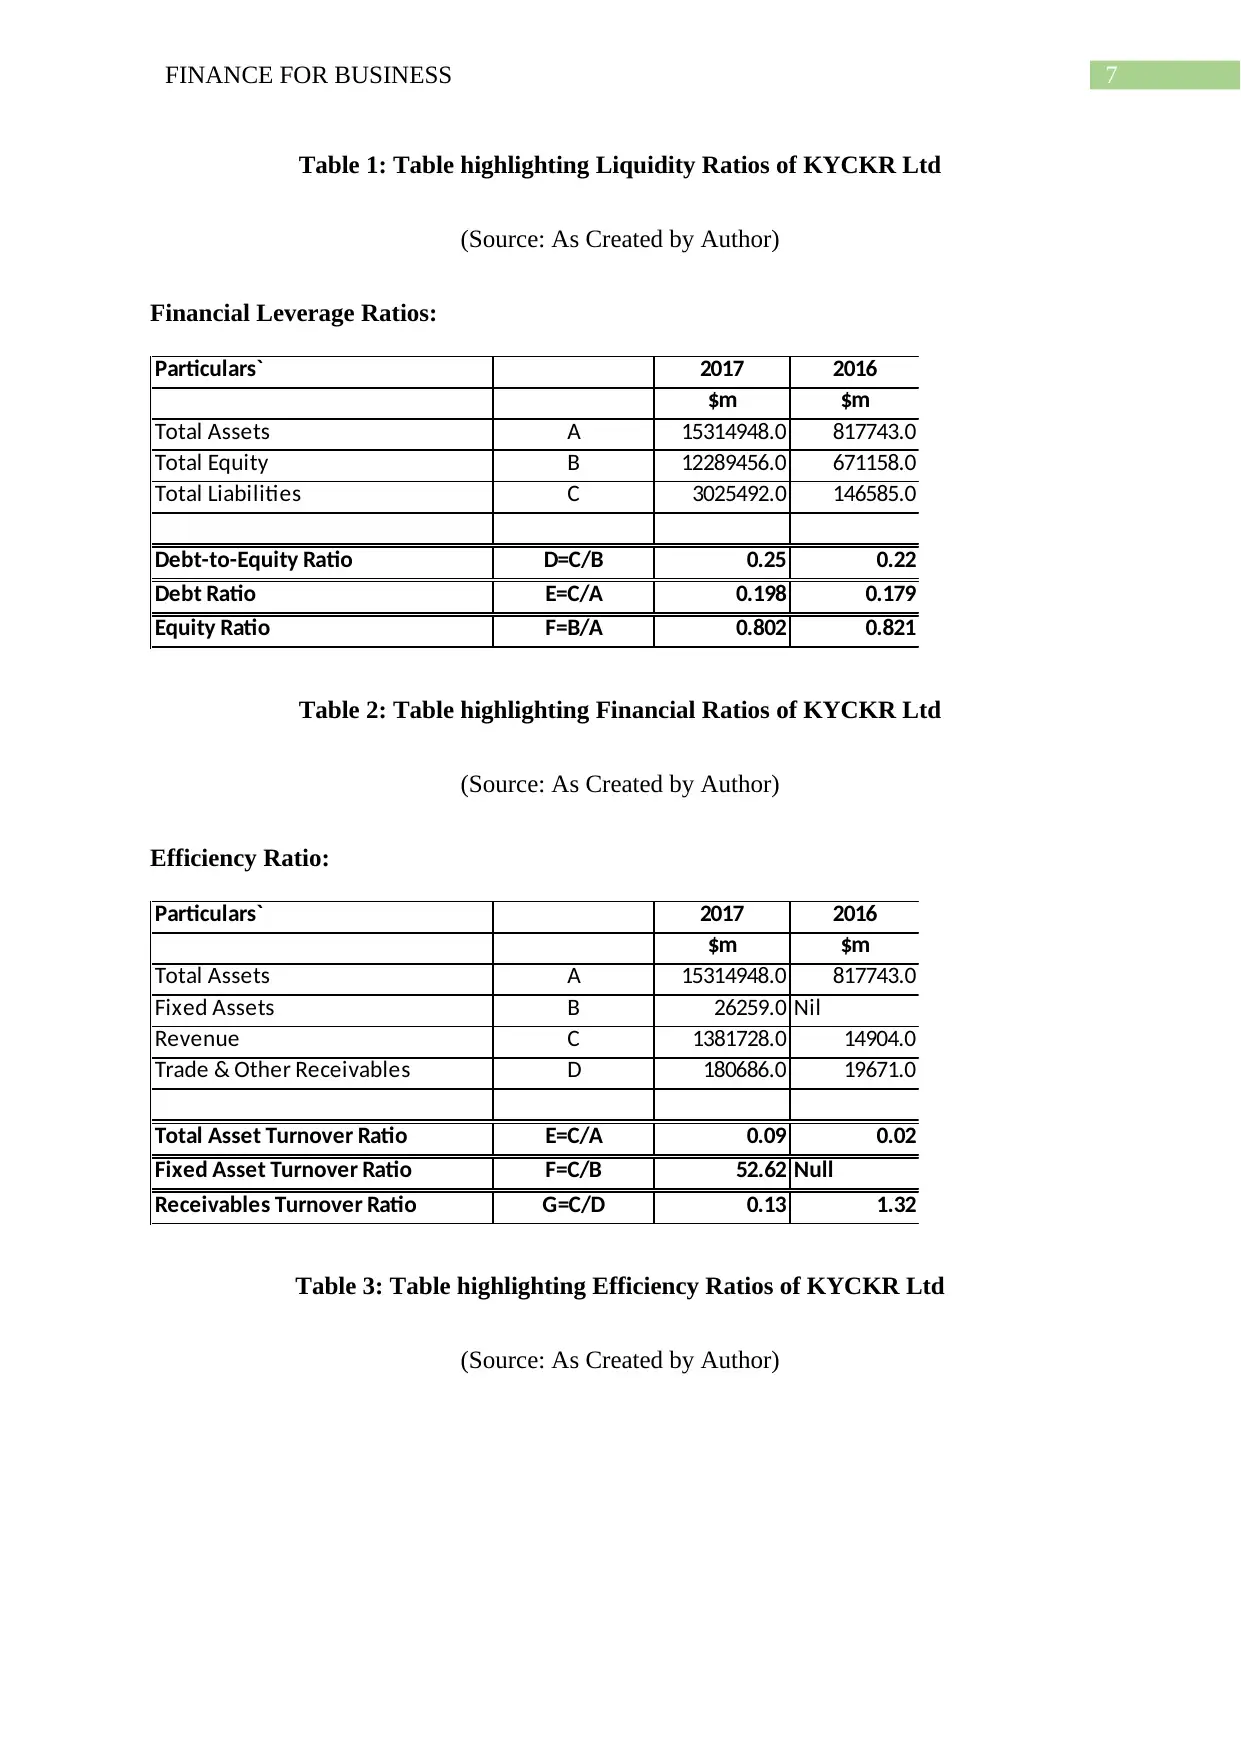
Table 1: Table highlighting Liquidity Ratios of KYCKR Ltd
(Source: As Created by Author)
Financial Leverage Ratios:
Particulars` 2017 2016
$m $m
Total Assets A 15314948.0 817743.0
Total Equity B 12289456.0 671158.0
Total Liabilities C 3025492.0 146585.0
Debt-to-Equity Ratio D=C/B 0.25 0.22
Debt Ratio E=C/A 0.198 0.179
Equity Ratio F=B/A 0.802 0.821
Table 2: Table highlighting Financial Ratios of KYCKR Ltd
(Source: As Created by Author)
Efficiency Ratio:
Particulars` 2017 2016
$m $m
Total Assets A 15314948.0 817743.0
Fixed Assets B 26259.0 Nil
Revenue C 1381728.0 14904.0
Trade & Other Receivables D 180686.0 19671.0
Total Asset Turnover Ratio E=C/A 0.09 0.02
Fixed Asset Turnover Ratio F=C/B 52.62 Null
Receivables Turnover Ratio G=C/D 0.13 1.32
Table 3: Table highlighting Efficiency Ratios of KYCKR Ltd
(Source: As Created by Author)
8FINANCE FOR BUSINESS
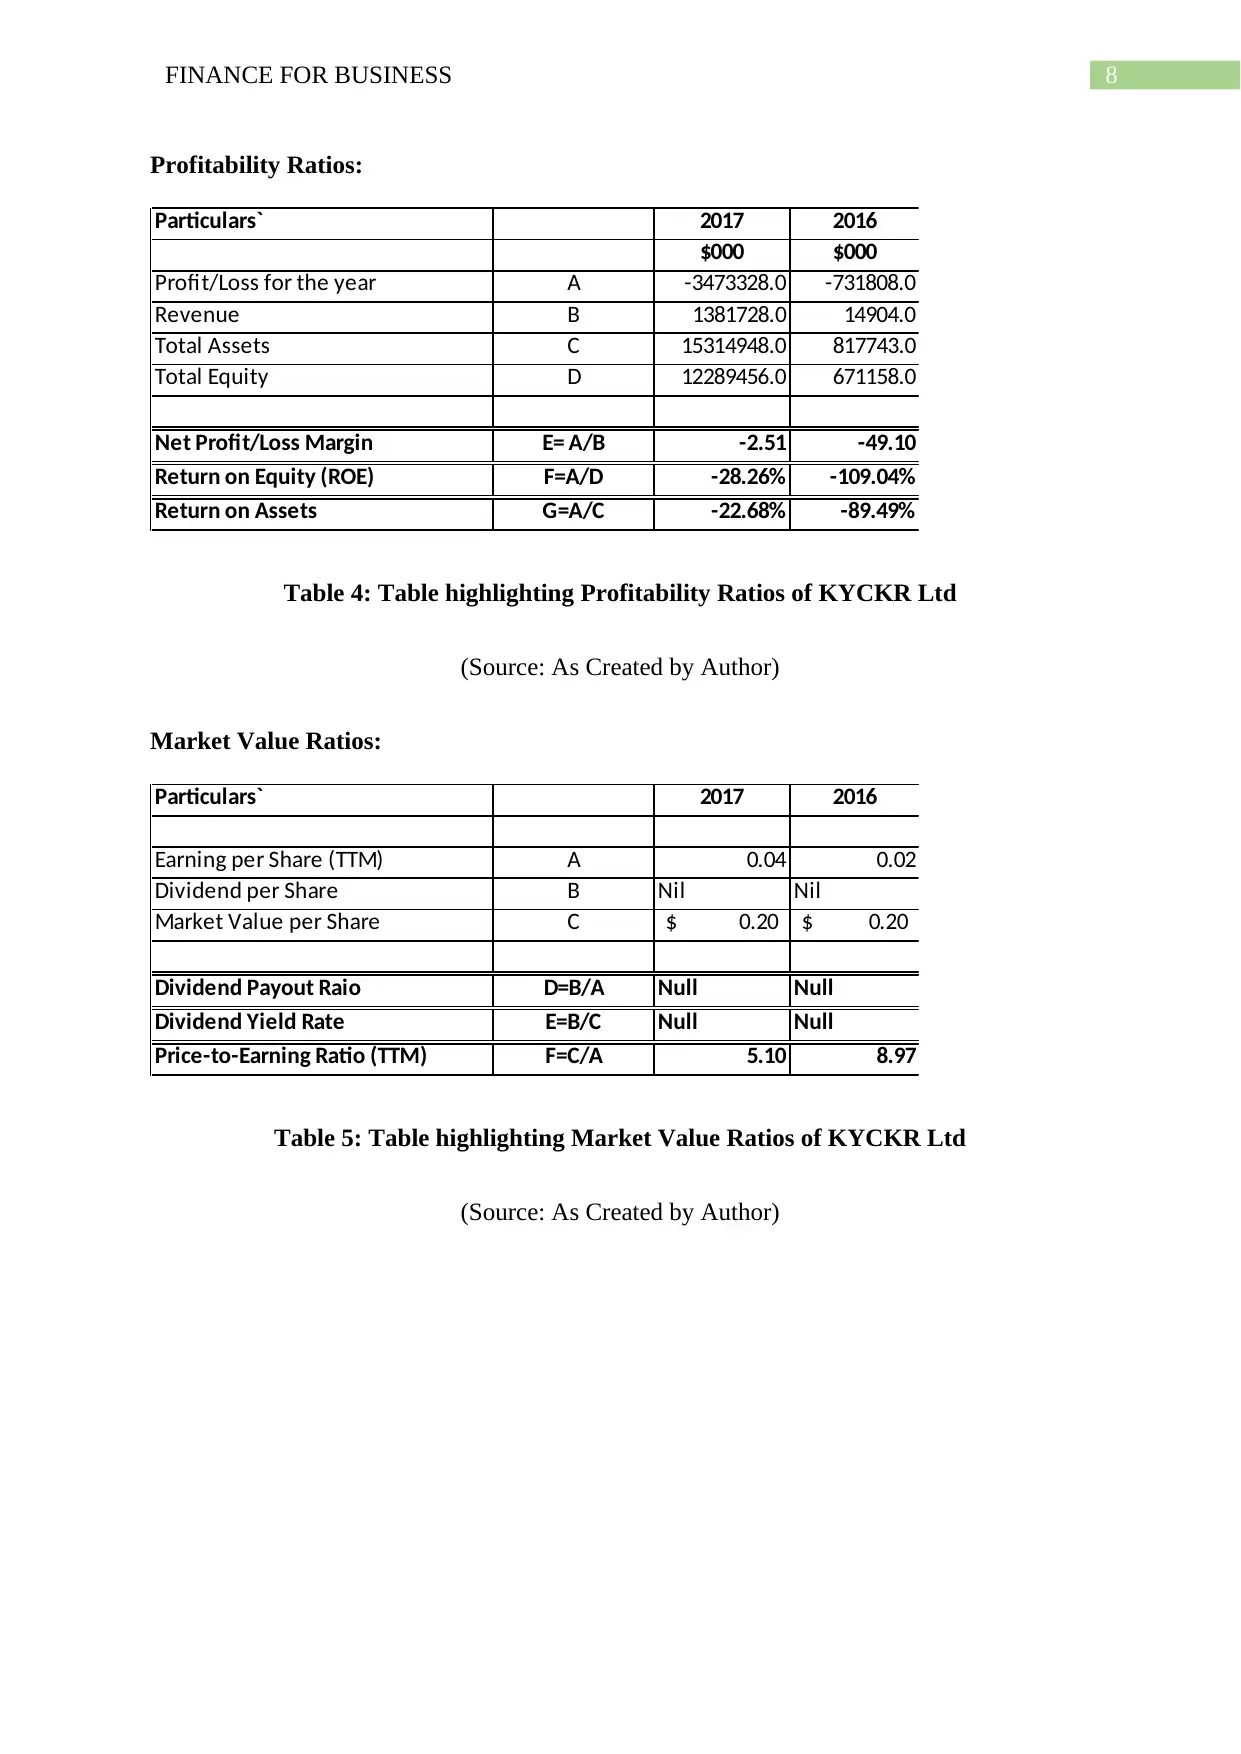
Profitability Ratios:
Particulars` 2017 2016
$000 $000
Profit/Loss for the year A -3473328.0 -731808.0
Revenue B 1381728.0 14904.0
Total Assets C 15314948.0 817743.0
Total Equity D 12289456.0 671158.0
Net Profit/Loss Margin E= A/B -2.51 -49.10
Return on Equity (ROE) F=A/D -28.26% -109.04%
Return on Assets G=A/C -22.68% -89.49%
Table 4: Table highlighting Profitability Ratios of KYCKR Ltd
(Source: As Created by Author)
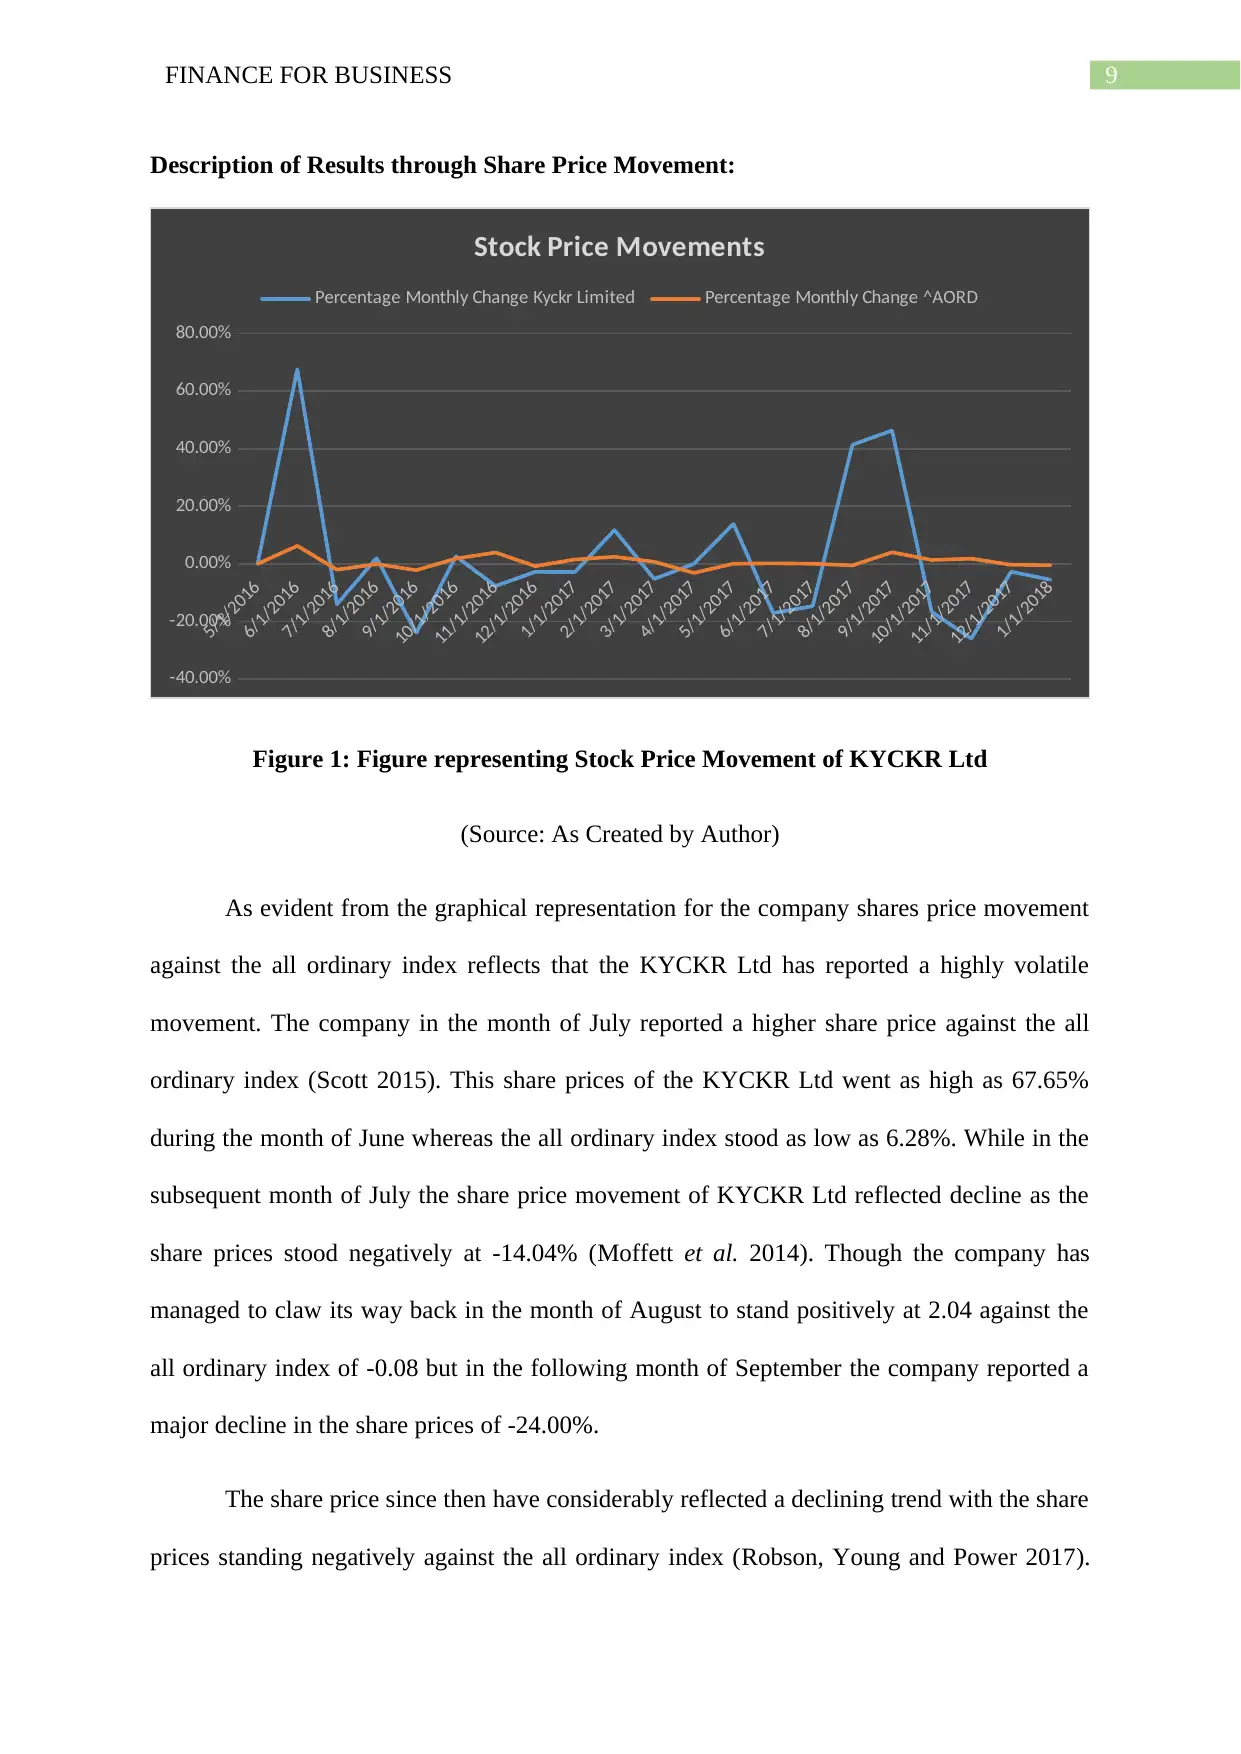
Market Value Ratios:
Particulars` 2017 2016
Earning per Share (TTM) A 0.04 0.02
Dividend per Share B Nil Nil
Market Value per Share C 0.20$ 0.20$
Dividend Payout Raio D=B/A Null Null
Dividend Yield Rate E=B/C Null Null
Price-to-Earning Ratio (TTM) F=C/A 5.10 8.97
Table 5: Table highlighting Market Value Ratios of KYCKR Ltd
(Source: As Created by Author)
Profitability Ratios:
Particulars` 2017 2016
$000 $000
Profit/Loss for the year A -3473328.0 -731808.0
Revenue B 1381728.0 14904.0
Total Assets C 15314948.0 817743.0
Total Equity D 12289456.0 671158.0
Net Profit/Loss Margin E= A/B -2.51 -49.10
Return on Equity (ROE) F=A/D -28.26% -109.04%
Return on Assets G=A/C -22.68% -89.49%
Table 4: Table highlighting Profitability Ratios of KYCKR Ltd
(Source: As Created by Author)
Market Value Ratios:
Particulars` 2017 2016
Earning per Share (TTM) A 0.04 0.02
Dividend per Share B Nil Nil
Market Value per Share C 0.20$ 0.20$
Dividend Payout Raio D=B/A Null Null
Dividend Yield Rate E=B/C Null Null
Price-to-Earning Ratio (TTM) F=C/A 5.10 8.97
Table 5: Table highlighting Market Value Ratios of KYCKR Ltd
(Source: As Created by Author)
⊘ This is a preview!⊘
Do you want full access?
Subscribe today to unlock all pages.
Trusted by 1+ million students worldwide
9FINANCE FOR BUSINESS
Description of Results through Share Price Movement:
5/1/2016
6/1/2016
7/1/2016
8/1/2016
9/1/2016
10/1/2016
11/1/2016
12/1/2016
1/1/2017
2/1/2017
3/1/2017
4/1/2017
5/1/2017
6/1/2017
7/1/2017
8/1/2017
9/1/2017
10/1/2017
11/1/2017
12/1/2017
1/1/2018
-40.00%
-20.00%
0.00%
20.00%
40.00%
60.00%
80.00%
Stock Price Movements
Percentage Monthly Change Kyckr Limited Percentage Monthly Change ^AORD
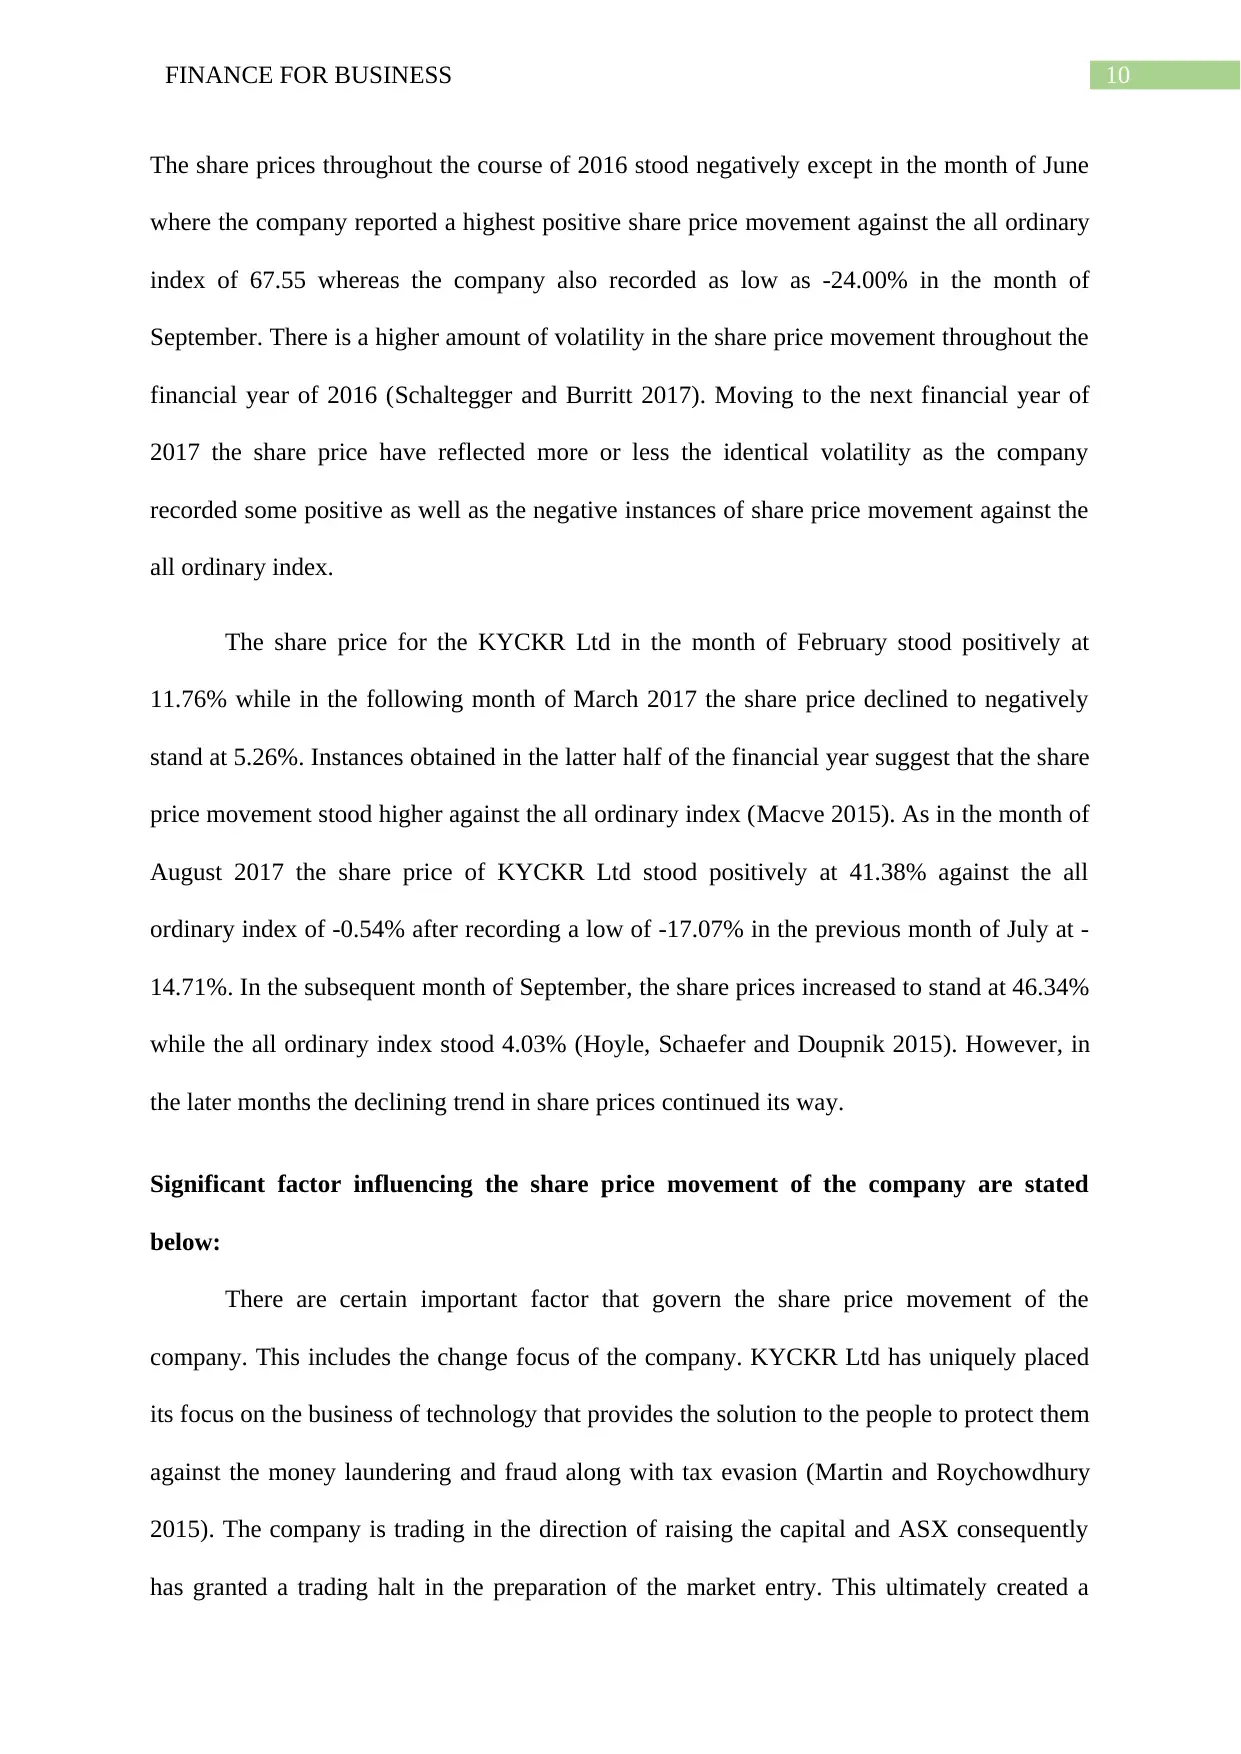
Figure 1: Figure representing Stock Price Movement of KYCKR Ltd
(Source: As Created by Author)
As evident from the graphical representation for the company shares price movement
against the all ordinary index reflects that the KYCKR Ltd has reported a highly volatile
movement. The company in the month of July reported a higher share price against the all
ordinary index (Scott 2015). This share prices of the KYCKR Ltd went as high as 67.65%
during the month of June whereas the all ordinary index stood as low as 6.28%. While in the
subsequent month of July the share price movement of KYCKR Ltd reflected decline as the
share prices stood negatively at -14.04% (Moffett et al. 2014). Though the company has
managed to claw its way back in the month of August to stand positively at 2.04 against the
all ordinary index of -0.08 but in the following month of September the company reported a
major decline in the share prices of -24.00%.
The share price since then have considerably reflected a declining trend with the share
prices standing negatively against the all ordinary index (Robson, Young and Power 2017).
Description of Results through Share Price Movement:
5/1/2016
6/1/2016
7/1/2016
8/1/2016
9/1/2016
10/1/2016
11/1/2016
12/1/2016
1/1/2017
2/1/2017
3/1/2017
4/1/2017
5/1/2017
6/1/2017
7/1/2017
8/1/2017
9/1/2017
10/1/2017
11/1/2017
12/1/2017
1/1/2018
-40.00%
-20.00%
0.00%
20.00%
40.00%
60.00%
80.00%
Stock Price Movements
Percentage Monthly Change Kyckr Limited Percentage Monthly Change ^AORD
Figure 1: Figure representing Stock Price Movement of KYCKR Ltd
(Source: As Created by Author)
As evident from the graphical representation for the company shares price movement
against the all ordinary index reflects that the KYCKR Ltd has reported a highly volatile
movement. The company in the month of July reported a higher share price against the all
ordinary index (Scott 2015). This share prices of the KYCKR Ltd went as high as 67.65%
during the month of June whereas the all ordinary index stood as low as 6.28%. While in the
subsequent month of July the share price movement of KYCKR Ltd reflected decline as the
share prices stood negatively at -14.04% (Moffett et al. 2014). Though the company has
managed to claw its way back in the month of August to stand positively at 2.04 against the
all ordinary index of -0.08 but in the following month of September the company reported a
major decline in the share prices of -24.00%.
The share price since then have considerably reflected a declining trend with the share
prices standing negatively against the all ordinary index (Robson, Young and Power 2017).
Paraphrase This Document
Need a fresh take? Get an instant paraphrase of this document with our AI Paraphraser
10FINANCE FOR BUSINESS
The share prices throughout the course of 2016 stood negatively except in the month of June
where the company reported a highest positive share price movement against the all ordinary
index of 67.55 whereas the company also recorded as low as -24.00% in the month of
September. There is a higher amount of volatility in the share price movement throughout the
financial year of 2016 (Schaltegger and Burritt 2017). Moving to the next financial year of
2017 the share price have reflected more or less the identical volatility as the company
recorded some positive as well as the negative instances of share price movement against the
all ordinary index.
The share price for the KYCKR Ltd in the month of February stood positively at
11.76% while in the following month of March 2017 the share price declined to negatively
stand at 5.26%. Instances obtained in the latter half of the financial year suggest that the share
price movement stood higher against the all ordinary index (Macve 2015). As in the month of
August 2017 the share price of KYCKR Ltd stood positively at 41.38% against the all
ordinary index of -0.54% after recording a low of -17.07% in the previous month of July at -
14.71%. In the subsequent month of September, the share prices increased to stand at 46.34%
while the all ordinary index stood 4.03% (Hoyle, Schaefer and Doupnik 2015). However, in
the later months the declining trend in share prices continued its way.
Significant factor influencing the share price movement of the company are stated
below:
There are certain important factor that govern the share price movement of the
company. This includes the change focus of the company. KYCKR Ltd has uniquely placed
its focus on the business of technology that provides the solution to the people to protect them
against the money laundering and fraud along with tax evasion (Martin and Roychowdhury
2015). The company is trading in the direction of raising the capital and ASX consequently
has granted a trading halt in the preparation of the market entry. This ultimately created a
11FINANCE FOR BUSINESS
significant impact on the share prices of the company resulting the share prices to fall
negatively against the all ordinary index.
Macroeconomic factors include the currency and the exchange rate fluctuations. The
current financial contribution of the group is largely reliant on the movement in the exchange
rates among the Australian dollar and certain number of overseas currencies (Hoitash and
Hoitash 2017). The exchange rate among the numerous nations fluctuates substantially and
this results in fluctuations that adversely create an impact on the operating results of the
group and the financial position. As a result of this share prices of the company is
considerably impacted.
The industry factors include the market risks as the KYCKR Ltd is exposed to the risk
of currency because of the foreign exchange fluctuations in rate of currency (Henderson et al.
2015). The foreign currency risks originate from the future commercial transactions and the
same that is identified in the financial assets of the KYCKR Ltd. As a result of this there is a
significant movement as well as volatility in the share price movement of KYCKR Ltd.
Calculations of the Beta values and the anticipated rate of return by employing CAPM:
Computation of Beta Values
The calculated amount of beta for the company stood 0.00.
⊘ This is a preview!⊘
Do you want full access?
Subscribe today to unlock all pages.
Trusted by 1+ million students worldwide
1 out of 20
Related Documents


Your All-in-One AI-Powered Toolkit for Academic Success.
+13062052269
info@desklib.com
Available 24*7 on WhatsApp / Email
![[object Object]](/_next/static/media/star-bottom.7253800d.svg)
Unlock your academic potential
Copyright © 2020–2026 A2Z Services. All Rights Reserved. Developed and managed by ZUCOL.