Comprehensive Violence and Injury Analysis of Kyrgyzstan Report
VerifiedAdded on 2020/05/01
|14
|2830
|172
Report
AI Summary
This report provides a comprehensive analysis of violence and injury data in Kyrgyzstan, utilizing data from the World Health Organization (WHO). The study examines mortality rates, causes of death, and trends over a five-year period, focusing on different age groups, genders, and specific causes like road traffic crashes, burns, falls, and violence. The report includes detailed data descriptions, data analysis using tables, pie charts, and line diagrams generated with the help of Python. The analysis identifies key factors contributing to injury and violence, such as sharp force, blunt force, and various disease codes. Comparative analyses between Kyrgyzstan and Denmark are conducted to highlight the impact of economic factors on injury levels. The findings reveal the increasing trends in violence-related deaths and the vulnerability of specific age groups. The report concludes with interpretations of the data and suggests preventative measures to address the issues of violence and injury in Kyrgyzstan. The report also includes tables summarizing the data and graphs that visualize the trends. The student has provided a detailed analysis of the problem and has drawn conclusions accordingly.
Running head: VIOLENCE AND INJURY ANALYSIS OF KYRGYZSTAN
Violence and Injury Analysis of Kyrgyzstan
Name of the Student:
Name of the University:
Author’s Note:
Violence and Injury Analysis of Kyrgyzstan
Name of the Student:
Name of the University:
Author’s Note:
Paraphrase This Document
Need a fresh take? Get an instant paraphrase of this document with our AI Paraphraser

VIOLENCE AND INJURY ANALYSIS OF KYRGYZSTAN 1
Executive Summary:
The report discusses about the injury and violence data analysis of Kyrgyzstan. The different effects of injury and
violence are analyzed in the data. Necessary tables and calculations were provided in the data. The necessary graphs and
plots were provided in the report with the help of Python. Proper conclusions and interpretations are drawn from the data.
The measurement steps to avoid violence and injury are described in the report.
VIOLENCE AND INJURY ANALYSIS OF KYRGYZSTAN 2
Table of Contents
Introduction:-..........................................................................................................................................................................3
Data Description:-...................................................................................................................................................................3
Causes of Death in the Data:-.................................................................................................................................................4
Data Analysis:-.......................................................................................................................................................................5
Data Interpretation and Necessary Precaution:-...................................................................................................................10
Conclusion:-..........................................................................................................................................................................12
Annotated Bibliography:-.....................................................................................................................................................13
⊘ This is a preview!⊘
Do you want full access?
Subscribe today to unlock all pages.
Trusted by 1+ million students worldwide
VIOLENCE AND INJURY ANALYSIS OF KYRGYZSTAN 3
Introduction:-
Kyrgyzstan is a Central Asian country full of natural beauty, proud of nomadic traditions and maximum territory
of its land is formally annexed to the Russian Empire.
In 2015, Kyrgyzstan had total population of 17,625,000 with gross national per capita income of $20 in 2015,
which is termed as low per capita income. The life expectancy rate at birth of the country has been 66/75 in 2015, along
with the probability of dying ratio between age 15 to 60 years 279/118 per 1000 population in 2015. The overall ratio
depicts the low profile of the country along with low expenditure per capita on health by the government of $1068 in
2014. The total expenditure on health is only 4.4% of their GDP in 2014.
In the report, we are analyzing the data of injury and violence.
Data Description:-
The dataset used for the report has been divided into four categories. It is divided based on counties, age, gender,
year and top death causing issues.
The time-period for the analysis is 5 years, which means that the data is collected with the time interval of 5
years. For both the sexes, the age is divided from 15 years to 70 years. The interval of data is divided as between 1990-
1999 with the data code B50 for cause group A, B51 for group B, B52 for group C, B56 for group D.
Group A represents deaths caused by accidental falls, Group B represents deaths due to fires or flames, Group C
represents deaths caused by other accidental injuries and Group D represents deaths caused by violence. Cause of Death
Query of WHO was used to extract data used on the report. The portal of WHO is web-based system for extracting trend
series and detailed causes of mortality.
Country
Code name Year List Icd
4184 Kyrgyzstan 1981 09N Icd9
4184 Kyrgyzstan 1982 09N Icd9
4184 Kyrgyzstan 1985 09N Icd9
4184 Kyrgyzstan 1986 09N Icd9
4184 Kyrgyzstan 1987 09N Icd9
4184 Kyrgyzstan 1988 09N Icd9
4184 Kyrgyzstan 1989 09N Icd9
4184 Kyrgyzstan 1990 09N Icd9
4184 Kyrgyzstan 1991 09N Icd9
4184 Kyrgyzstan 1992 09N Icd9
4184 Kyrgyzstan 1993 09N Icd9
4184 Kyrgyzstan 1994 09N Icd9
4184 Kyrgyzstan 1995 09N Icd9
4184 Kyrgyzstan 1996 09N Icd9
4184 Kyrgyzstan 1997 09N Icd9
4184 Kyrgyzstan 1998 09N Icd9
4184 Kyrgyzstan 1999 09N Icd9
4184 Kyrgyzstan 2000 104 Icd10
Paraphrase This Document
Need a fresh take? Get an instant paraphrase of this document with our AI Paraphraser
VIOLENCE AND INJURY ANALYSIS OF KYRGYZSTAN 4
4184 Kyrgyzstan 2001 104 Icd10
4184 Kyrgyzstan 2002 104 Icd10
4184 Kyrgyzstan 2003 104 Icd10
4184 Kyrgyzstan 2004 104 Icd10
4184 Kyrgyzstan 2005 104 Icd10
4184 Kyrgyzstan 2006 104 Icd10
4184 Kyrgyzstan 2007 104 Icd10
4184 Kyrgyzstan 2008 104 Icd10
4184 Kyrgyzstan 2009 104 Icd10
4184 Kyrgyzstan 2010 104 Icd10
4184 Kyrgyzstan 2011 104 Icd10
4184 Kyrgyzstan 2012 104 Icd10
4184 Kyrgyzstan 2013 104 Icd10
4184 Kyrgyzstan 2014 104 Icd10
4184 Kyrgyzstan 2015 104 Icd10
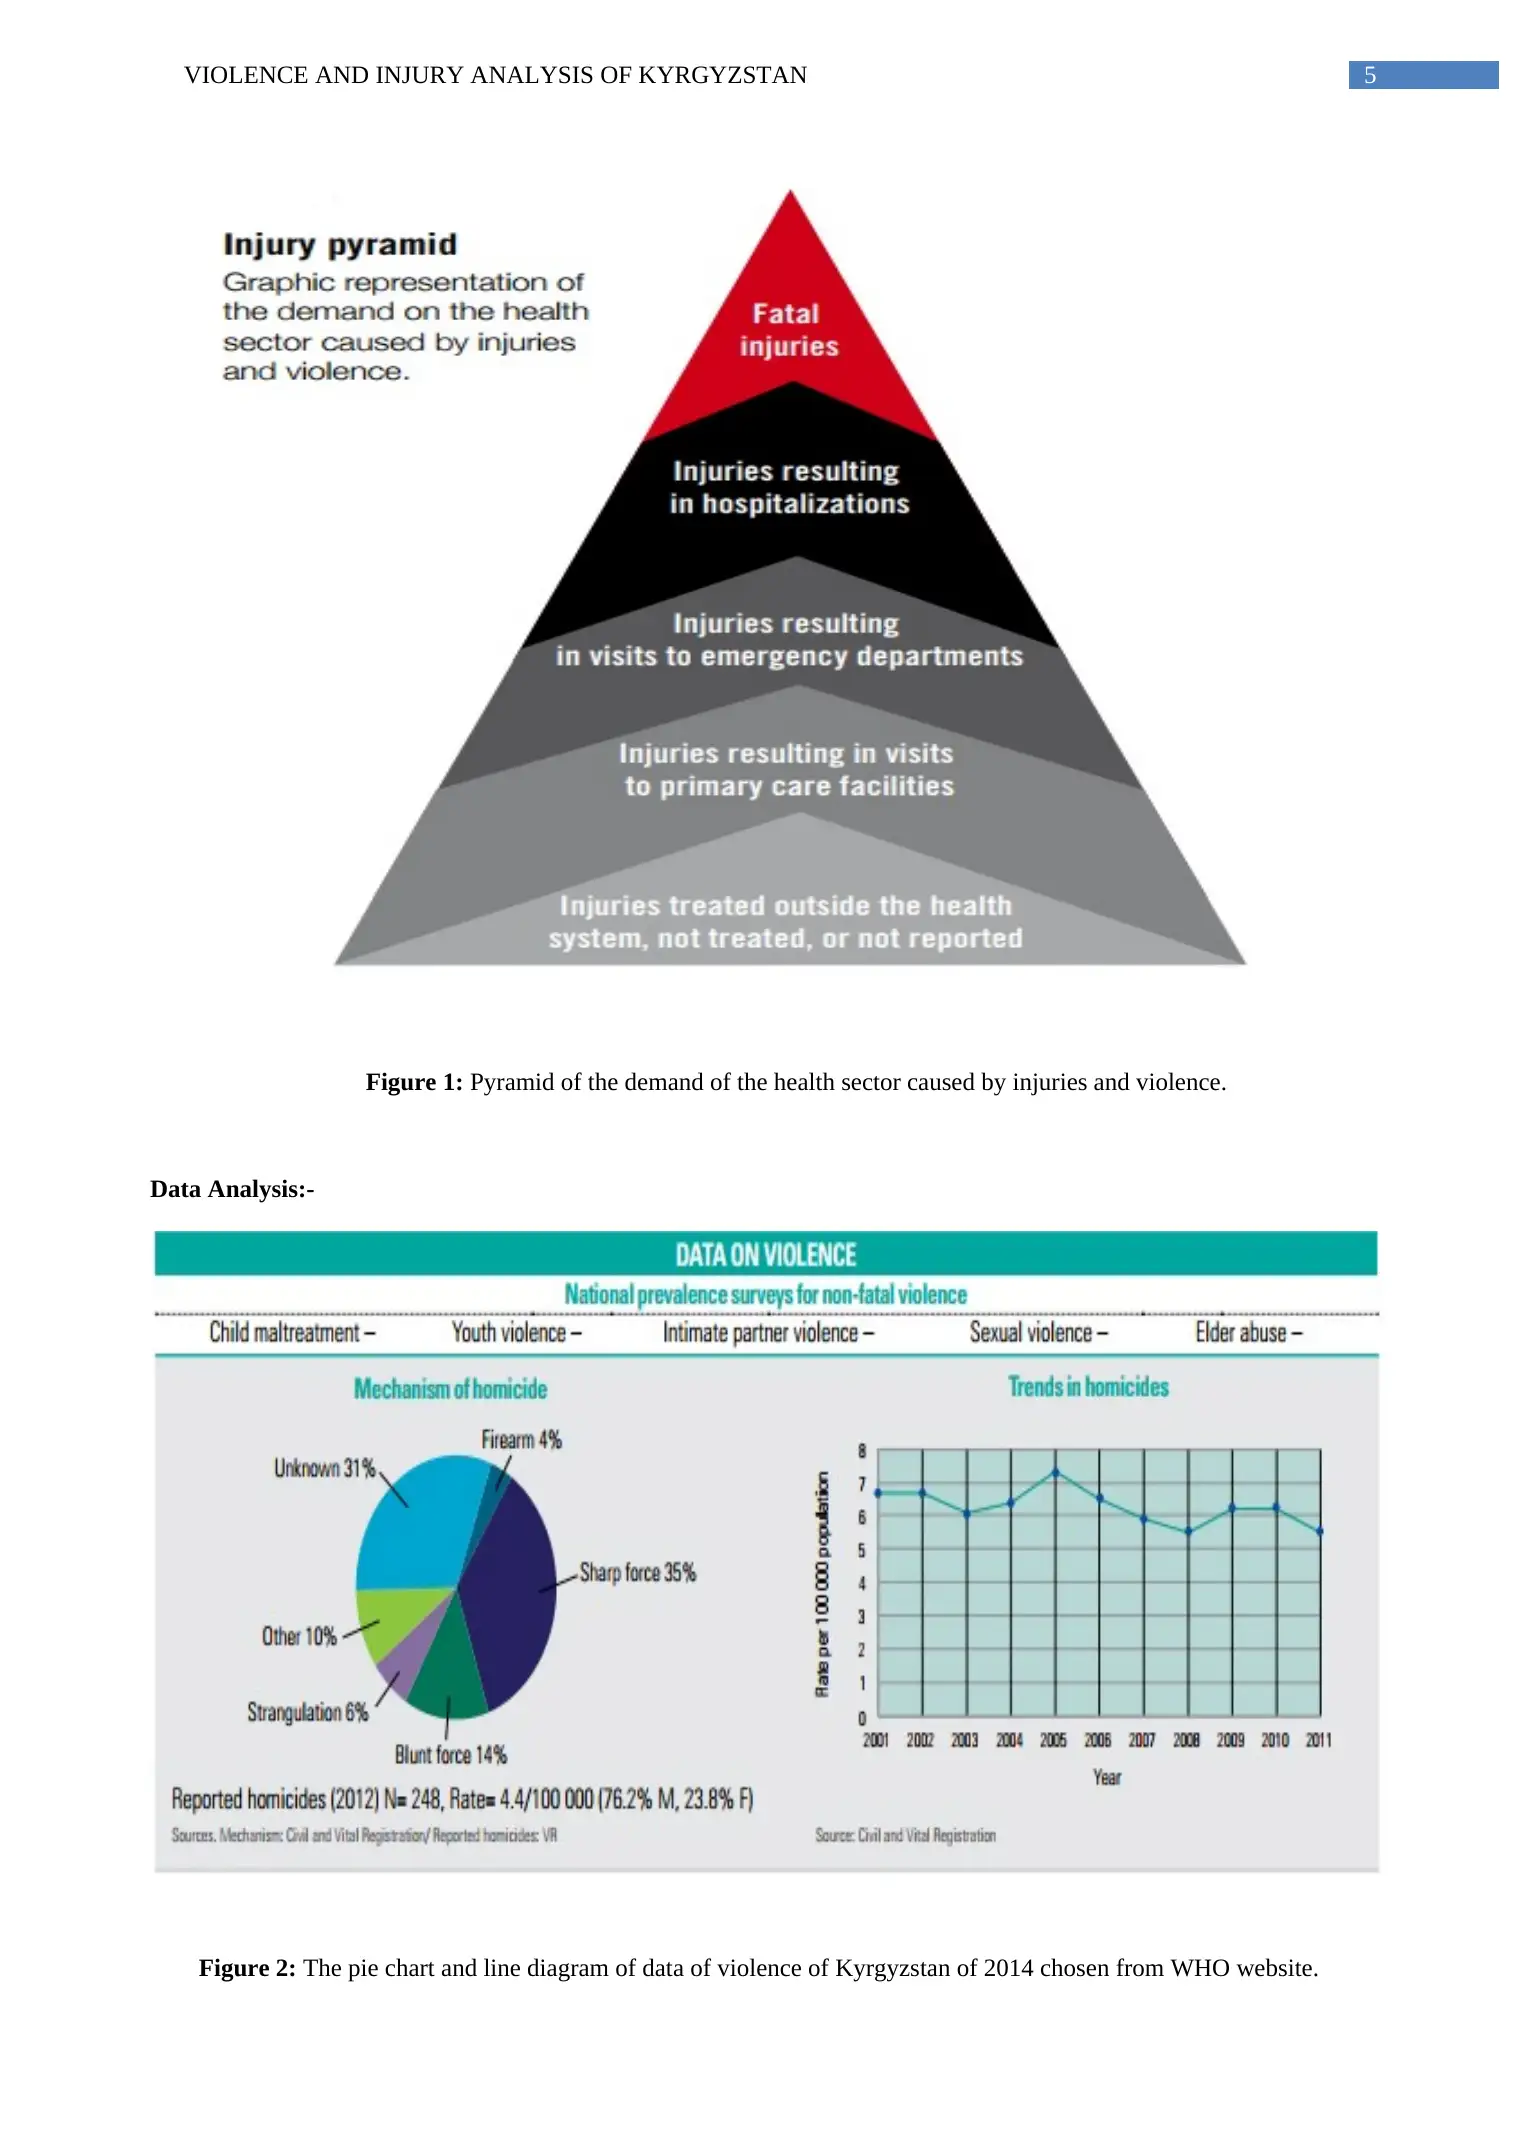
Causes of Death in the Data:-
Injuries are caused by different reasons –
1. Road traffic crashes. (Due to speeding, drinking and driving, no use of motorcycle helmets, no use of seat-belts,
due to child restraints, unsafe roadway infrastructure, vehicle and safety equipment standards, not using daylights
for motorcycles, not having licensing system for motorcycles).
2. Burns. (Due to smoking, temperature of water, burn centre).
3. Drowning. (Unsafe water of child care, unsafe rescue skills, unsafe rescue and resuscitation, scarcity of flotation
device).
4. Falls. (Absence of window guards of tall building, low-level standard of furniture and playground equipment).
5. Poisoning. (Unsafe use of medicines and drugs, lethal quantities of drugs, scarcity of poison-control centers).
6. Violence. (Unsafe and unstable relationship between children and their guardian, life skill in children and
adolescents, harmful use of alcohol, access to guns and knives, gender inequality and violence against women,
violence due to cultural and social norms, violence through victim identification, care and support prigrammes).
7. Suicide. (By firearms, pesticides and certain medications, harmful use of alcohol, presence of mental disorders
and frustration).
Here, we are eager to analyze the data of different levels of injury and death due to violence that are shown in the
below pyramid.
4184 Kyrgyzstan 2001 104 Icd10
4184 Kyrgyzstan 2002 104 Icd10
4184 Kyrgyzstan 2003 104 Icd10
4184 Kyrgyzstan 2004 104 Icd10
4184 Kyrgyzstan 2005 104 Icd10
4184 Kyrgyzstan 2006 104 Icd10
4184 Kyrgyzstan 2007 104 Icd10
4184 Kyrgyzstan 2008 104 Icd10
4184 Kyrgyzstan 2009 104 Icd10
4184 Kyrgyzstan 2010 104 Icd10
4184 Kyrgyzstan 2011 104 Icd10
4184 Kyrgyzstan 2012 104 Icd10
4184 Kyrgyzstan 2013 104 Icd10
4184 Kyrgyzstan 2014 104 Icd10
4184 Kyrgyzstan 2015 104 Icd10
Causes of Death in the Data:-
Injuries are caused by different reasons –
1. Road traffic crashes. (Due to speeding, drinking and driving, no use of motorcycle helmets, no use of seat-belts,
due to child restraints, unsafe roadway infrastructure, vehicle and safety equipment standards, not using daylights
for motorcycles, not having licensing system for motorcycles).
2. Burns. (Due to smoking, temperature of water, burn centre).
3. Drowning. (Unsafe water of child care, unsafe rescue skills, unsafe rescue and resuscitation, scarcity of flotation
device).
4. Falls. (Absence of window guards of tall building, low-level standard of furniture and playground equipment).
5. Poisoning. (Unsafe use of medicines and drugs, lethal quantities of drugs, scarcity of poison-control centers).
6. Violence. (Unsafe and unstable relationship between children and their guardian, life skill in children and
adolescents, harmful use of alcohol, access to guns and knives, gender inequality and violence against women,
violence due to cultural and social norms, violence through victim identification, care and support prigrammes).
7. Suicide. (By firearms, pesticides and certain medications, harmful use of alcohol, presence of mental disorders
and frustration).
Here, we are eager to analyze the data of different levels of injury and death due to violence that are shown in the
below pyramid.
VIOLENCE AND INJURY ANALYSIS OF KYRGYZSTAN 5
Figure 1: Pyramid of the demand of the health sector caused by injuries and violence.
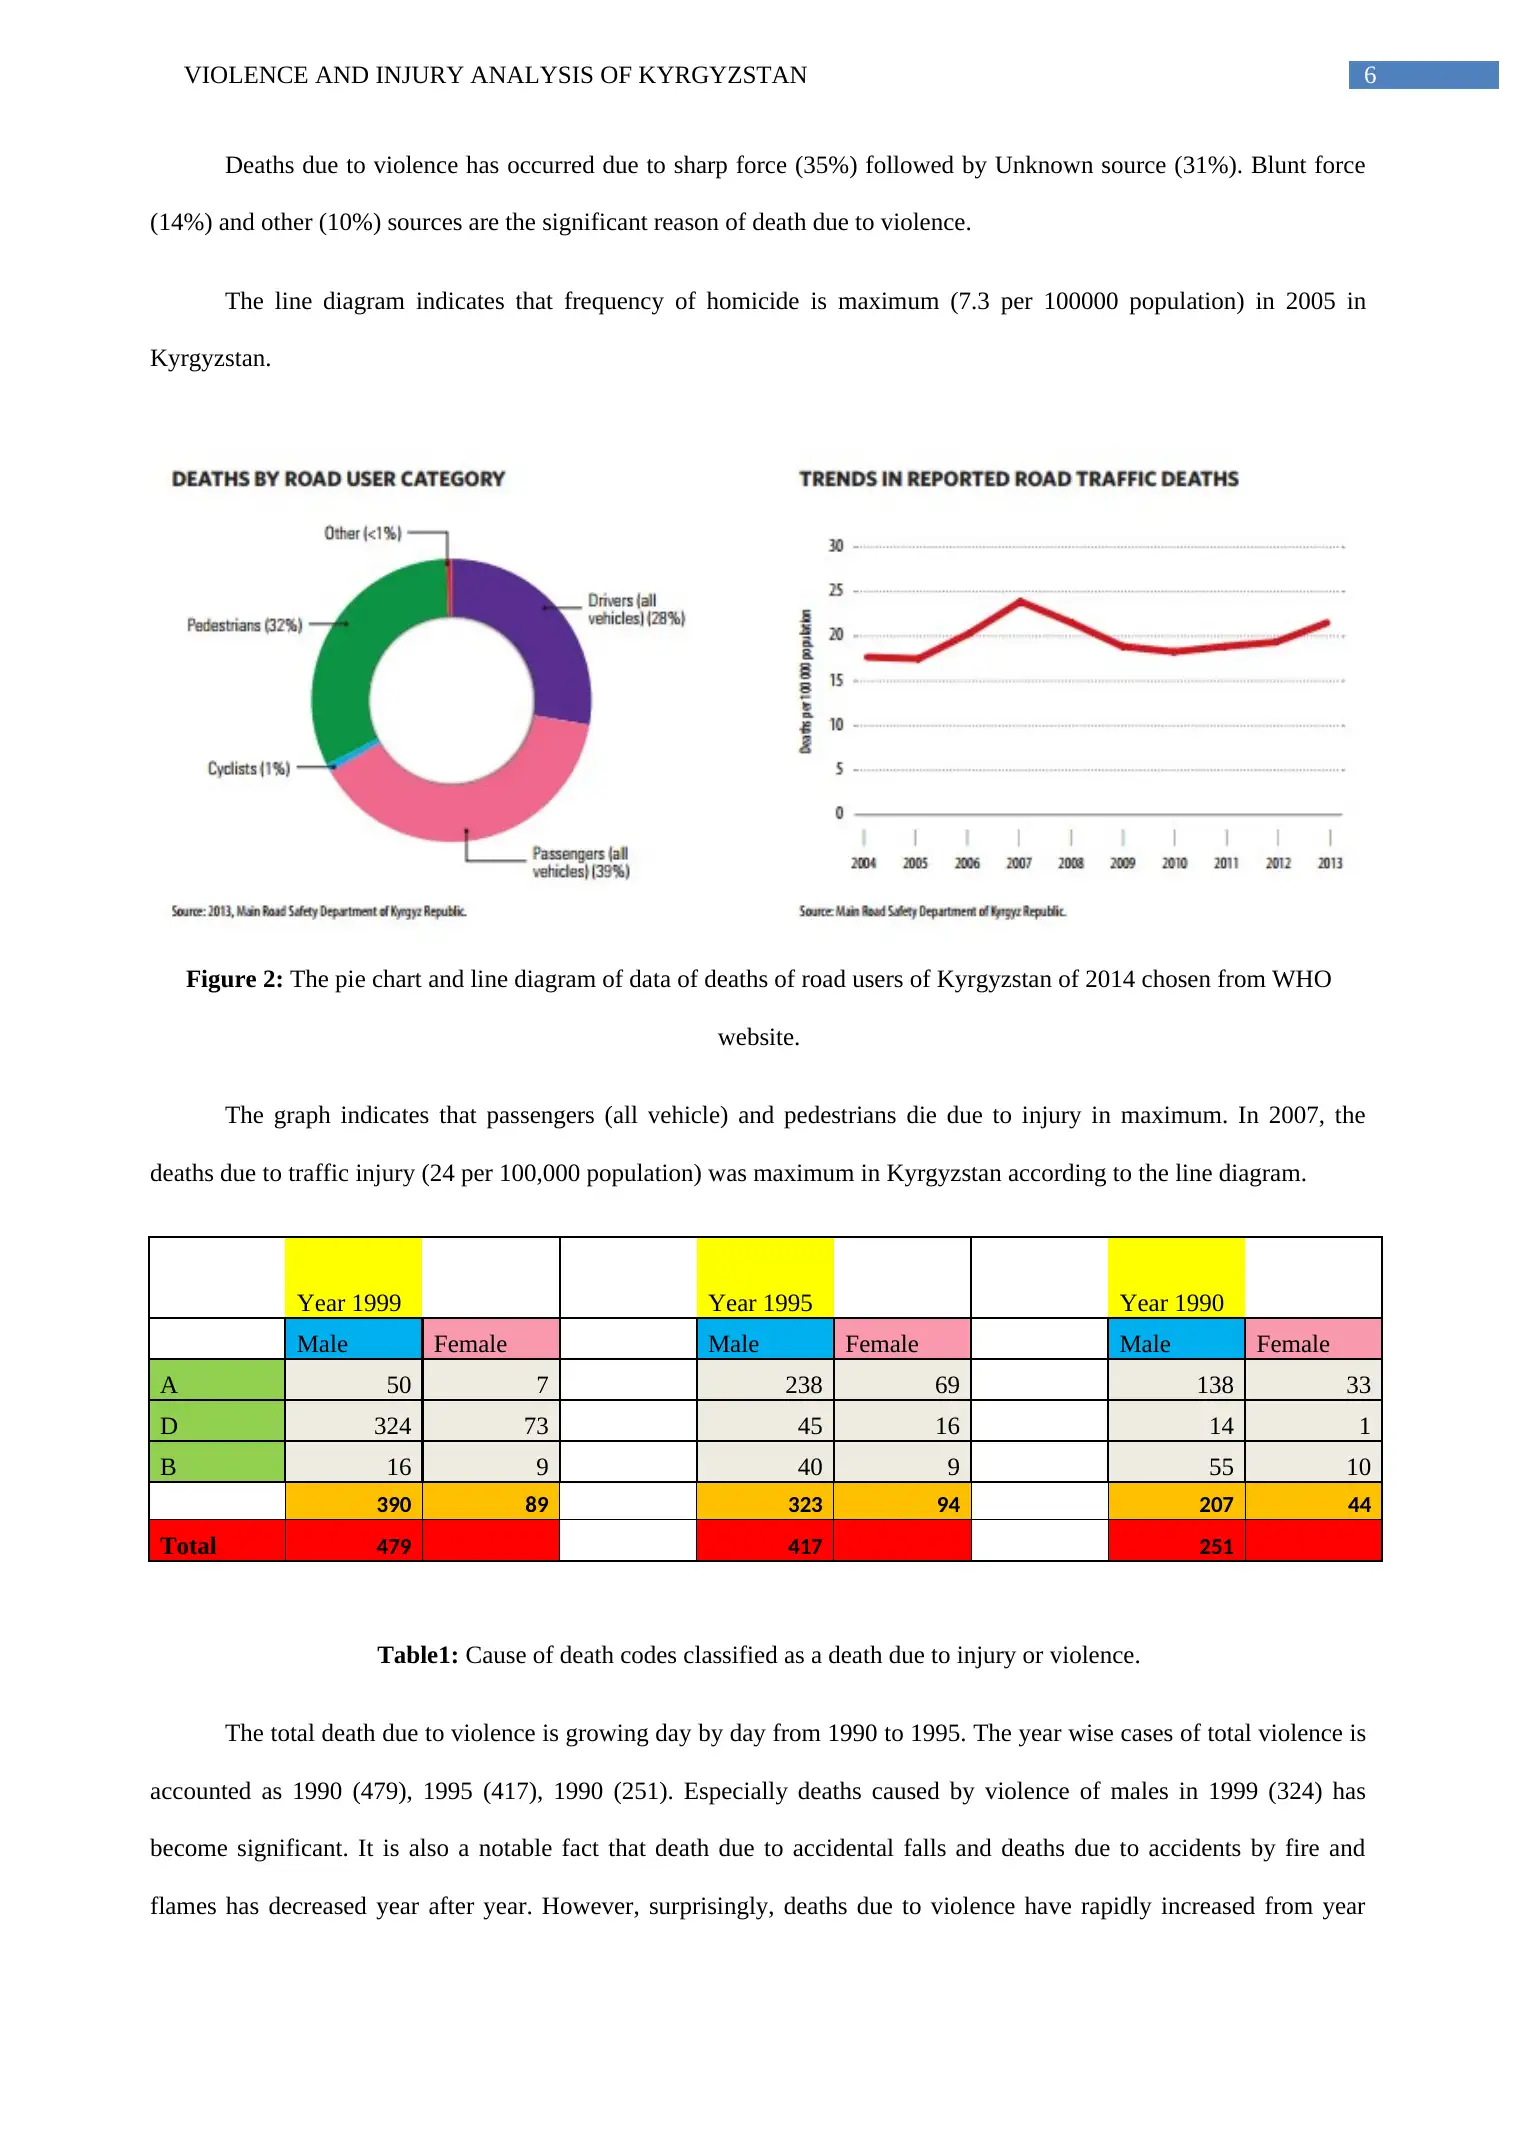
Data Analysis:-
Figure 2: The pie chart and line diagram of data of violence of Kyrgyzstan of 2014 chosen from WHO website.
Figure 1: Pyramid of the demand of the health sector caused by injuries and violence.
Data Analysis:-
Figure 2: The pie chart and line diagram of data of violence of Kyrgyzstan of 2014 chosen from WHO website.
⊘ This is a preview!⊘
Do you want full access?
Subscribe today to unlock all pages.
Trusted by 1+ million students worldwide
VIOLENCE AND INJURY ANALYSIS OF KYRGYZSTAN 6
Deaths due to violence has occurred due to sharp force (35%) followed by Unknown source (31%). Blunt force
(14%) and other (10%) sources are the significant reason of death due to violence.
The line diagram indicates that frequency of homicide is maximum (7.3 per 100000 population) in 2005 in
Kyrgyzstan.
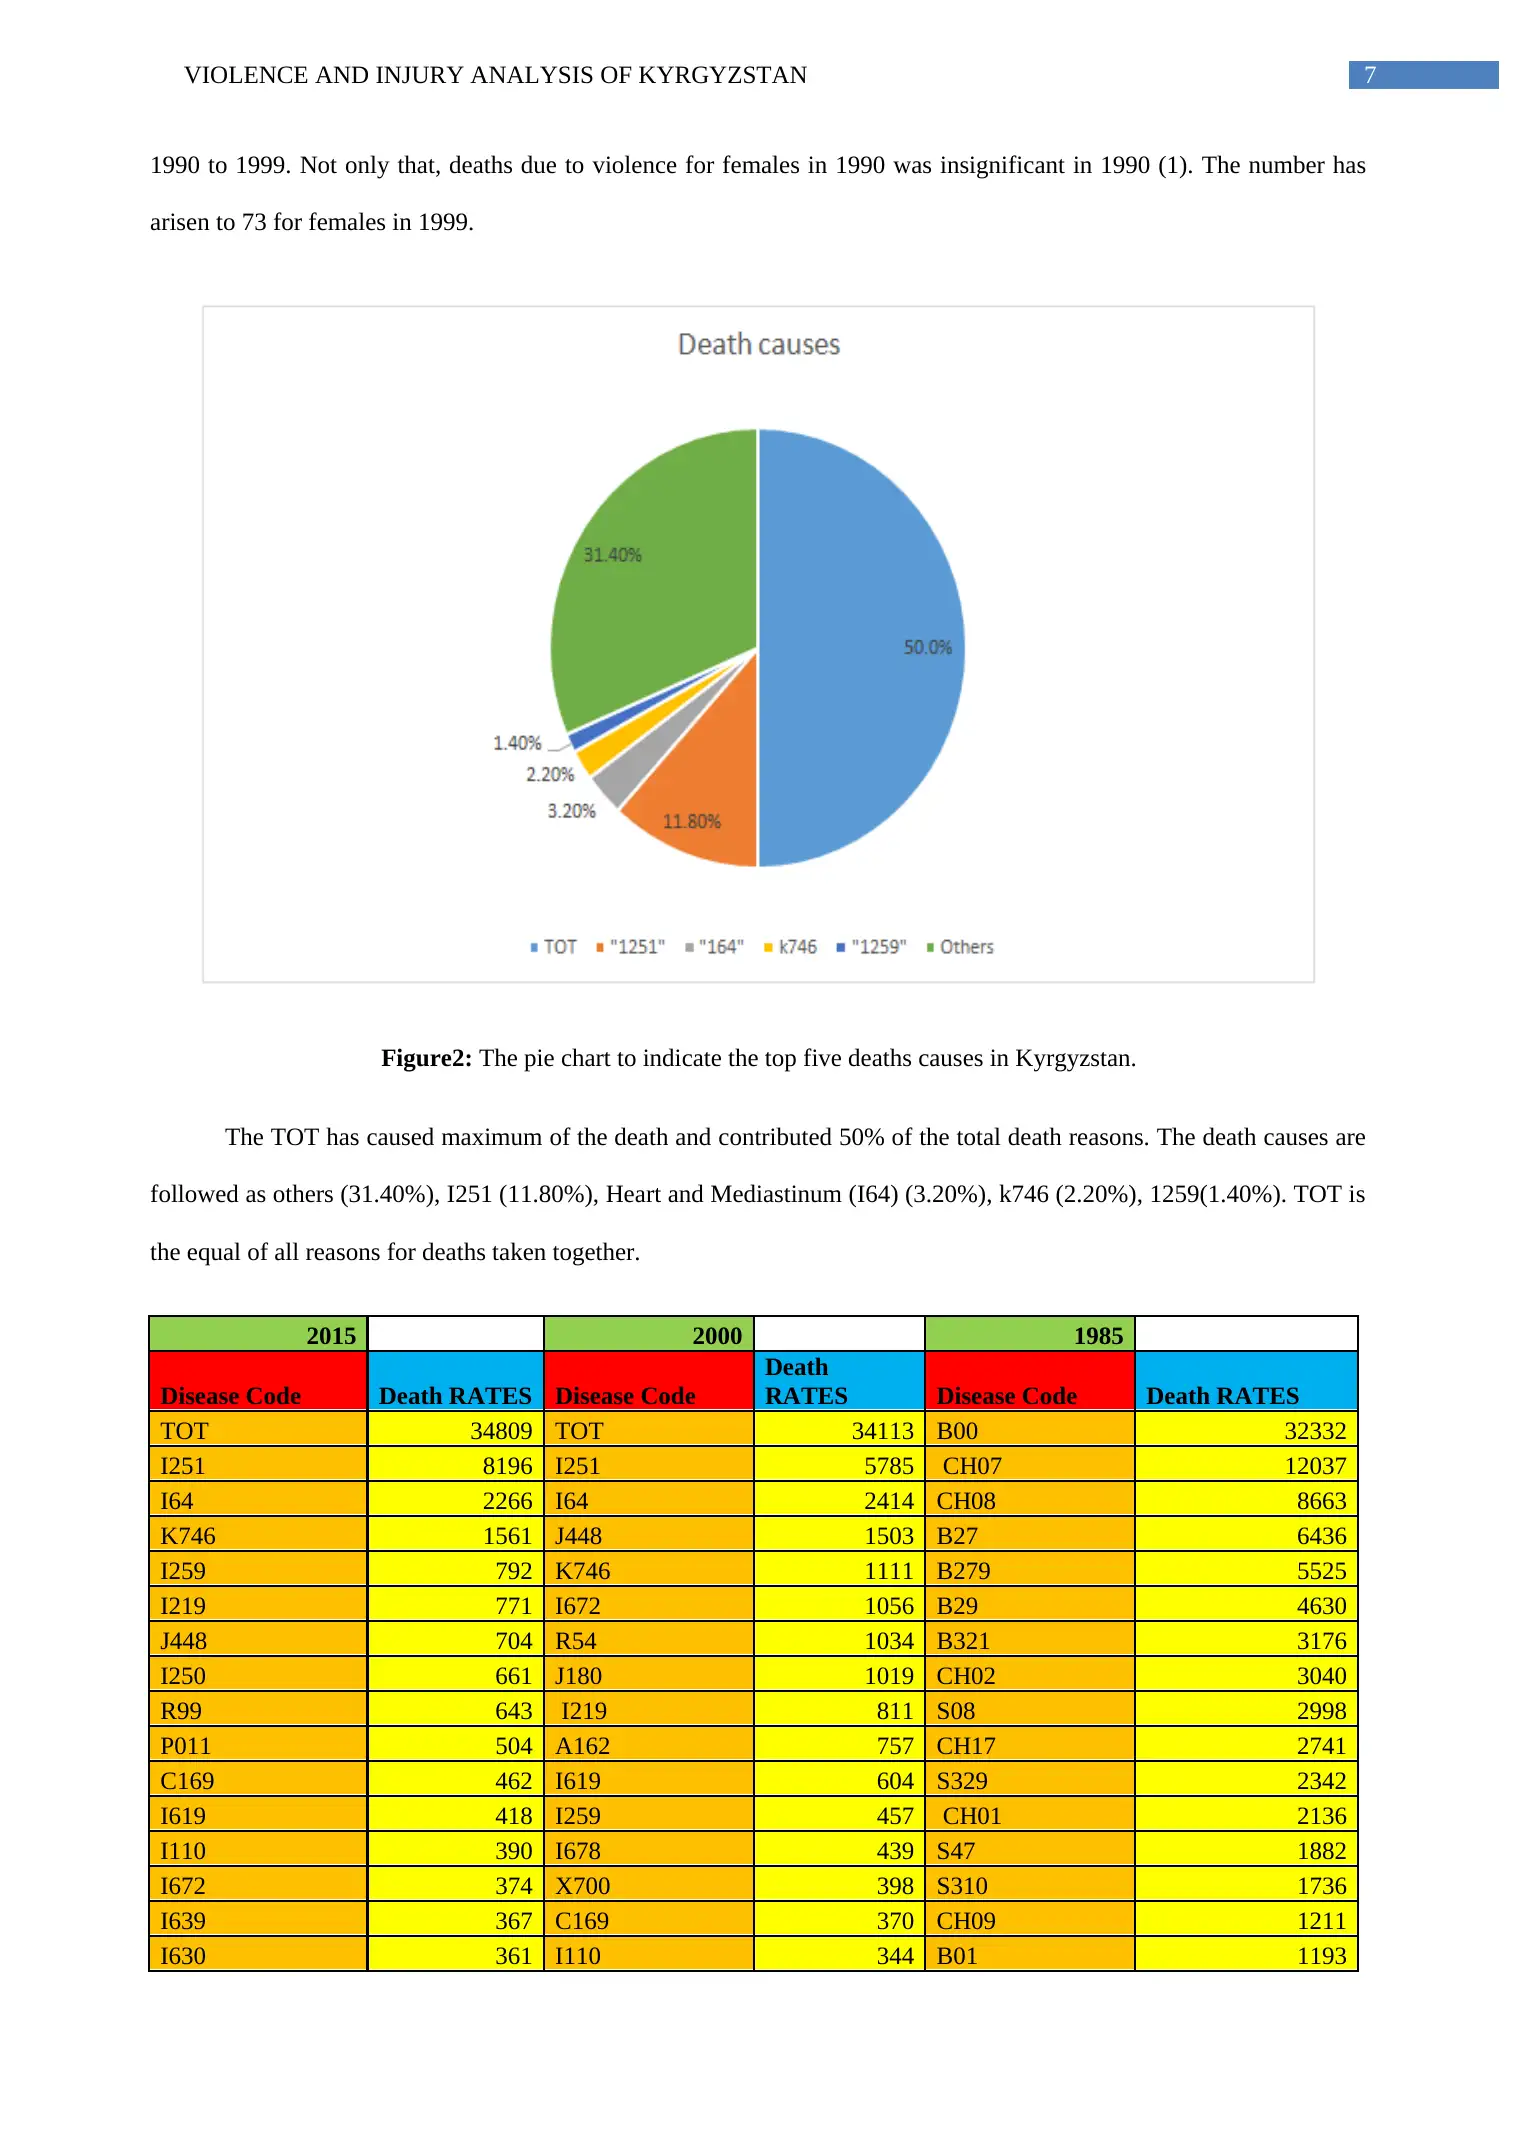
Figure 2: The pie chart and line diagram of data of deaths of road users of Kyrgyzstan of 2014 chosen from WHO
website.
The graph indicates that passengers (all vehicle) and pedestrians die due to injury in maximum. In 2007, the
deaths due to traffic injury (24 per 100,000 population) was maximum in Kyrgyzstan according to the line diagram.
Year 1999 Year 1995 Year 1990
Male Female Male Female Male Female
A 50 7 238 69 138 33
D 324 73 45 16 14 1
B 16 9 40 9 55 10
390 89 323 94 207 44
Total 479 417 251
Table1: Cause of death codes classified as a death due to injury or violence.
The total death due to violence is growing day by day from 1990 to 1995. The year wise cases of total violence is
accounted as 1990 (479), 1995 (417), 1990 (251). Especially deaths caused by violence of males in 1999 (324) has
become significant. It is also a notable fact that death due to accidental falls and deaths due to accidents by fire and
flames has decreased year after year. However, surprisingly, deaths due to violence have rapidly increased from year
Deaths due to violence has occurred due to sharp force (35%) followed by Unknown source (31%). Blunt force
(14%) and other (10%) sources are the significant reason of death due to violence.
The line diagram indicates that frequency of homicide is maximum (7.3 per 100000 population) in 2005 in
Kyrgyzstan.
Figure 2: The pie chart and line diagram of data of deaths of road users of Kyrgyzstan of 2014 chosen from WHO
website.
The graph indicates that passengers (all vehicle) and pedestrians die due to injury in maximum. In 2007, the
deaths due to traffic injury (24 per 100,000 population) was maximum in Kyrgyzstan according to the line diagram.
Year 1999 Year 1995 Year 1990
Male Female Male Female Male Female
A 50 7 238 69 138 33
D 324 73 45 16 14 1
B 16 9 40 9 55 10
390 89 323 94 207 44
Total 479 417 251
Table1: Cause of death codes classified as a death due to injury or violence.
The total death due to violence is growing day by day from 1990 to 1995. The year wise cases of total violence is
accounted as 1990 (479), 1995 (417), 1990 (251). Especially deaths caused by violence of males in 1999 (324) has
become significant. It is also a notable fact that death due to accidental falls and deaths due to accidents by fire and
flames has decreased year after year. However, surprisingly, deaths due to violence have rapidly increased from year
Paraphrase This Document
Need a fresh take? Get an instant paraphrase of this document with our AI Paraphraser
VIOLENCE AND INJURY ANALYSIS OF KYRGYZSTAN 7
1990 to 1999. Not only that, deaths due to violence for females in 1990 was insignificant in 1990 (1). The number has
arisen to 73 for females in 1999.
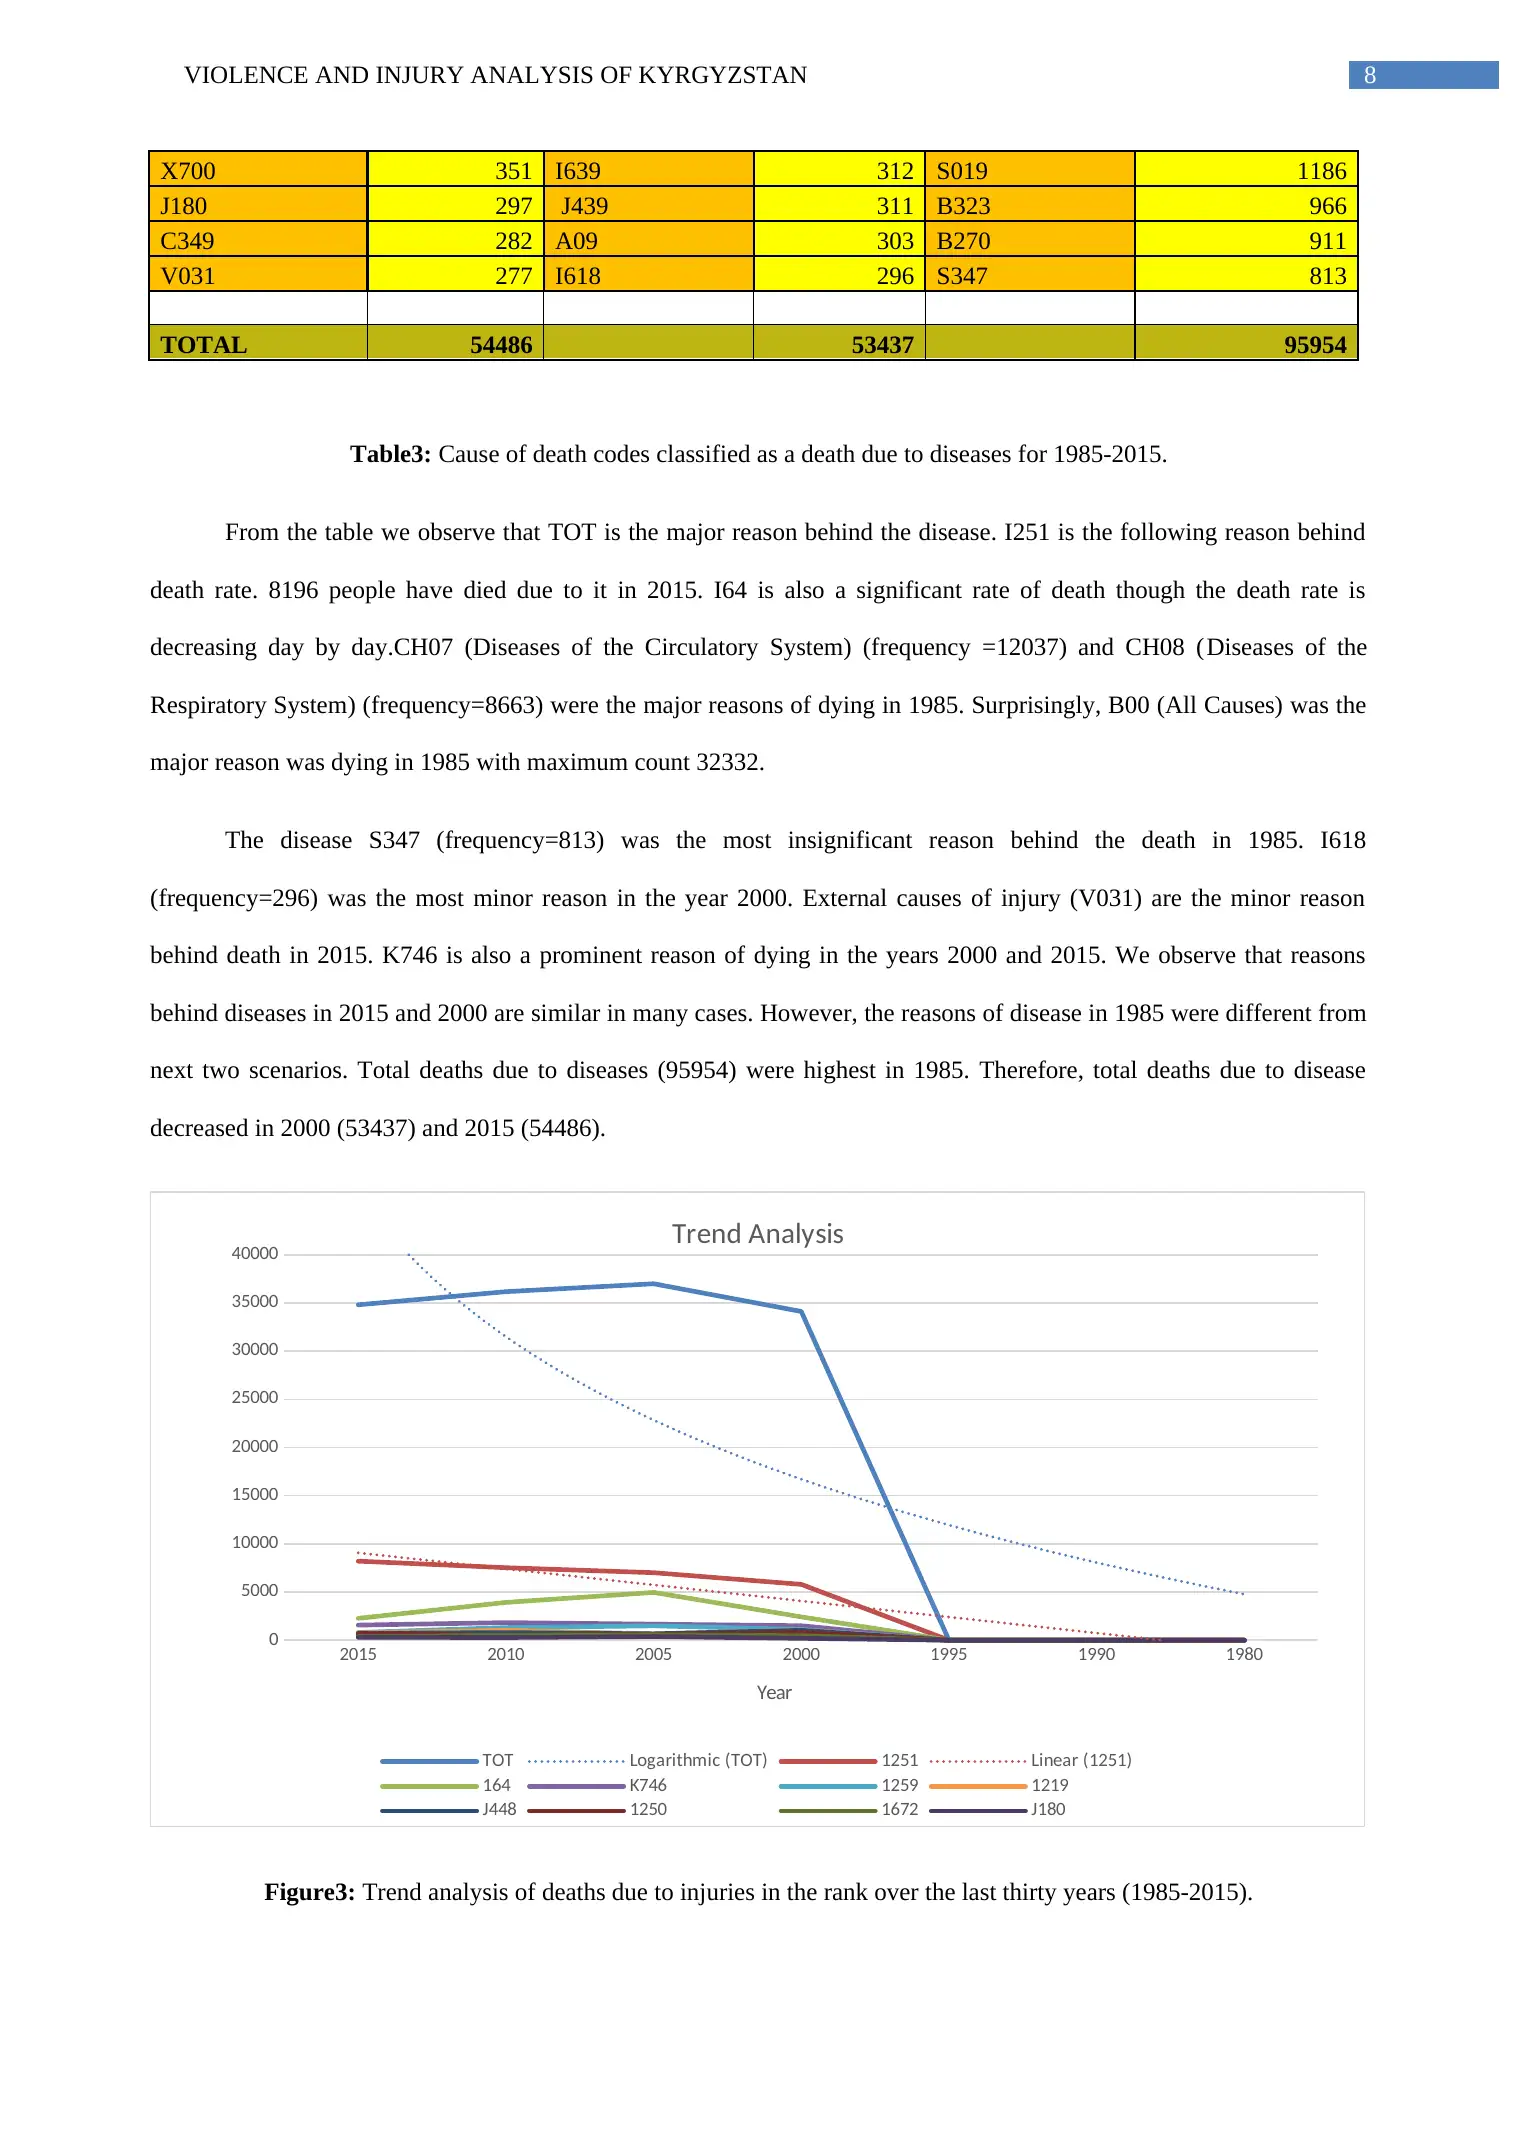
Figure2: The pie chart to indicate the top five deaths causes in Kyrgyzstan.
The TOT has caused maximum of the death and contributed 50% of the total death reasons. The death causes are
followed as others (31.40%), I251 (11.80%), Heart and Mediastinum (I64) (3.20%), k746 (2.20%), 1259(1.40%). TOT is
the equal of all reasons for deaths taken together.
2015 2000 1985
Disease Code Death RATES Disease Code
Death
RATES Disease Code Death RATES
TOT 34809 TOT 34113 B00 32332
I251 8196 I251 5785 CH07 12037
I64 2266 I64 2414 CH08 8663
K746 1561 J448 1503 B27 6436
I259 792 K746 1111 B279 5525
I219 771 I672 1056 B29 4630
J448 704 R54 1034 B321 3176
I250 661 J180 1019 CH02 3040
R99 643 I219 811 S08 2998
P011 504 A162 757 CH17 2741
C169 462 I619 604 S329 2342
I619 418 I259 457 CH01 2136
I110 390 I678 439 S47 1882
I672 374 X700 398 S310 1736
I639 367 C169 370 CH09 1211
I630 361 I110 344 B01 1193
1990 to 1999. Not only that, deaths due to violence for females in 1990 was insignificant in 1990 (1). The number has
arisen to 73 for females in 1999.
Figure2: The pie chart to indicate the top five deaths causes in Kyrgyzstan.
The TOT has caused maximum of the death and contributed 50% of the total death reasons. The death causes are
followed as others (31.40%), I251 (11.80%), Heart and Mediastinum (I64) (3.20%), k746 (2.20%), 1259(1.40%). TOT is
the equal of all reasons for deaths taken together.
2015 2000 1985
Disease Code Death RATES Disease Code
Death
RATES Disease Code Death RATES
TOT 34809 TOT 34113 B00 32332
I251 8196 I251 5785 CH07 12037
I64 2266 I64 2414 CH08 8663
K746 1561 J448 1503 B27 6436
I259 792 K746 1111 B279 5525
I219 771 I672 1056 B29 4630
J448 704 R54 1034 B321 3176
I250 661 J180 1019 CH02 3040
R99 643 I219 811 S08 2998
P011 504 A162 757 CH17 2741
C169 462 I619 604 S329 2342
I619 418 I259 457 CH01 2136
I110 390 I678 439 S47 1882
I672 374 X700 398 S310 1736
I639 367 C169 370 CH09 1211
I630 361 I110 344 B01 1193
VIOLENCE AND INJURY ANALYSIS OF KYRGYZSTAN 8
X700 351 I639 312 S019 1186
J180 297 J439 311 B323 966
C349 282 A09 303 B270 911
V031 277 I618 296 S347 813
TOTAL 54486 53437 95954
Table3: Cause of death codes classified as a death due to diseases for 1985-2015.
From the table we observe that TOT is the major reason behind the disease. I251 is the following reason behind
death rate. 8196 people have died due to it in 2015. I64 is also a significant rate of death though the death rate is
decreasing day by day.CH07 (Diseases of the Circulatory System) (frequency =12037) and CH08 (Diseases of the
Respiratory System) (frequency=8663) were the major reasons of dying in 1985. Surprisingly, B00 (All Causes) was the
major reason was dying in 1985 with maximum count 32332.
The disease S347 (frequency=813) was the most insignificant reason behind the death in 1985. I618
(frequency=296) was the most minor reason in the year 2000. External causes of injury (V031) are the minor reason
behind death in 2015. K746 is also a prominent reason of dying in the years 2000 and 2015. We observe that reasons
behind diseases in 2015 and 2000 are similar in many cases. However, the reasons of disease in 1985 were different from
next two scenarios. Total deaths due to diseases (95954) were highest in 1985. Therefore, total deaths due to disease
decreased in 2000 (53437) and 2015 (54486).
2015 2010 2005 2000 1995 1990 1980
0
5000
10000
15000
20000
25000
30000
35000
40000 Trend Analysis
TOT Logarithmic (TOT) 1251 Linear (1251)
164 K746 1259 1219
J448 1250 1672 J180
Year
Figure3: Trend analysis of deaths due to injuries in the rank over the last thirty years (1985-2015).
⊘ This is a preview!⊘
Do you want full access?
Subscribe today to unlock all pages.
Trusted by 1+ million students worldwide
VIOLENCE AND INJURY ANALYSIS OF KYRGYZSTAN 9
The important issue to observe that TOT has risen to be major reason of death after 1995. However, the cause was
not prominent at 1995. I251 is another major cause of disease that has grown linearly year by year from 1985 to 2015.
Disease I64 was not the significant reason of death in 1985 but became in 2000. The frequency is downwards again in
2015. I259, J448 is also increasing gradually in 30 years.
It could be said, that the death rates have increased over the past thirty years; such thing has happened due to
limited access to the resources and inadequate healthcare facilities.
AGE GROUP
(15-19)
AGE GROUP (20-24 ) AGE GROUP
(25-29)
TOT 316 TOT 510 TOT 683
X700 48 R99 44 R99 51
R99 26 X700 42 V031 35
V031 10 V031 27 X700 28
K746 9 V899 21 K746 26
TOTAL 409 TOTAL 644 TOTAL 823
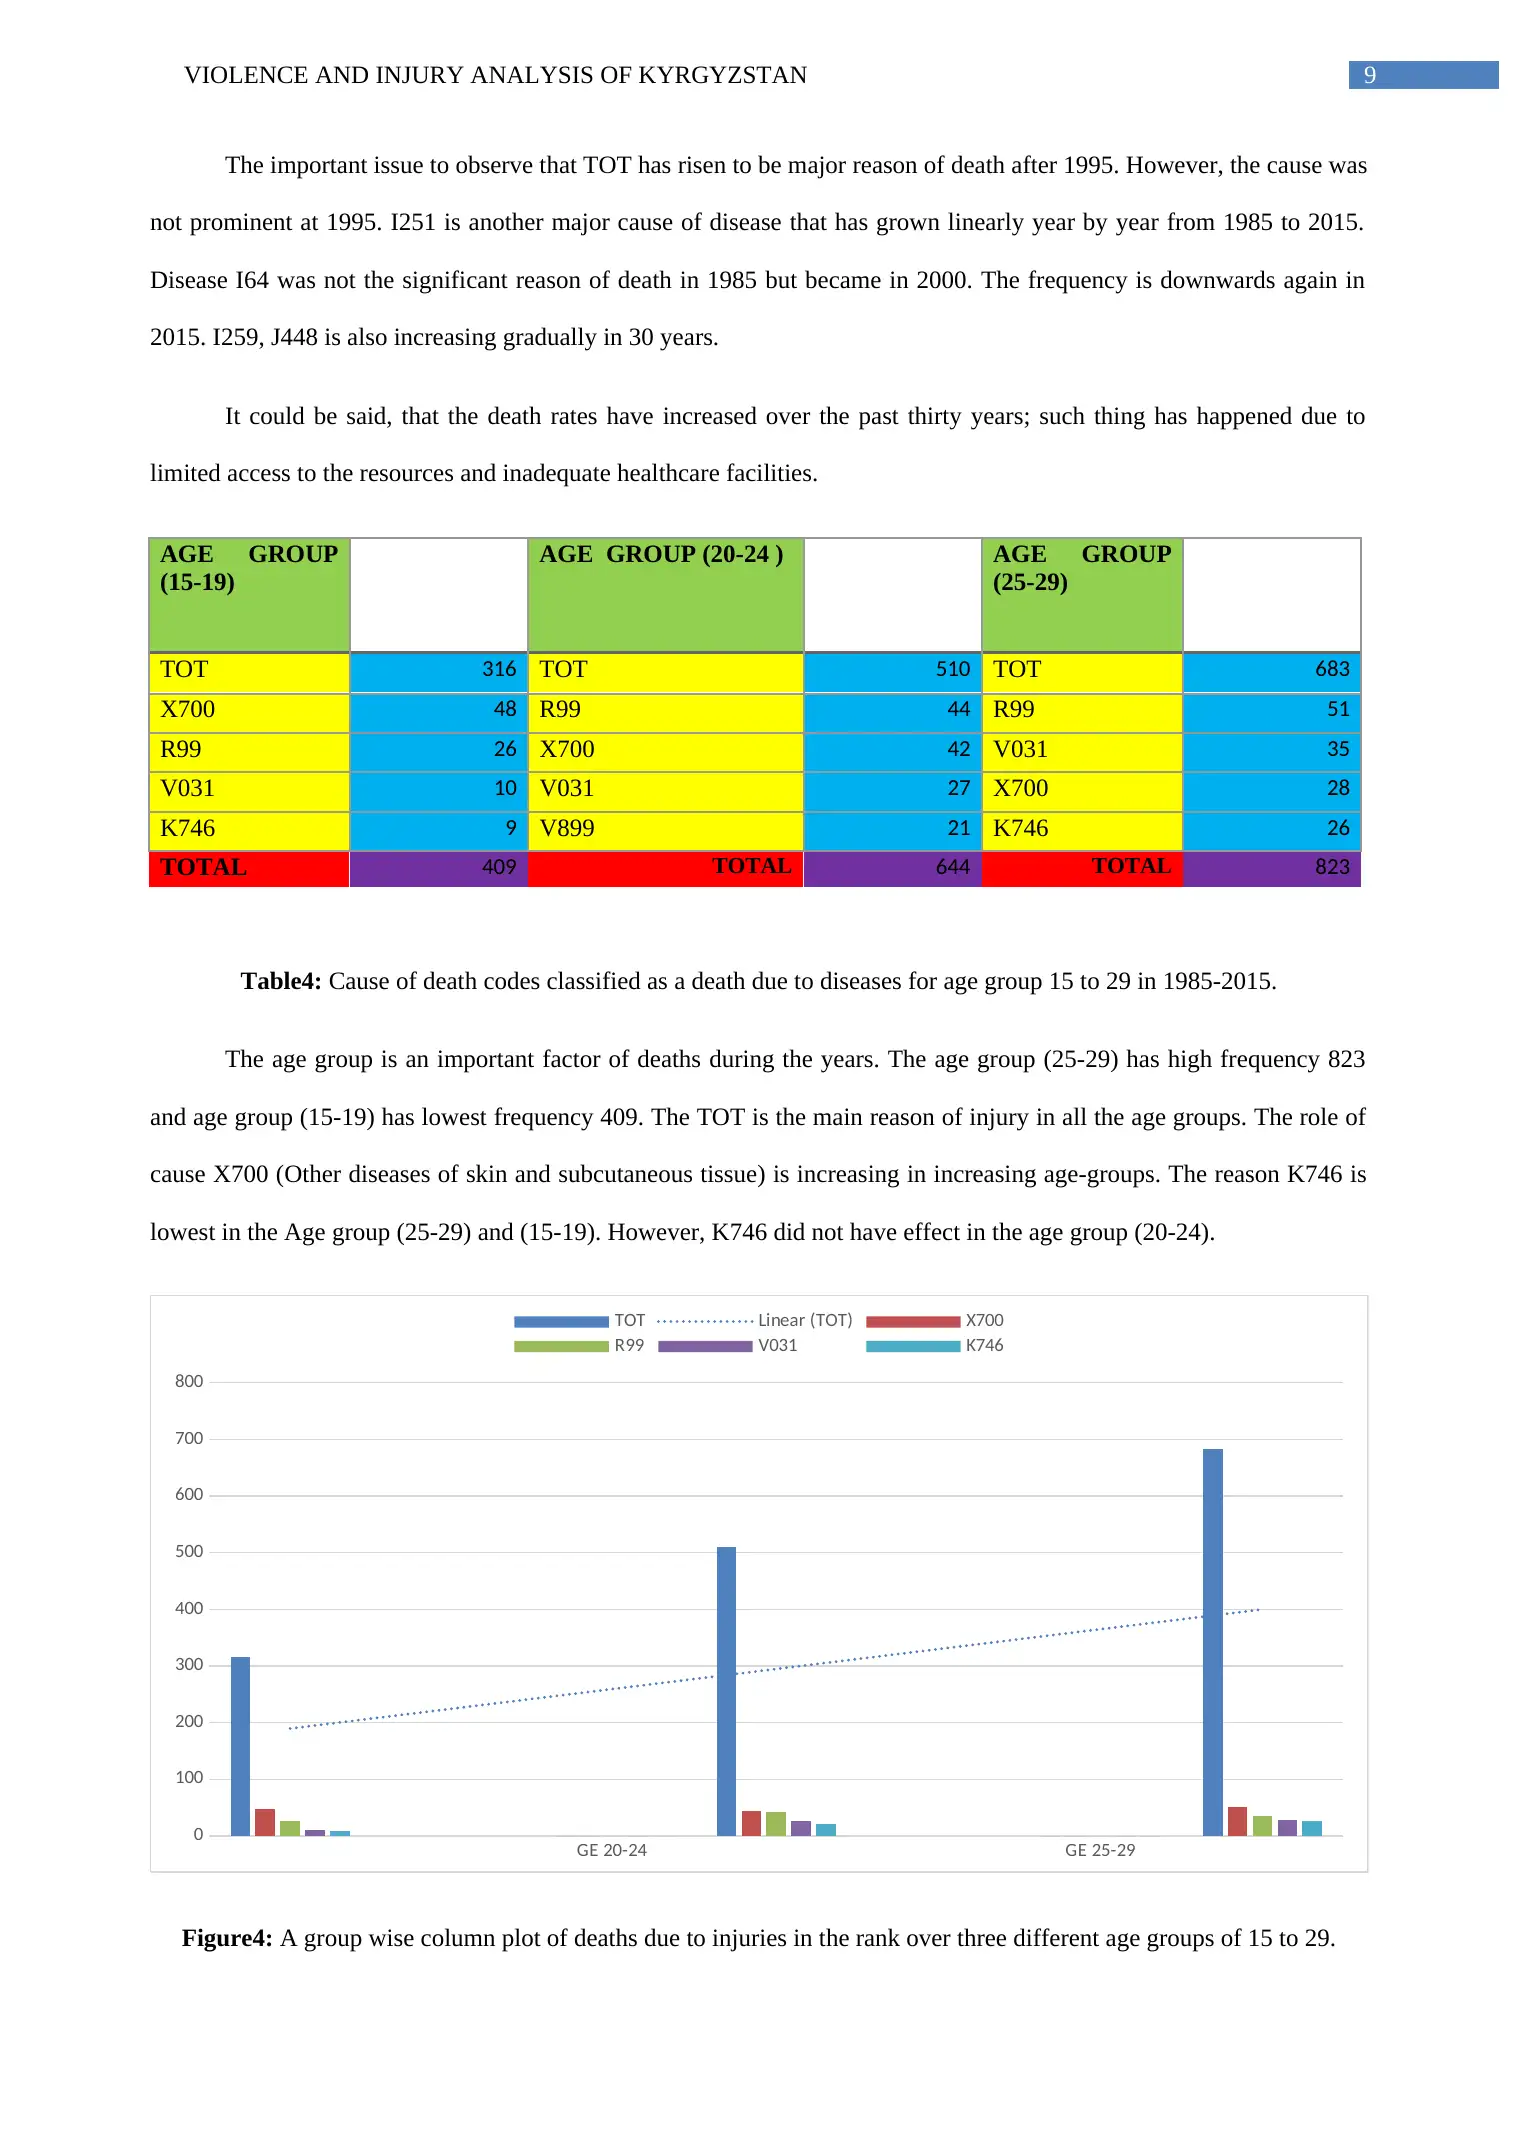
Table4: Cause of death codes classified as a death due to diseases for age group 15 to 29 in 1985-2015.
The age group is an important factor of deaths during the years. The age group (25-29) has high frequency 823
and age group (15-19) has lowest frequency 409. The TOT is the main reason of injury in all the age groups. The role of
cause X700 (Other diseases of skin and subcutaneous tissue) is increasing in increasing age-groups. The reason K746 is
lowest in the Age group (25-29) and (15-19). However, K746 did not have effect in the age group (20-24).
GE 20-24 GE 25-29
0
100
200
300
400
500
600
700
800
TOT Linear (TOT) X700
R99 V031 K746
Figure4: A group wise column plot of deaths due to injuries in the rank over three different age groups of 15 to 29.
The important issue to observe that TOT has risen to be major reason of death after 1995. However, the cause was
not prominent at 1995. I251 is another major cause of disease that has grown linearly year by year from 1985 to 2015.
Disease I64 was not the significant reason of death in 1985 but became in 2000. The frequency is downwards again in
2015. I259, J448 is also increasing gradually in 30 years.
It could be said, that the death rates have increased over the past thirty years; such thing has happened due to
limited access to the resources and inadequate healthcare facilities.
AGE GROUP
(15-19)
AGE GROUP (20-24 ) AGE GROUP
(25-29)
TOT 316 TOT 510 TOT 683
X700 48 R99 44 R99 51
R99 26 X700 42 V031 35
V031 10 V031 27 X700 28
K746 9 V899 21 K746 26
TOTAL 409 TOTAL 644 TOTAL 823
Table4: Cause of death codes classified as a death due to diseases for age group 15 to 29 in 1985-2015.
The age group is an important factor of deaths during the years. The age group (25-29) has high frequency 823
and age group (15-19) has lowest frequency 409. The TOT is the main reason of injury in all the age groups. The role of
cause X700 (Other diseases of skin and subcutaneous tissue) is increasing in increasing age-groups. The reason K746 is
lowest in the Age group (25-29) and (15-19). However, K746 did not have effect in the age group (20-24).
GE 20-24 GE 25-29
0
100
200
300
400
500
600
700
800
TOT Linear (TOT) X700
R99 V031 K746
Figure4: A group wise column plot of deaths due to injuries in the rank over three different age groups of 15 to 29.
Paraphrase This Document
Need a fresh take? Get an instant paraphrase of this document with our AI Paraphraser
VIOLENCE AND INJURY ANALYSIS OF KYRGYZSTAN 10
From the above-analyzed graph, it could be seen that the most vulnerable age group is from Age 25-29 years. The
least vulnerable age group is 15-19 years. We have observed an increasing linear trend line of deaths of increasing group
wise column plot.
The next question is,
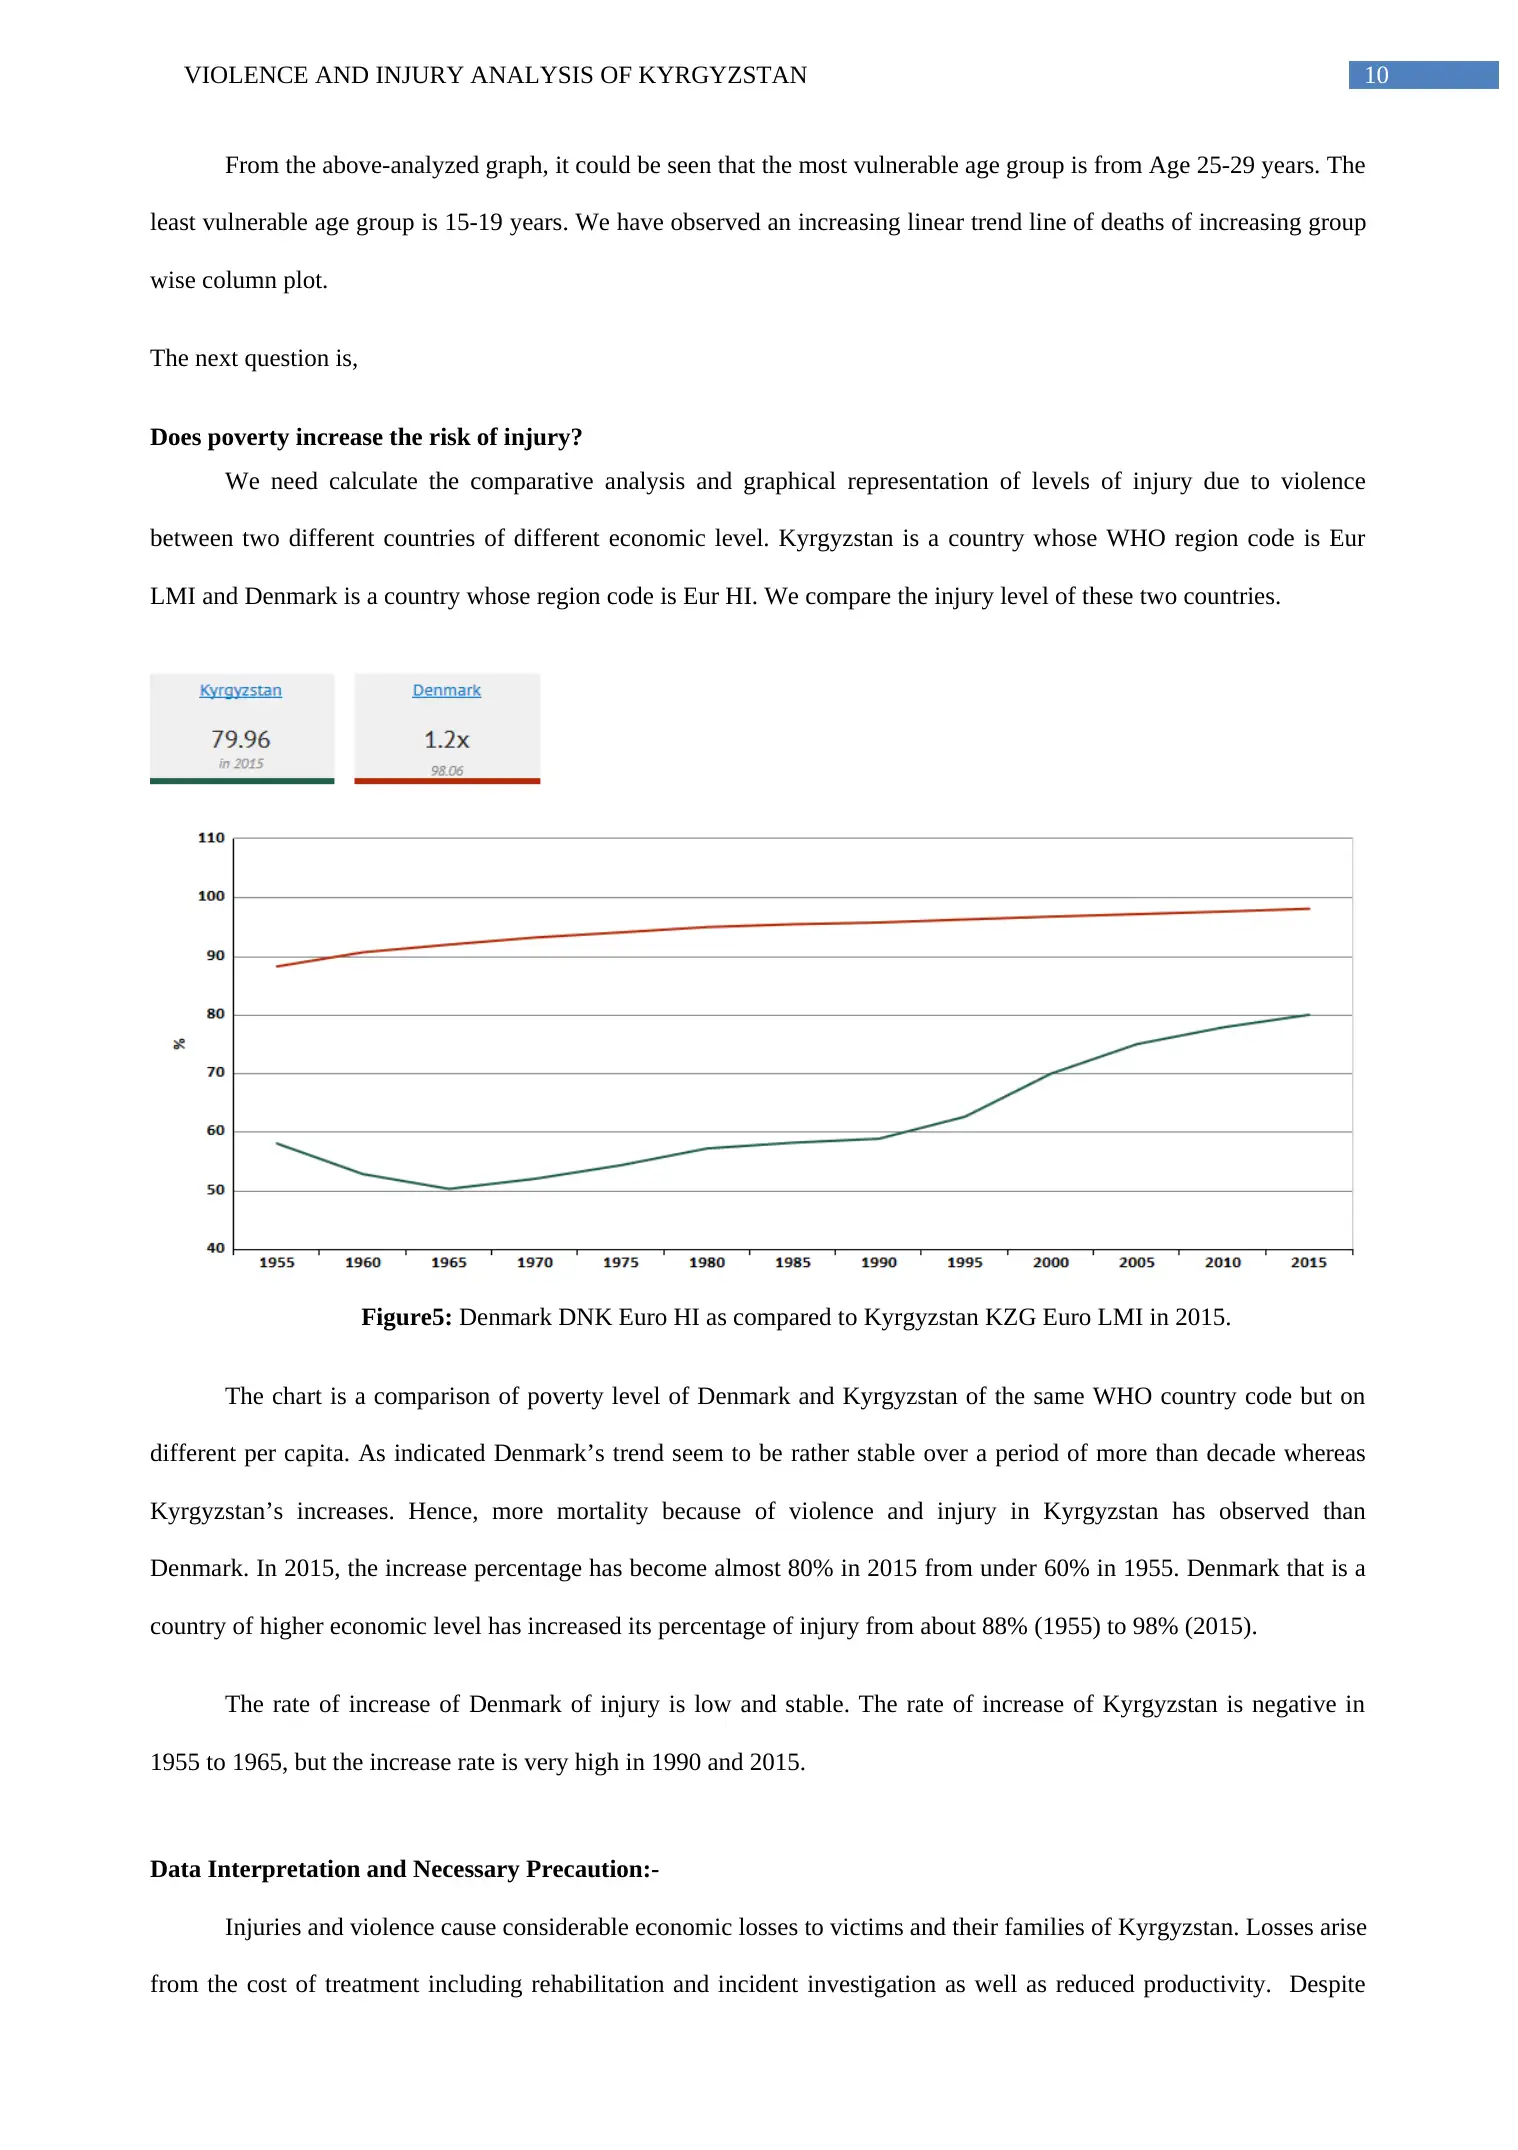
Does poverty increase the risk of injury?
We need calculate the comparative analysis and graphical representation of levels of injury due to violence
between two different countries of different economic level. Kyrgyzstan is a country whose WHO region code is Eur
LMI and Denmark is a country whose region code is Eur HI. We compare the injury level of these two countries.
Figure5: Denmark DNK Euro HI as compared to Kyrgyzstan KZG Euro LMI in 2015.
The chart is a comparison of poverty level of Denmark and Kyrgyzstan of the same WHO country code but on
different per capita. As indicated Denmark’s trend seem to be rather stable over a period of more than decade whereas
Kyrgyzstan’s increases. Hence, more mortality because of violence and injury in Kyrgyzstan has observed than
Denmark. In 2015, the increase percentage has become almost 80% in 2015 from under 60% in 1955. Denmark that is a
country of higher economic level has increased its percentage of injury from about 88% (1955) to 98% (2015).
The rate of increase of Denmark of injury is low and stable. The rate of increase of Kyrgyzstan is negative in
1955 to 1965, but the increase rate is very high in 1990 and 2015.
Data Interpretation and Necessary Precaution:-
Injuries and violence cause considerable economic losses to victims and their families of Kyrgyzstan. Losses arise
from the cost of treatment including rehabilitation and incident investigation as well as reduced productivity. Despite
From the above-analyzed graph, it could be seen that the most vulnerable age group is from Age 25-29 years. The
least vulnerable age group is 15-19 years. We have observed an increasing linear trend line of deaths of increasing group
wise column plot.
The next question is,
Does poverty increase the risk of injury?
We need calculate the comparative analysis and graphical representation of levels of injury due to violence
between two different countries of different economic level. Kyrgyzstan is a country whose WHO region code is Eur
LMI and Denmark is a country whose region code is Eur HI. We compare the injury level of these two countries.
Figure5: Denmark DNK Euro HI as compared to Kyrgyzstan KZG Euro LMI in 2015.
The chart is a comparison of poverty level of Denmark and Kyrgyzstan of the same WHO country code but on
different per capita. As indicated Denmark’s trend seem to be rather stable over a period of more than decade whereas
Kyrgyzstan’s increases. Hence, more mortality because of violence and injury in Kyrgyzstan has observed than
Denmark. In 2015, the increase percentage has become almost 80% in 2015 from under 60% in 1955. Denmark that is a
country of higher economic level has increased its percentage of injury from about 88% (1955) to 98% (2015).
The rate of increase of Denmark of injury is low and stable. The rate of increase of Kyrgyzstan is negative in
1955 to 1965, but the increase rate is very high in 1990 and 2015.
Data Interpretation and Necessary Precaution:-
Injuries and violence cause considerable economic losses to victims and their families of Kyrgyzstan. Losses arise
from the cost of treatment including rehabilitation and incident investigation as well as reduced productivity. Despite
VIOLENCE AND INJURY ANALYSIS OF KYRGYZSTAN 11
growing awareness of the magnitude of the problem, attention to injury and violence prevention and control among
policy-makers and those funding global public health programming remains disproportionately low. Deaths related injury
and violence is growing rapidly.
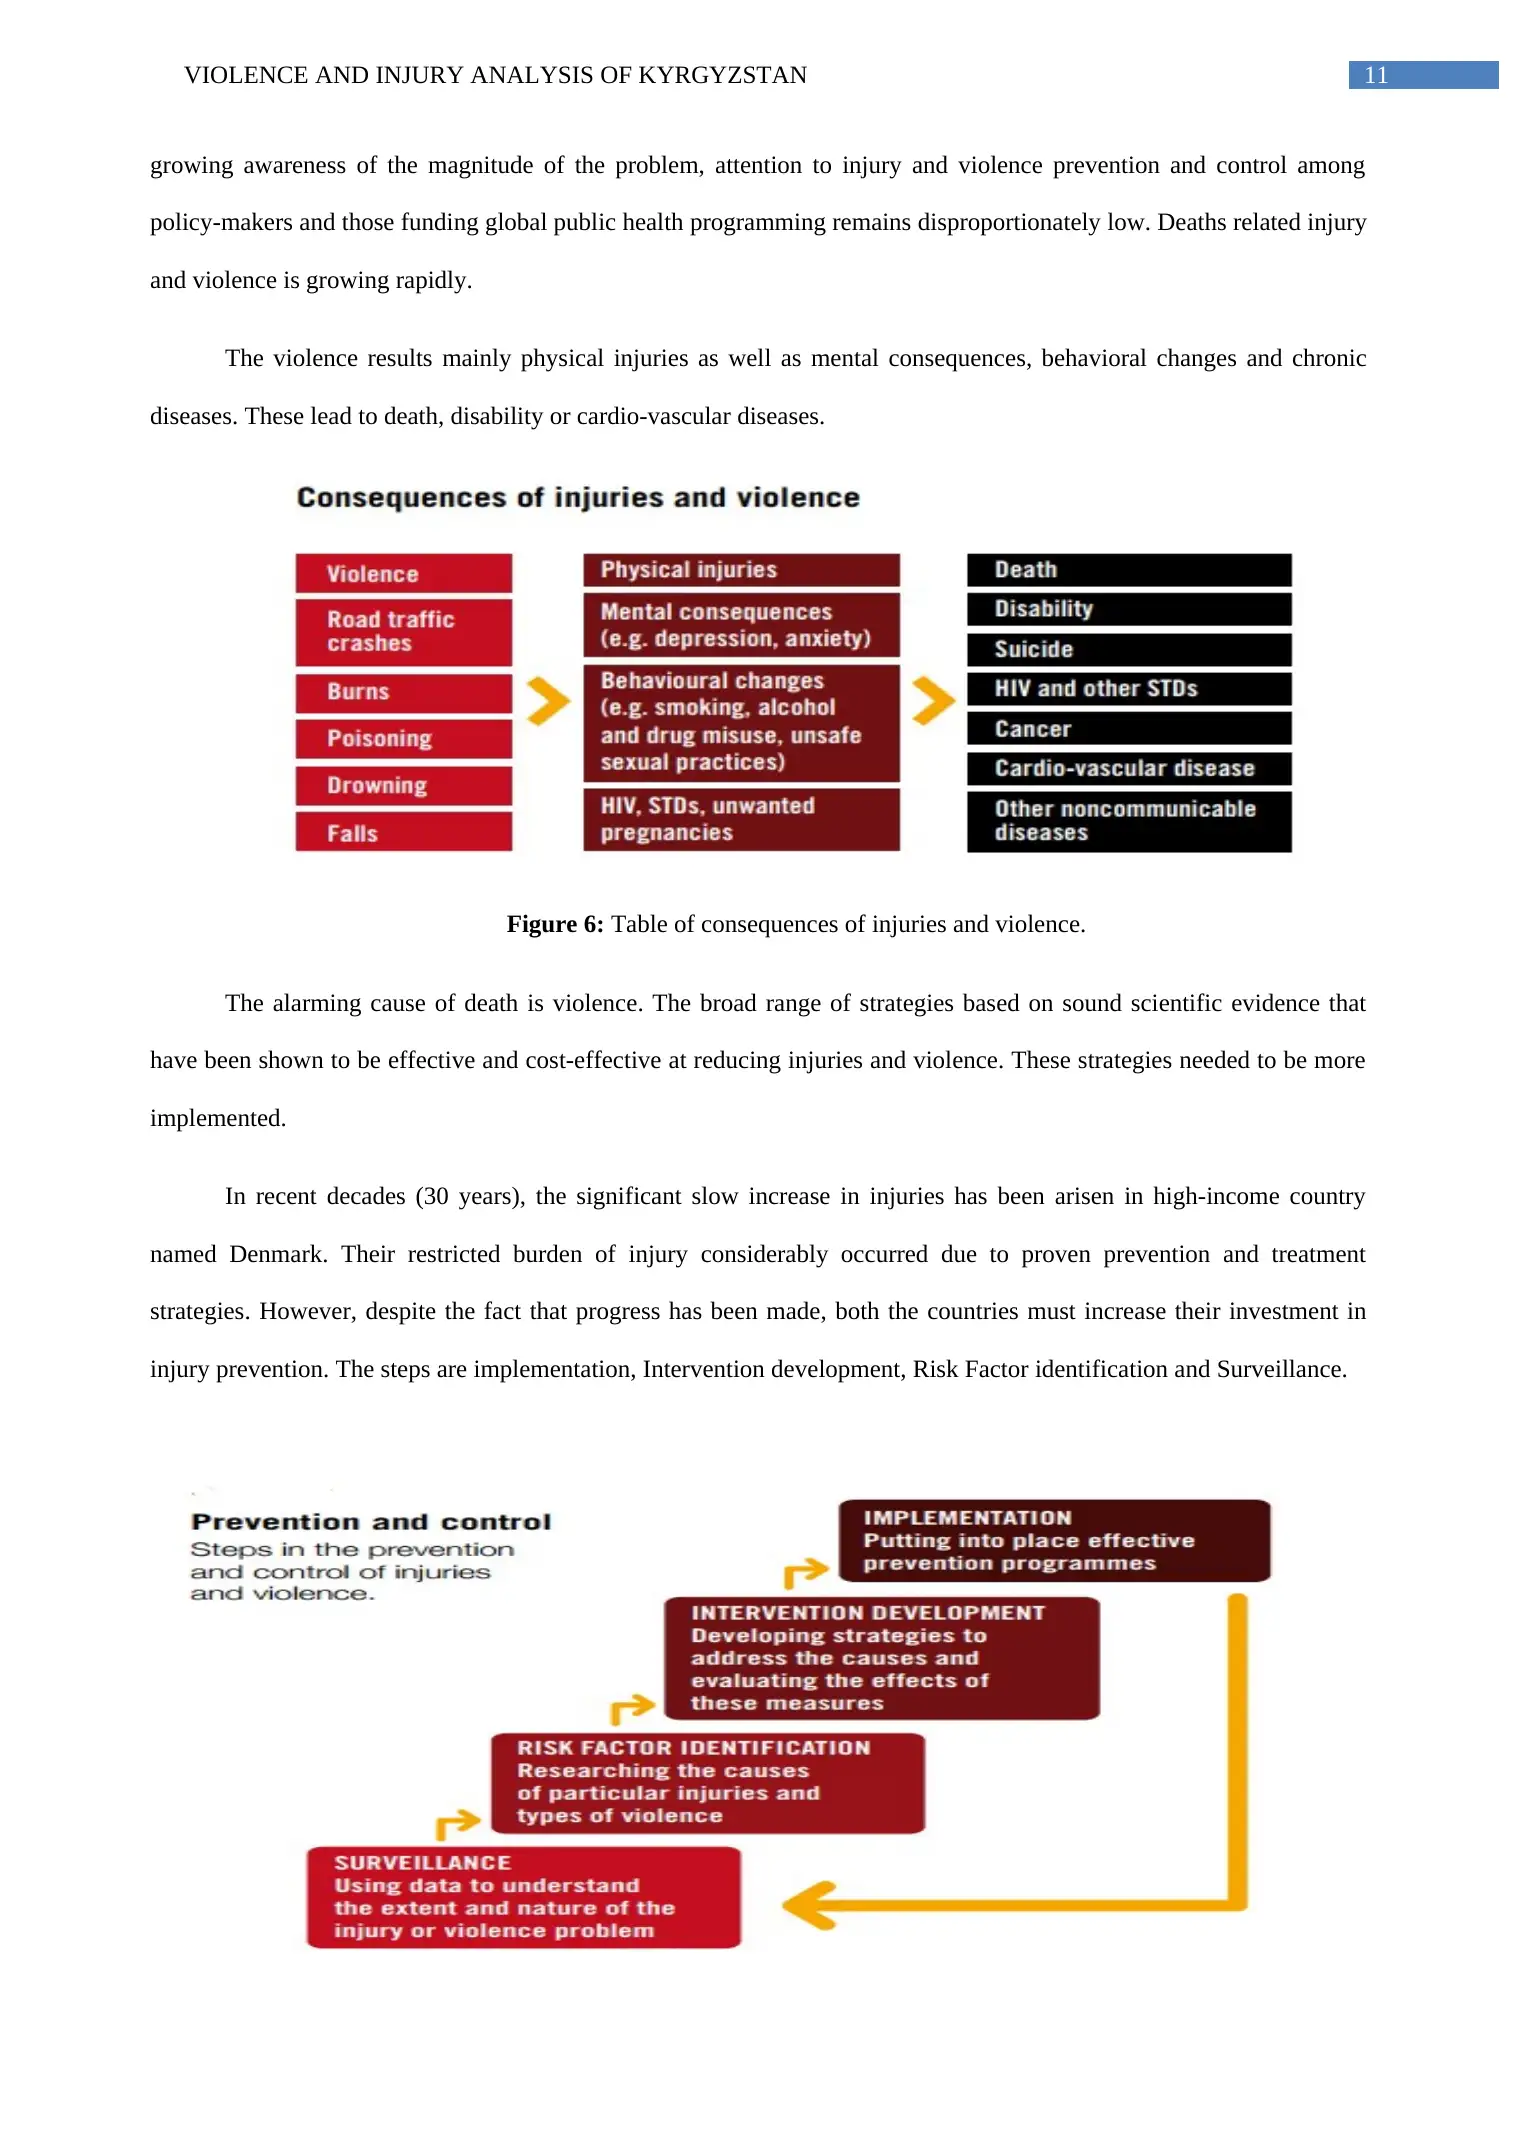
The violence results mainly physical injuries as well as mental consequences, behavioral changes and chronic
diseases. These lead to death, disability or cardio-vascular diseases.
Figure 6: Table of consequences of injuries and violence.
The alarming cause of death is violence. The broad range of strategies based on sound scientific evidence that
have been shown to be effective and cost-effective at reducing injuries and violence. These strategies needed to be more
implemented.
In recent decades (30 years), the significant slow increase in injuries has been arisen in high-income country
named Denmark. Their restricted burden of injury considerably occurred due to proven prevention and treatment
strategies. However, despite the fact that progress has been made, both the countries must increase their investment in
injury prevention. The steps are implementation, Intervention development, Risk Factor identification and Surveillance.
growing awareness of the magnitude of the problem, attention to injury and violence prevention and control among
policy-makers and those funding global public health programming remains disproportionately low. Deaths related injury
and violence is growing rapidly.
The violence results mainly physical injuries as well as mental consequences, behavioral changes and chronic
diseases. These lead to death, disability or cardio-vascular diseases.
Figure 6: Table of consequences of injuries and violence.
The alarming cause of death is violence. The broad range of strategies based on sound scientific evidence that
have been shown to be effective and cost-effective at reducing injuries and violence. These strategies needed to be more
implemented.
In recent decades (30 years), the significant slow increase in injuries has been arisen in high-income country
named Denmark. Their restricted burden of injury considerably occurred due to proven prevention and treatment
strategies. However, despite the fact that progress has been made, both the countries must increase their investment in
injury prevention. The steps are implementation, Intervention development, Risk Factor identification and Surveillance.
⊘ This is a preview!⊘
Do you want full access?
Subscribe today to unlock all pages.
Trusted by 1+ million students worldwide
1 out of 14
Related Documents


Your All-in-One AI-Powered Toolkit for Academic Success.
+13062052269
info@desklib.com
Available 24*7 on WhatsApp / Email
![[object Object]](/_next/static/media/star-bottom.7253800d.svg)
Unlock your academic potential
Copyright © 2020–2026 A2Z Services. All Rights Reserved. Developed and managed by ZUCOL.