Evaluating L Brand Inc.'s WACC and Dividend Policy Strategies
VerifiedAdded on 2023/06/03
|18
|3251
|221
Report
AI Summary
This report provides a financial analysis of L Brand Inc., focusing on its weighted average cost of capital (WACC) and dividend policy. It calculates the cost of equity using both historical and implied equity premiums, determines the cost of debt, and then computes the WACC. The analysis also evaluates the company's dividend policy over the last five years, examining cash returned to shareholders through dividends and buybacks, comparing these figures to Free Cash Flow to Equity (FCFE). The report assesses the firm's performance using ROE and cost of equity benchmarks, discusses recent financial changes including share repurchases, and provides a recommendation to reduce the dividend payout ratio to improve retained earnings and overall financial performance. The FCFE analysis suggests the stock is undervalued. The report concludes that a reduced dividend payout could enhance the company's capital market position.
1
Weighted Average cost of capital of L Brand
Weighted Average cost of capital of L Brand
Paraphrase This Document
Need a fresh take? Get an instant paraphrase of this document with our AI Paraphraser
2
Contents
2.1: Cost of Equity...................................................................................................................................3
2.1.1: Risk free rate of return..................................................................................................................3
2.1.2: Market equity premium................................................................................................................3
2.1.3: Stock Beta......................................................................................................................................5
2.2: Cost of Debt......................................................................................................................................5
2.3 Weighted Average Cost of Capital (WACC)........................................................................................6
Section 3......................................................................................................................................................8
Introduction.................................................................................................................................................9
Current dividend policy...............................................................................................................................9
Recent financial changes.............................................................................................................................9
FCFE analysis.............................................................................................................................................10
Performance of the firm............................................................................................................................10
Recommendation and conclusion.............................................................................................................11
Appendix...................................................................................................................................................13
3
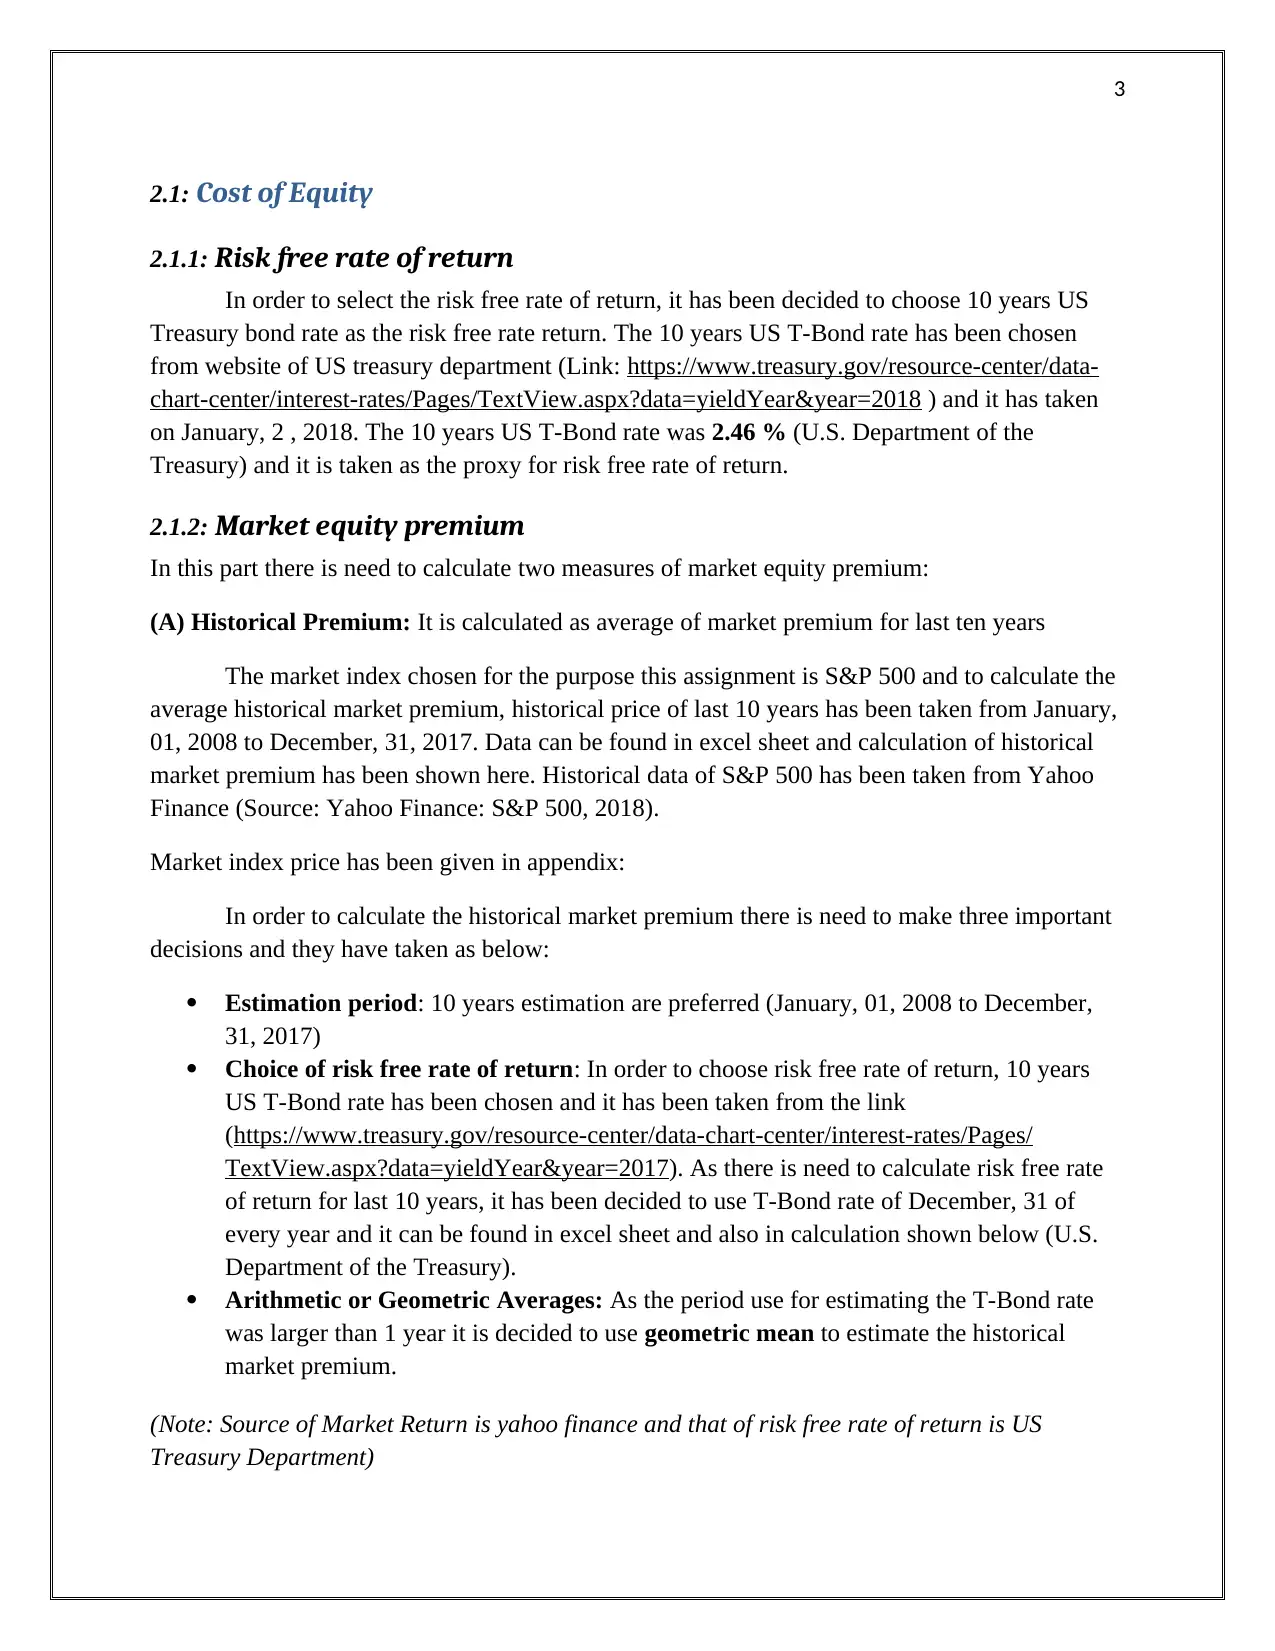
2.1: Cost of Equity
2.1.1: Risk free rate of return
In order to select the risk free rate of return, it has been decided to choose 10 years US
Treasury bond rate as the risk free rate return. The 10 years US T-Bond rate has been chosen
from website of US treasury department (Link: https://www.treasury.gov/resource-center/data-
chart-center/interest-rates/Pages/TextView.aspx?data=yieldYear&year=2018 ) and it has taken
on January, 2 , 2018. The 10 years US T-Bond rate was 2.46 % (U.S. Department of the
Treasury) and it is taken as the proxy for risk free rate of return.
2.1.2: Market equity premium
In this part there is need to calculate two measures of market equity premium:
(A) Historical Premium: It is calculated as average of market premium for last ten years
The market index chosen for the purpose this assignment is S&P 500 and to calculate the
average historical market premium, historical price of last 10 years has been taken from January,
01, 2008 to December, 31, 2017. Data can be found in excel sheet and calculation of historical
market premium has been shown here. Historical data of S&P 500 has been taken from Yahoo
Finance (Source: Yahoo Finance: S&P 500, 2018).
Market index price has been given in appendix:
In order to calculate the historical market premium there is need to make three important
decisions and they have taken as below:
Estimation period: 10 years estimation are preferred (January, 01, 2008 to December,
31, 2017)
Choice of risk free rate of return: In order to choose risk free rate of return, 10 years
US T-Bond rate has been chosen and it has been taken from the link
(https://www.treasury.gov/resource-center/data-chart-center/interest-rates/Pages/
TextView.aspx?data=yieldYear&year=2017). As there is need to calculate risk free rate
of return for last 10 years, it has been decided to use T-Bond rate of December, 31 of
every year and it can be found in excel sheet and also in calculation shown below (U.S.
Department of the Treasury).
Arithmetic or Geometric Averages: As the period use for estimating the T-Bond rate
was larger than 1 year it is decided to use geometric mean to estimate the historical
market premium.
(Note: Source of Market Return is yahoo finance and that of risk free rate of return is US
Treasury Department)
⊘ This is a preview!⊘
Do you want full access?
Subscribe today to unlock all pages.
Trusted by 1+ million students worldwide
4
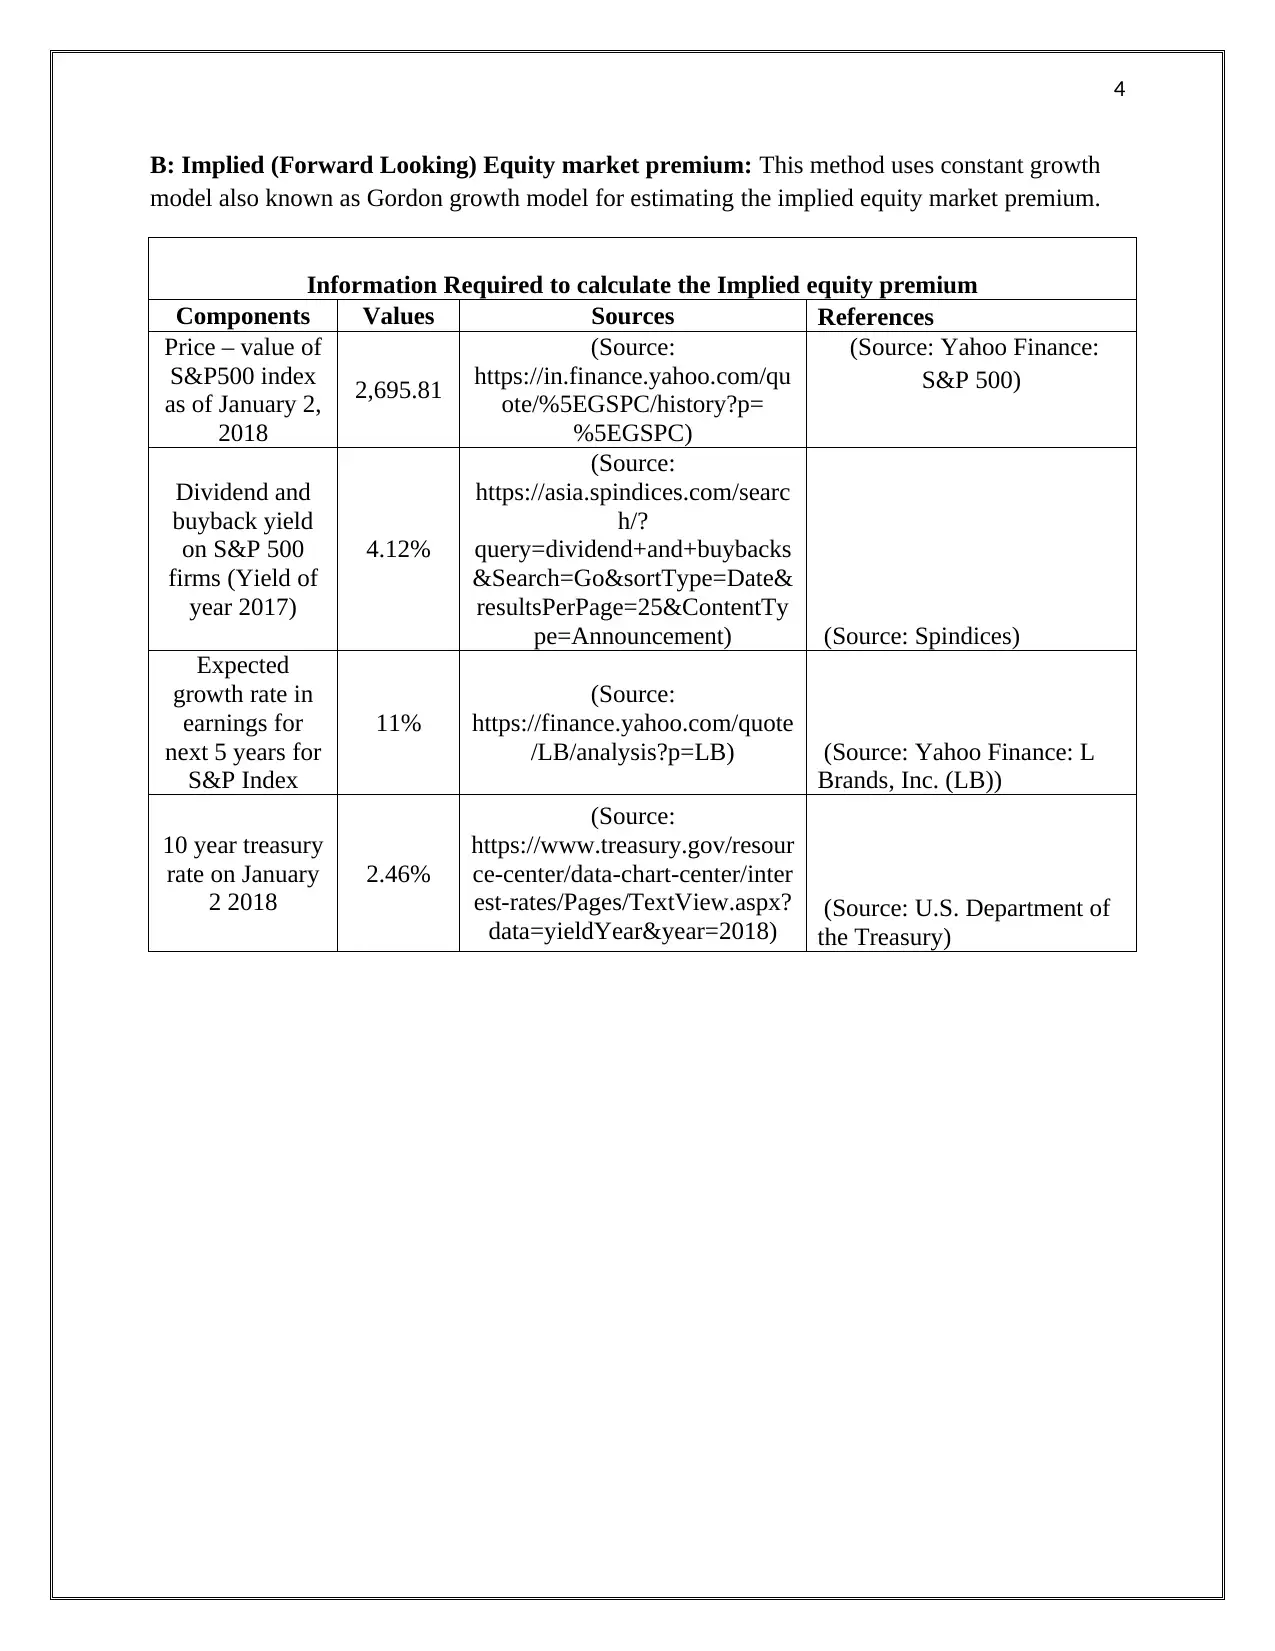
B: Implied (Forward Looking) Equity market premium: This method uses constant growth
model also known as Gordon growth model for estimating the implied equity market premium.
Information Required to calculate the Implied equity premium
Components Values Sources References
Price – value of
S&P500 index
as of January 2,
2018
2,695.81
(Source:
https://in.finance.yahoo.com/qu
ote/%5EGSPC/history?p=
%5EGSPC)
(Source: Yahoo Finance:
S&P 500)
Dividend and
buyback yield
on S&P 500
firms (Yield of
year 2017)
4.12%
(Source:
https://asia.spindices.com/searc
h/?
query=dividend+and+buybacks
&Search=Go&sortType=Date&
resultsPerPage=25&ContentTy
pe=Announcement) (Source: Spindices)
Expected
growth rate in
earnings for
next 5 years for
S&P Index
11%
(Source:
https://finance.yahoo.com/quote
/LB/analysis?p=LB) (Source: Yahoo Finance: L
Brands, Inc. (LB))
10 year treasury
rate on January
2 2018
2.46%
(Source:
https://www.treasury.gov/resour
ce-center/data-chart-center/inter
est-rates/Pages/TextView.aspx?
data=yieldYear&year=2018) (Source: U.S. Department of
the Treasury)
Paraphrase This Document
Need a fresh take? Get an instant paraphrase of this document with our AI Paraphraser
5
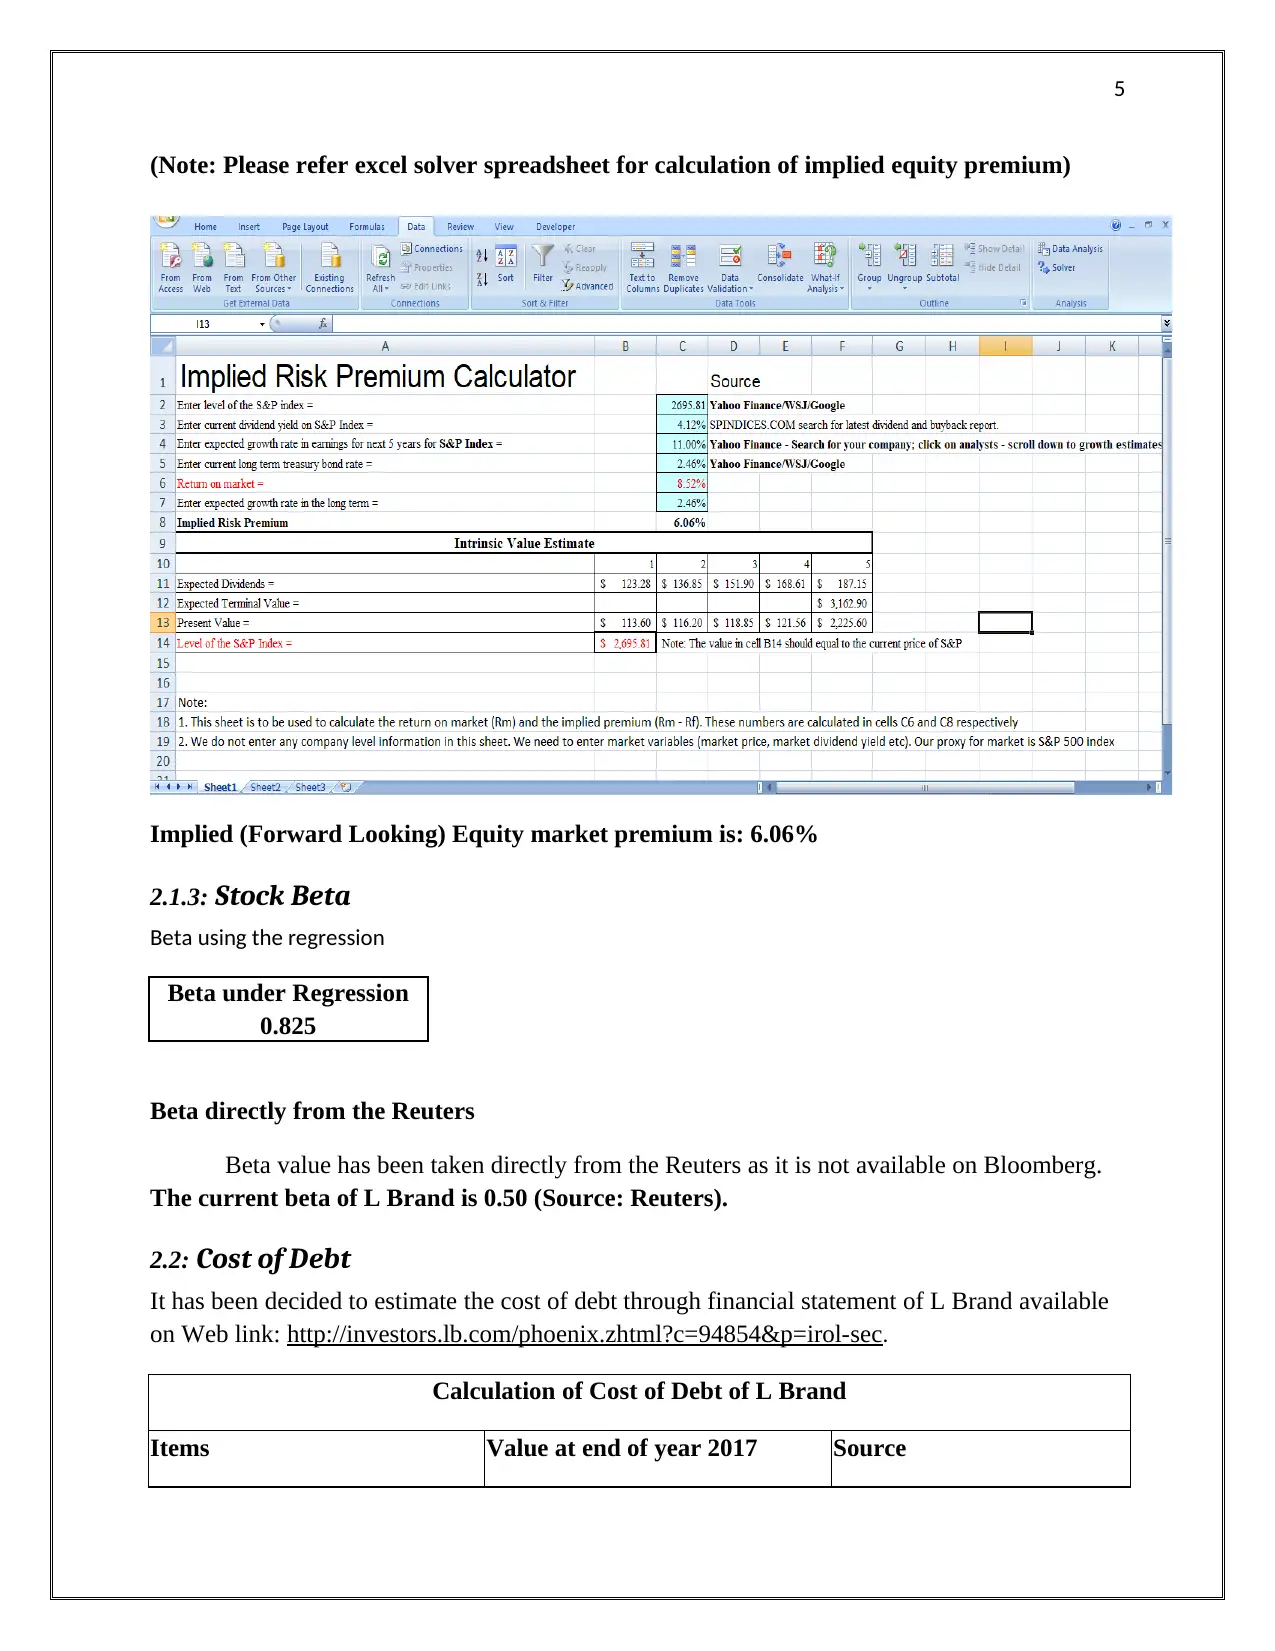
(Note: Please refer excel solver spreadsheet for calculation of implied equity premium)
Implied (Forward Looking) Equity market premium is: 6.06%
2.1.3: Stock Beta
Beta using the regression
Beta under Regression
0.825
Beta directly from the Reuters
Beta value has been taken directly from the Reuters as it is not available on Bloomberg.
The current beta of L Brand is 0.50 (Source: Reuters).
2.2: Cost of Debt
It has been decided to estimate the cost of debt through financial statement of L Brand available
on Web link: http://investors.lb.com/phoenix.zhtml?c=94854&p=irol-sec.
Calculation of Cost of Debt of L Brand
Items Value at end of year 2017 Source
6
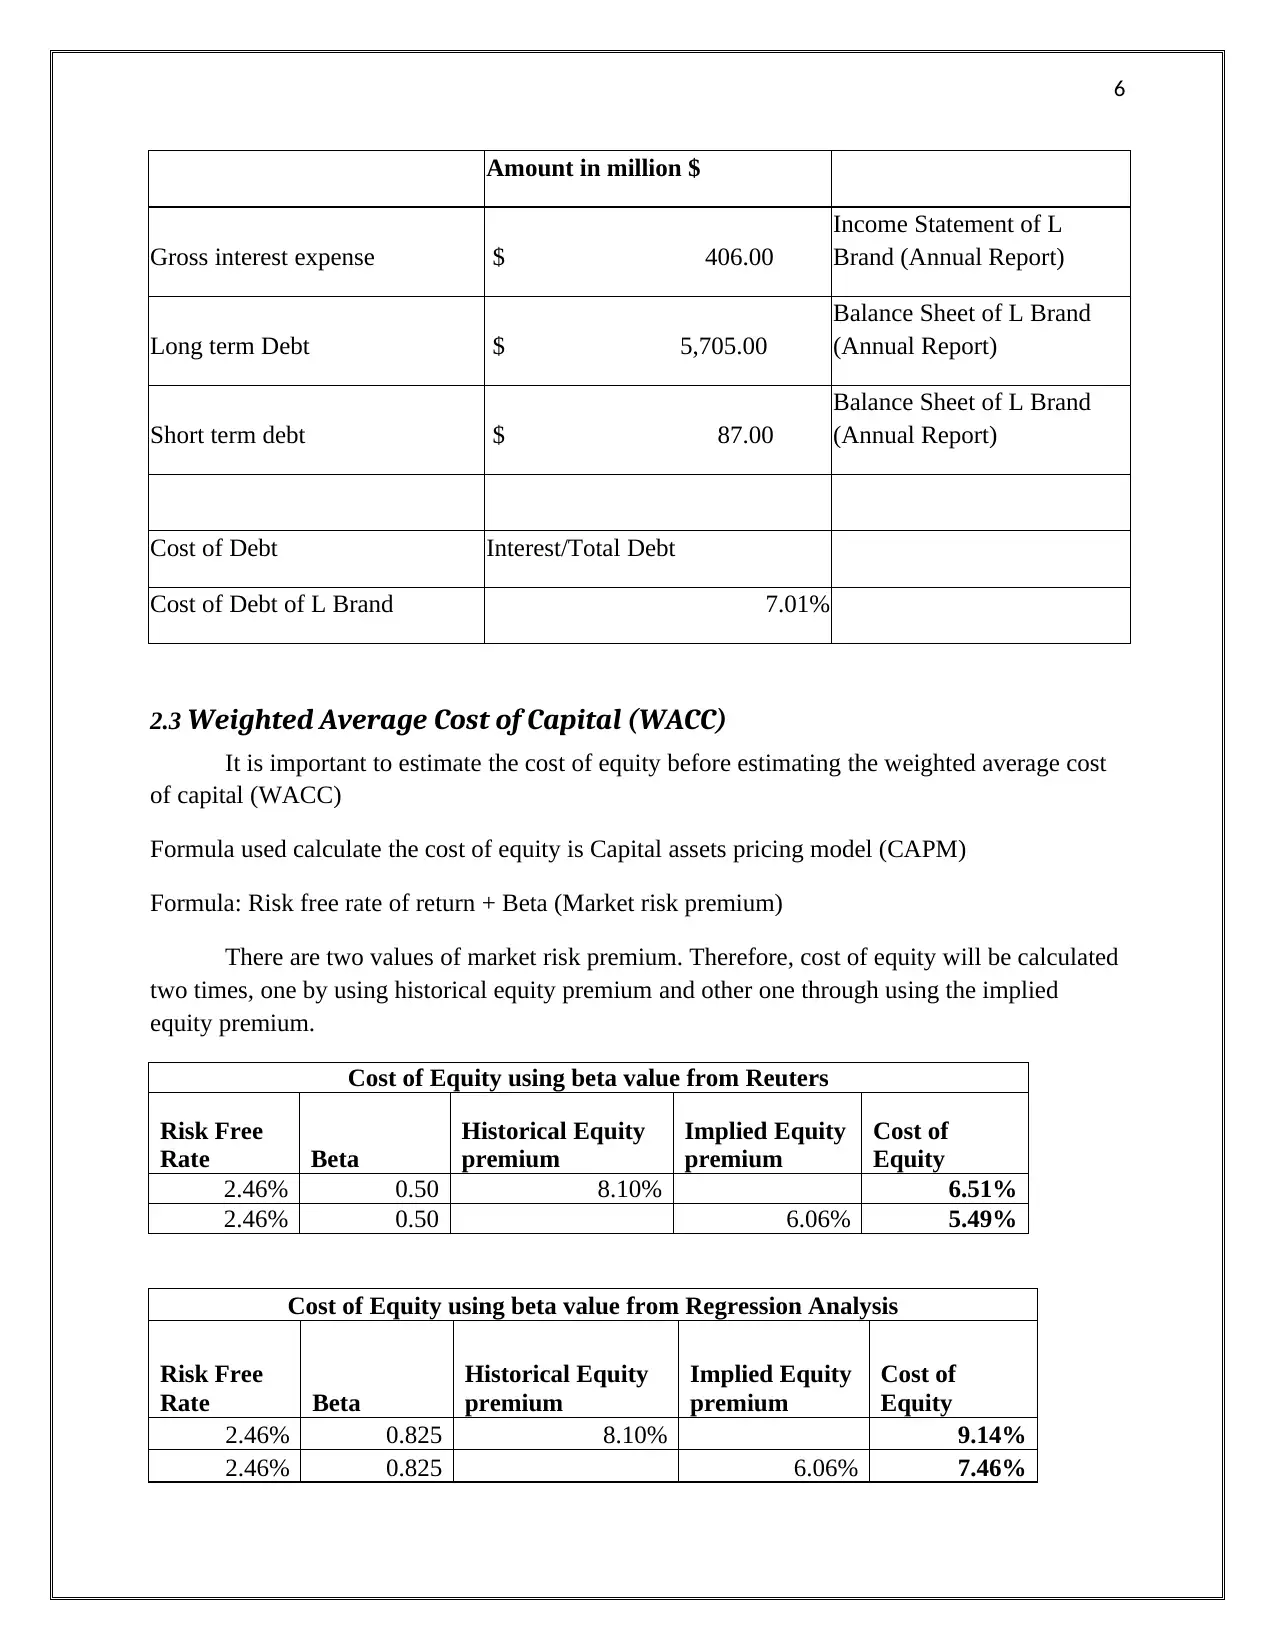
Amount in million $
Gross interest expense $ 406.00
Income Statement of L
Brand (Annual Report)
Long term Debt $ 5,705.00
Balance Sheet of L Brand
(Annual Report)
Short term debt $ 87.00
Balance Sheet of L Brand
(Annual Report)
Cost of Debt Interest/Total Debt
Cost of Debt of L Brand 7.01%
2.3 Weighted Average Cost of Capital (WACC)
It is important to estimate the cost of equity before estimating the weighted average cost
of capital (WACC)
Formula used calculate the cost of equity is Capital assets pricing model (CAPM)
Formula: Risk free rate of return + Beta (Market risk premium)
There are two values of market risk premium. Therefore, cost of equity will be calculated
two times, one by using historical equity premium and other one through using the implied
equity premium.
Cost of Equity using beta value from Reuters
Risk Free
Rate Beta
Historical Equity
premium
Implied Equity
premium
Cost of
Equity
2.46% 0.50 8.10% 6.51%
2.46% 0.50 6.06% 5.49%
Cost of Equity using beta value from Regression Analysis
Risk Free
Rate Beta
Historical Equity
premium
Implied Equity
premium
Cost of
Equity
2.46% 0.825 8.10% 9.14%
2.46% 0.825 6.06% 7.46%
⊘ This is a preview!⊘
Do you want full access?
Subscribe today to unlock all pages.
Trusted by 1+ million students worldwide
7
As all the values for calculating the cost of equity and cost of debt has been on January 2,
2018, therefore, it has been decided to take value of debt and value of equity as on starting of
January, 2018. Financial data in latest annual report of L Brand has been considered as it shows
data as on February 3, 2018. For estimating the value of debt it has been decided to use book
value of long term debt and short term debt. To estimate the value of equity market price of as on
January 2, 2018 has been multiplied by number of shares issued by L Brand.
Paraphrase This Document
Need a fresh take? Get an instant paraphrase of this document with our AI Paraphraser
8
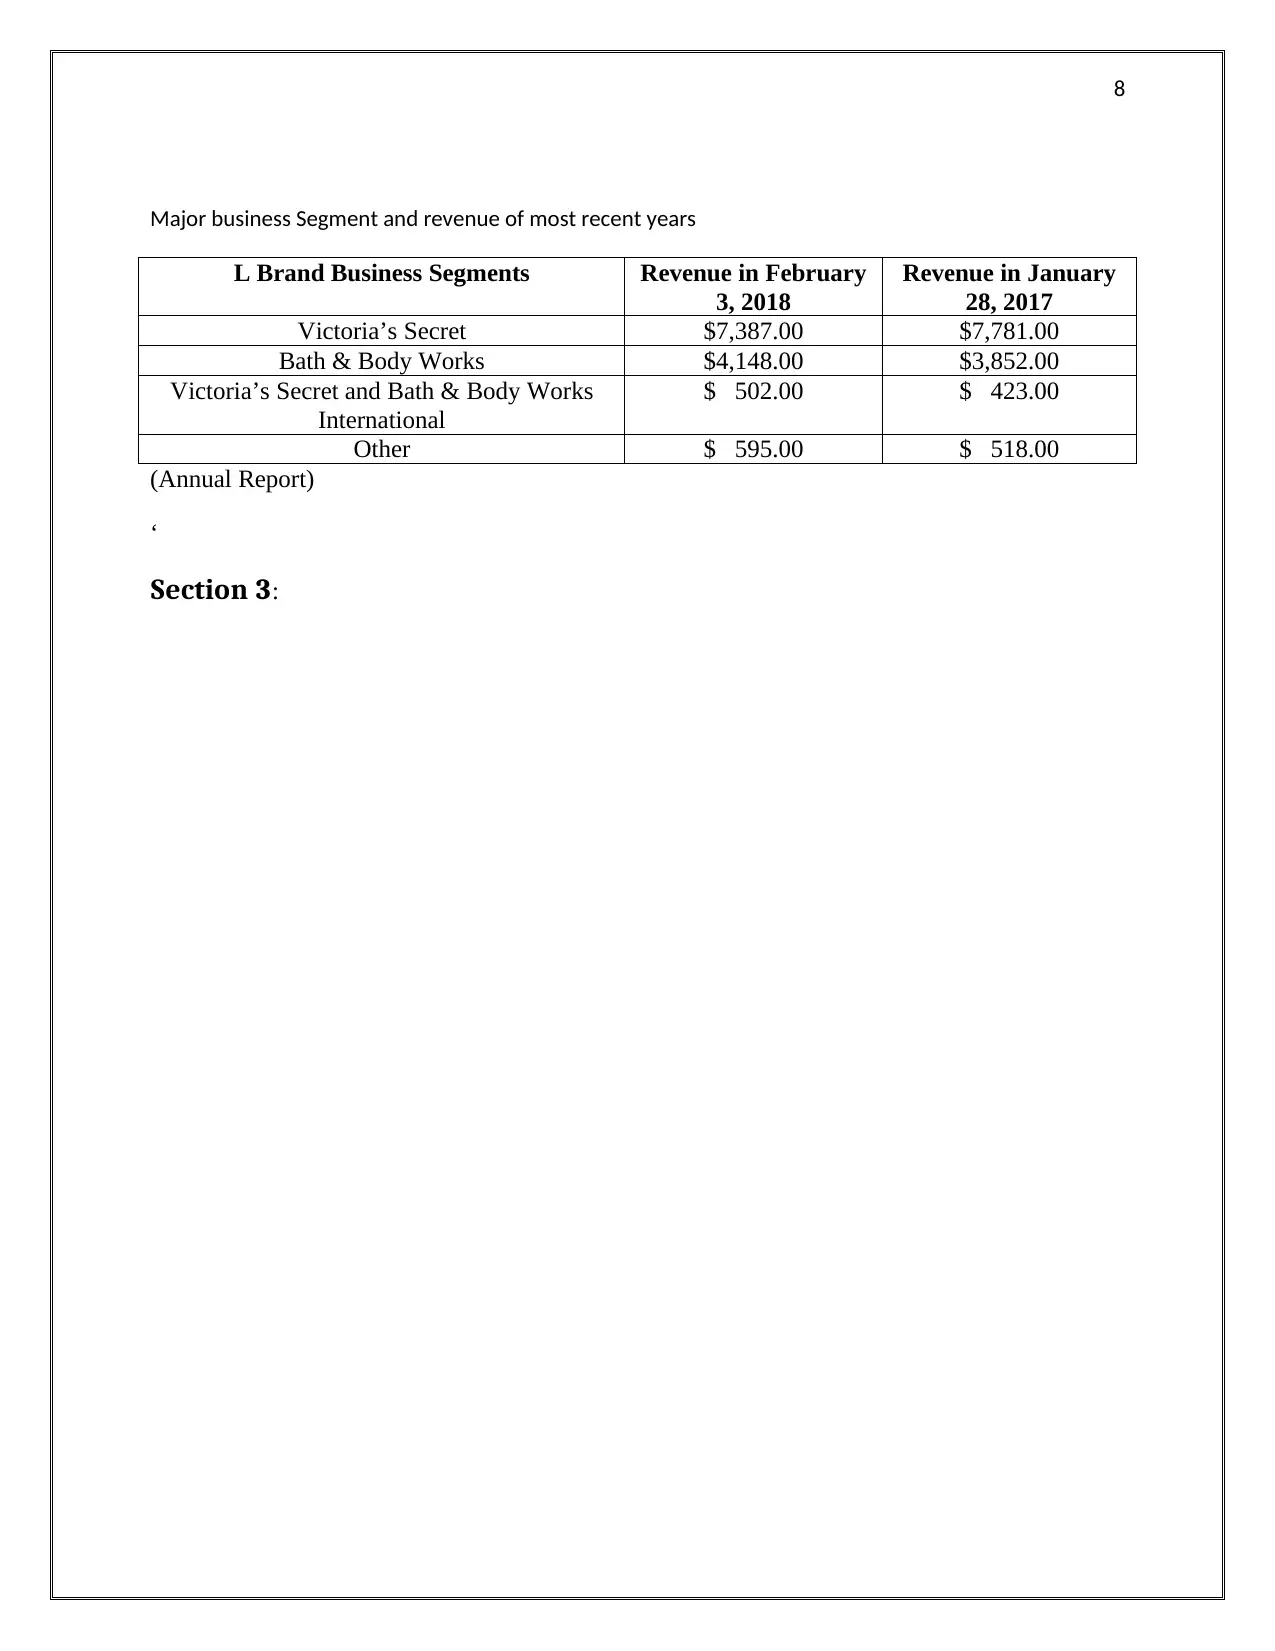
Major business Segment and revenue of most recent years
L Brand Business Segments Revenue in February
3, 2018
Revenue in January
28, 2017
Victoria’s Secret $7,387.00 $7,781.00
Bath & Body Works $4,148.00 $3,852.00
Victoria’s Secret and Bath & Body Works
International
$ 502.00 $ 423.00
Other $ 595.00 $ 518.00
(Annual Report)
‘
Section 3:
9
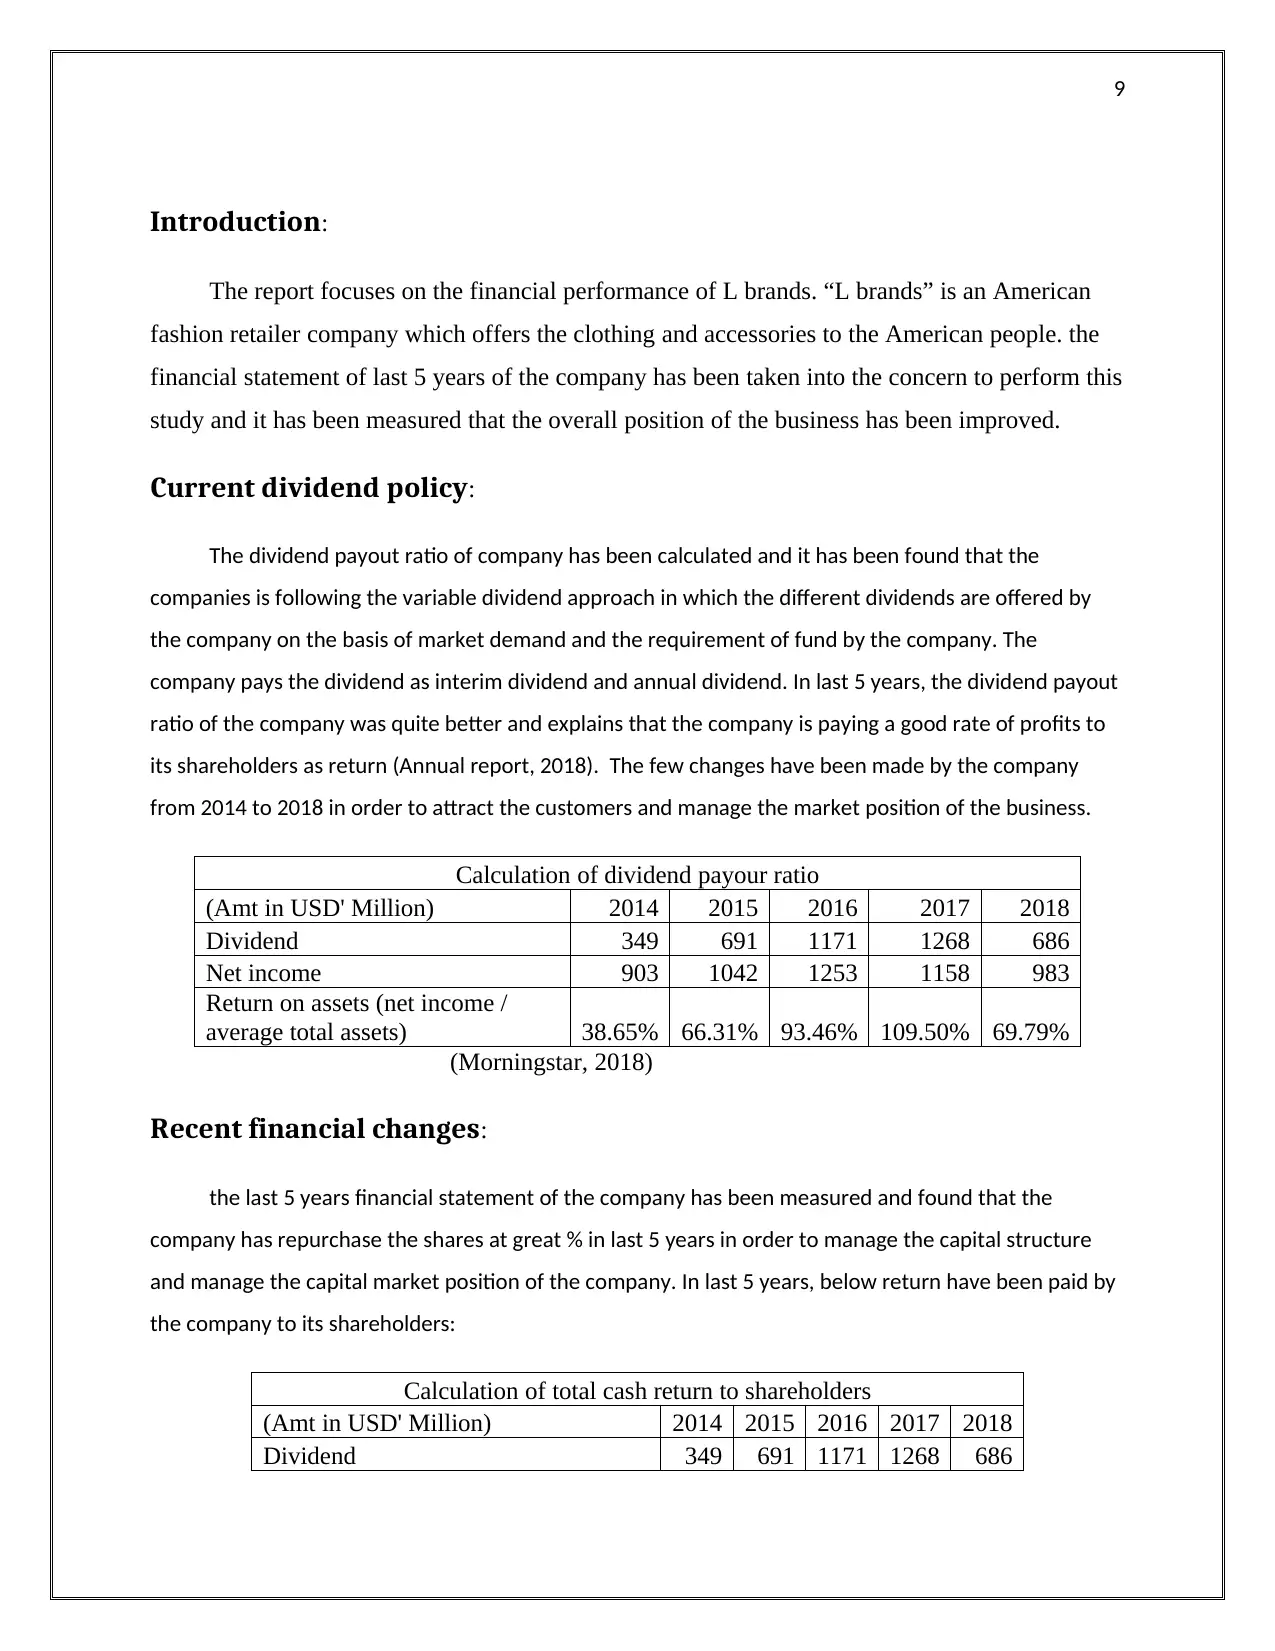
Introduction:
The report focuses on the financial performance of L brands. “L brands” is an American
fashion retailer company which offers the clothing and accessories to the American people. the
financial statement of last 5 years of the company has been taken into the concern to perform this
study and it has been measured that the overall position of the business has been improved.
Current dividend policy:
The dividend payout ratio of company has been calculated and it has been found that the
companies is following the variable dividend approach in which the different dividends are offered by
the company on the basis of market demand and the requirement of fund by the company. The
company pays the dividend as interim dividend and annual dividend. In last 5 years, the dividend payout
ratio of the company was quite better and explains that the company is paying a good rate of profits to
its shareholders as return (Annual report, 2018). The few changes have been made by the company
from 2014 to 2018 in order to attract the customers and manage the market position of the business.
Calculation of dividend payour ratio
(Amt in USD' Million) 2014 2015 2016 2017 2018
Dividend 349 691 1171 1268 686
Net income 903 1042 1253 1158 983
Return on assets (net income /
average total assets) 38.65% 66.31% 93.46% 109.50% 69.79%
(Morningstar, 2018)
Recent financial changes:
the last 5 years financial statement of the company has been measured and found that the
company has repurchase the shares at great % in last 5 years in order to manage the capital structure
and manage the capital market position of the company. In last 5 years, below return have been paid by
the company to its shareholders:
Calculation of total cash return to shareholders
(Amt in USD' Million) 2014 2015 2016 2017 2018
Dividend 349 691 1171 1268 686
⊘ This is a preview!⊘
Do you want full access?
Subscribe today to unlock all pages.
Trusted by 1+ million students worldwide
10
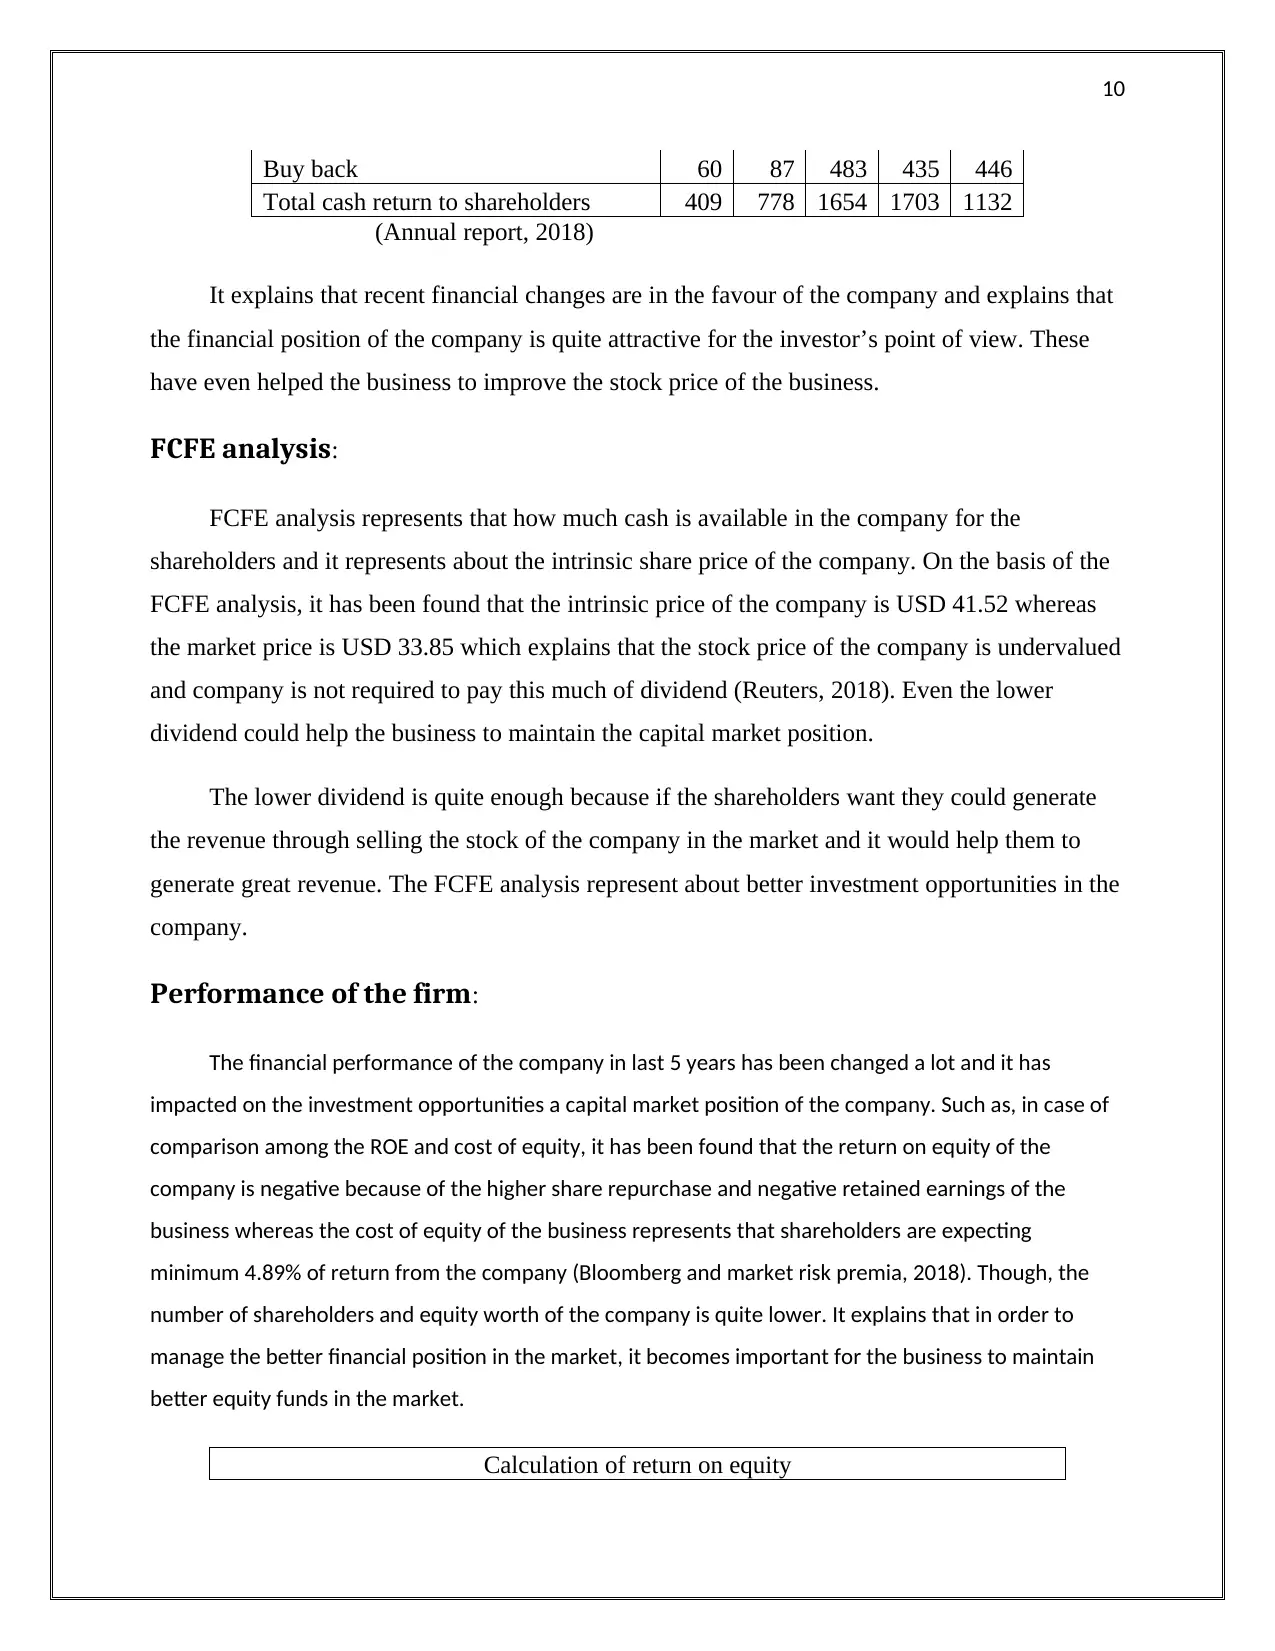
Buy back 60 87 483 435 446
Total cash return to shareholders 409 778 1654 1703 1132
(Annual report, 2018)
It explains that recent financial changes are in the favour of the company and explains that
the financial position of the company is quite attractive for the investor’s point of view. These
have even helped the business to improve the stock price of the business.
FCFE analysis:
FCFE analysis represents that how much cash is available in the company for the
shareholders and it represents about the intrinsic share price of the company. On the basis of the
FCFE analysis, it has been found that the intrinsic price of the company is USD 41.52 whereas
the market price is USD 33.85 which explains that the stock price of the company is undervalued
and company is not required to pay this much of dividend (Reuters, 2018). Even the lower
dividend could help the business to maintain the capital market position.
The lower dividend is quite enough because if the shareholders want they could generate
the revenue through selling the stock of the company in the market and it would help them to
generate great revenue. The FCFE analysis represent about better investment opportunities in the
company.
Performance of the firm:
The financial performance of the company in last 5 years has been changed a lot and it has
impacted on the investment opportunities a capital market position of the company. Such as, in case of
comparison among the ROE and cost of equity, it has been found that the return on equity of the
company is negative because of the higher share repurchase and negative retained earnings of the
business whereas the cost of equity of the business represents that shareholders are expecting
minimum 4.89% of return from the company (Bloomberg and market risk premia, 2018). Though, the
number of shareholders and equity worth of the company is quite lower. It explains that in order to
manage the better financial position in the market, it becomes important for the business to maintain
better equity funds in the market.
Calculation of return on equity
Paraphrase This Document
Need a fresh take? Get an instant paraphrase of this document with our AI Paraphraser
11
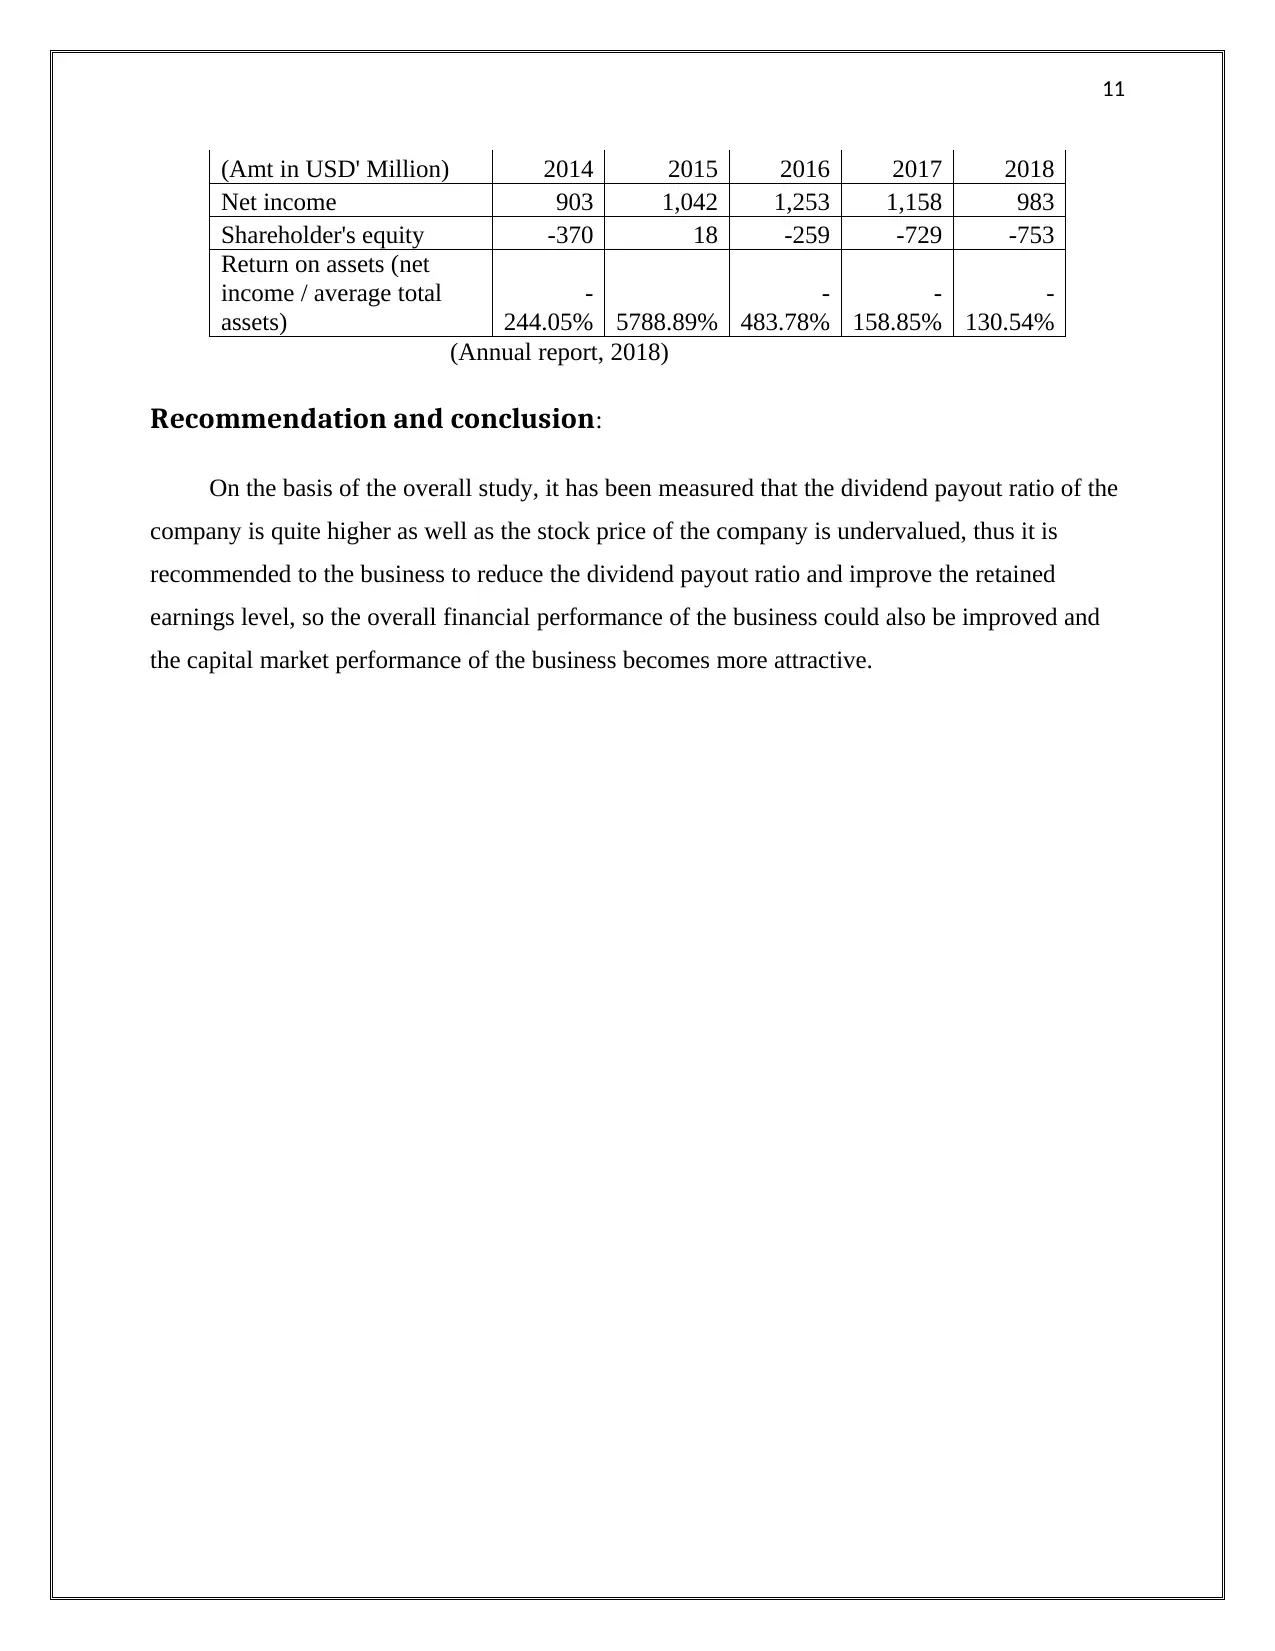
(Amt in USD' Million) 2014 2015 2016 2017 2018
Net income 903 1,042 1,253 1,158 983
Shareholder's equity -370 18 -259 -729 -753
Return on assets (net
income / average total
assets)
-
244.05% 5788.89%
-
483.78%
-
158.85%
-
130.54%
(Annual report, 2018)
Recommendation and conclusion:
On the basis of the overall study, it has been measured that the dividend payout ratio of the
company is quite higher as well as the stock price of the company is undervalued, thus it is
recommended to the business to reduce the dividend payout ratio and improve the retained
earnings level, so the overall financial performance of the business could also be improved and
the capital market performance of the business becomes more attractive.
12
References
Annual Report. L Brand. Web. 2018. 27 October 2018. < http://investors.lb.com/phoenix.zhtml?
c=94854&p=irol-sec >
Reuters. L Brands Inc (LB.N). 2018. Web. 27 October 2018. <
https://www.reuters.com/finance/stocks/overview/LB.N >.
Spindices. S&P Dow Jones Indices. Web. 27 October 2018. <https://asia.spindices.com/search/?
query=dividend+and+buybacks&Search=Go&sortType=Date&resultsPerPage=25&ContentType
=Announcement >.
U.S. Department of the Treasury. Resource Center: Daily Treasury Yield Curve Rates, 2018.
Web. 27 October 2018. <https://www.treasury.gov/resource-center/data-chart-center/interest-
rates/Pages/TextView.aspx?data=yieldYear&year=2017>.
Yahoo Finance. L Brands, Inc. (LB). Analysis, 2018. Web. 27 October 2018. < h
https://finance.yahoo.com/quote/LB/analysis?p=LB >.
Yahoo Finance. S&P 500 (GSPC) Historical Data, 2018. Web. 27 October 2018. <
https://in.finance.yahoo.com/quote/%5EGSPC/history Annual report. “L Brands”.
Bloomberg. “Market rates”. Bloomberg, 2018. Web. 3rd Nov 2018.
<https://www.bloomberg.com/markets/rates>
Morningstar. “L Brands”. Morningstar, 2018. Web. 3rd Nov 2018.
<http://financials.morningstar.com/balance-sheet/bs.html?t=LB®ion=usa&culture=en-US>
Market risk premia. “USA market premium rates”. Market risk premia, 2018. Web. 3rd Nov 2018.
<http://www.market-risk-premia.com/us.html>
Reuters. “L Brands”. Reuters, 2018. Web. 3rd Nov 2018.
<https://www.reuters.com/finance/stocks/overview/LB.N>
?period1=1199125800&period2=1517337000&interval=1d&filter=history&frequency=1d >.
⊘ This is a preview!⊘
Do you want full access?
Subscribe today to unlock all pages.
Trusted by 1+ million students worldwide
1 out of 18
Related Documents


Your All-in-One AI-Powered Toolkit for Academic Success.
+13062052269
info@desklib.com
Available 24*7 on WhatsApp / Email
![[object Object]](/_next/static/media/star-bottom.7253800d.svg)
Unlock your academic potential
Copyright © 2020–2026 A2Z Services. All Rights Reserved. Developed and managed by ZUCOL.