Financial Analysis: Calculating WACC for L Brands Inc. Report
VerifiedAdded on 2023/06/04
|13
|2187
|165
Report
AI Summary
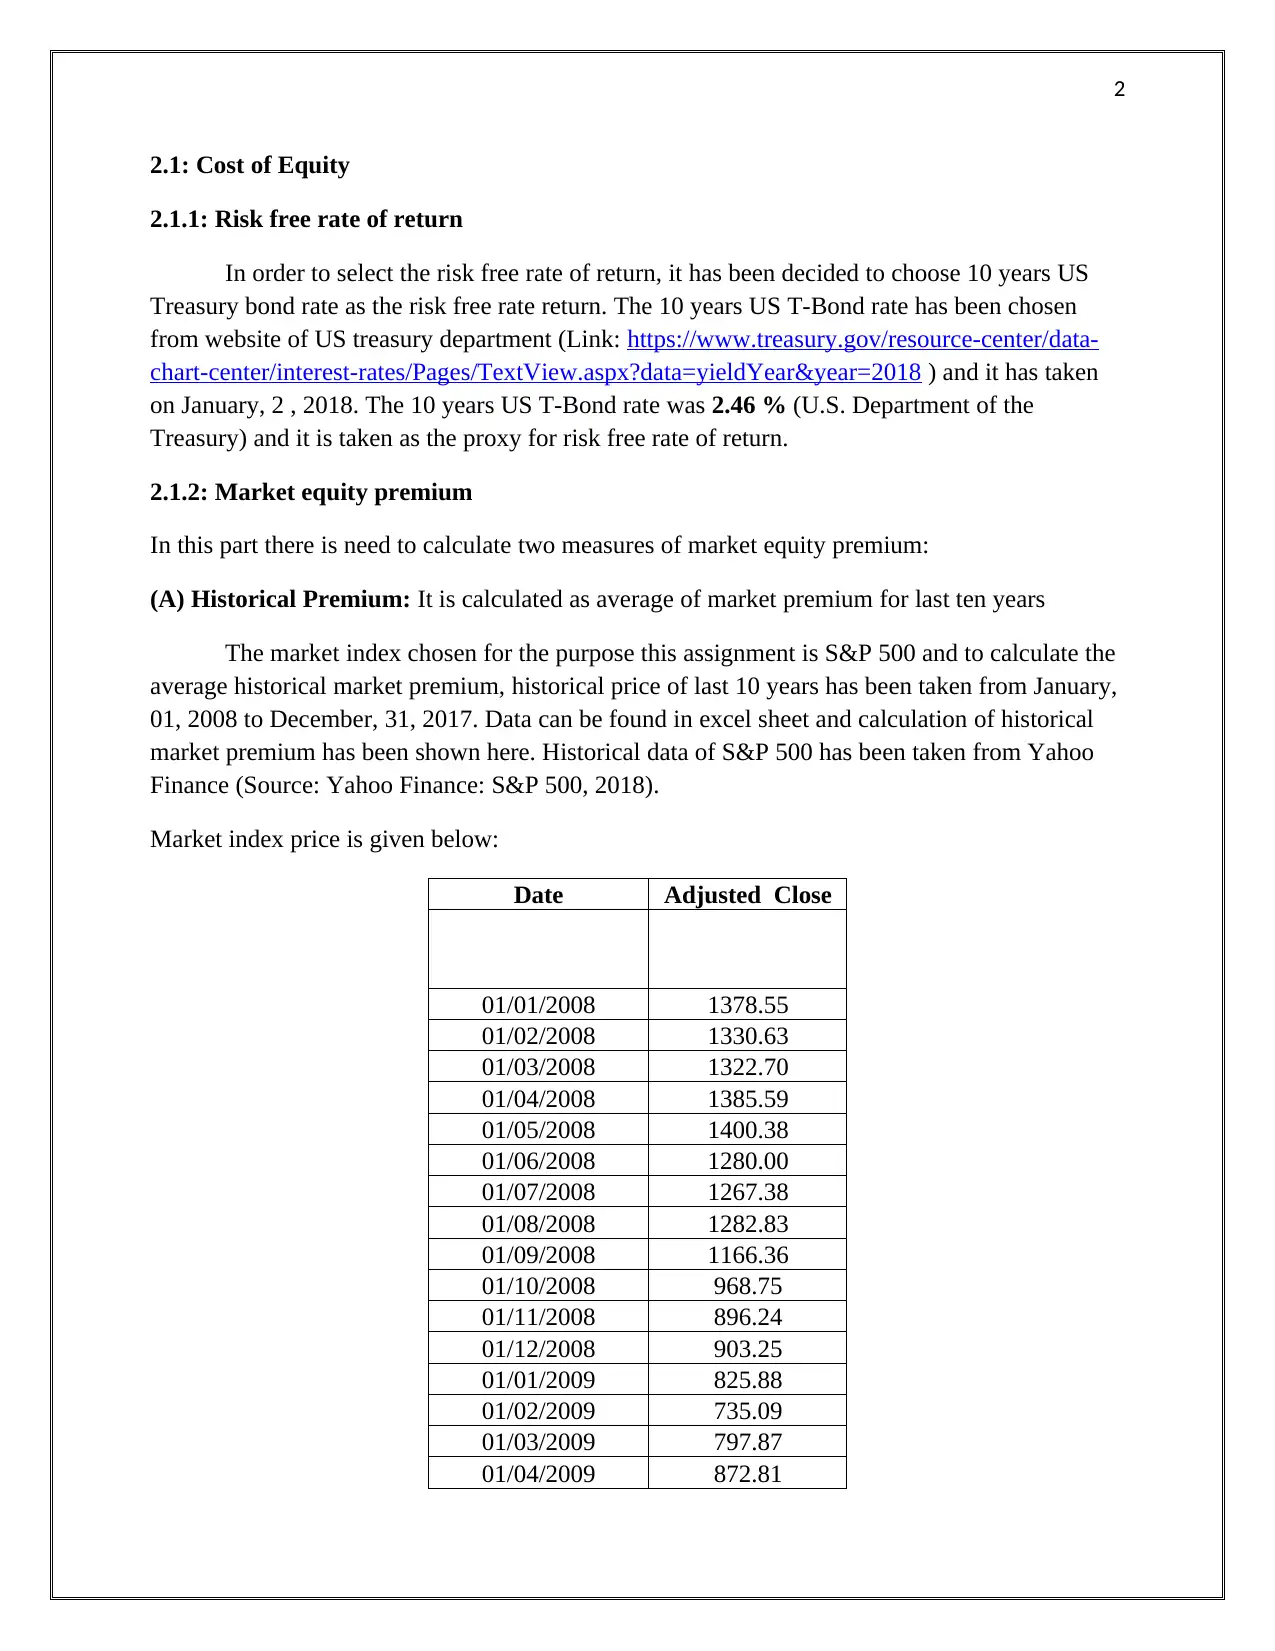
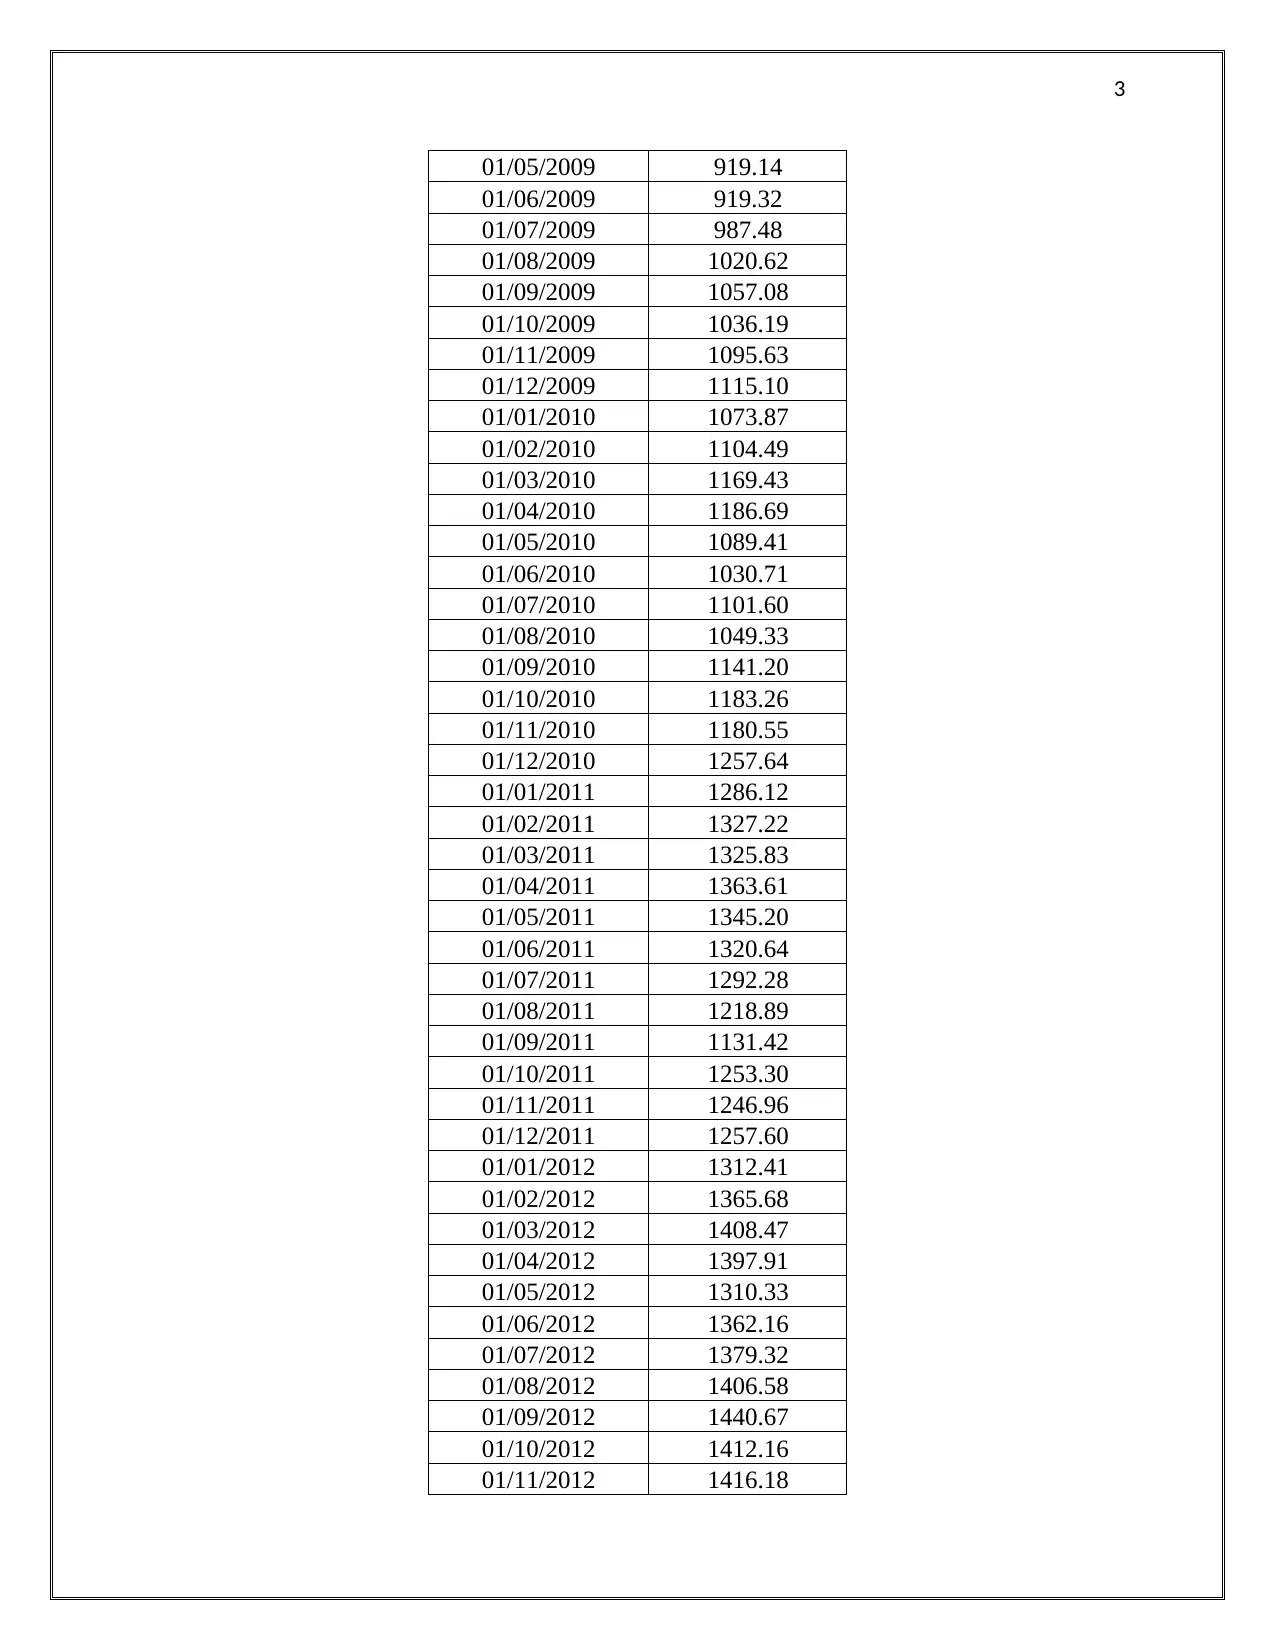
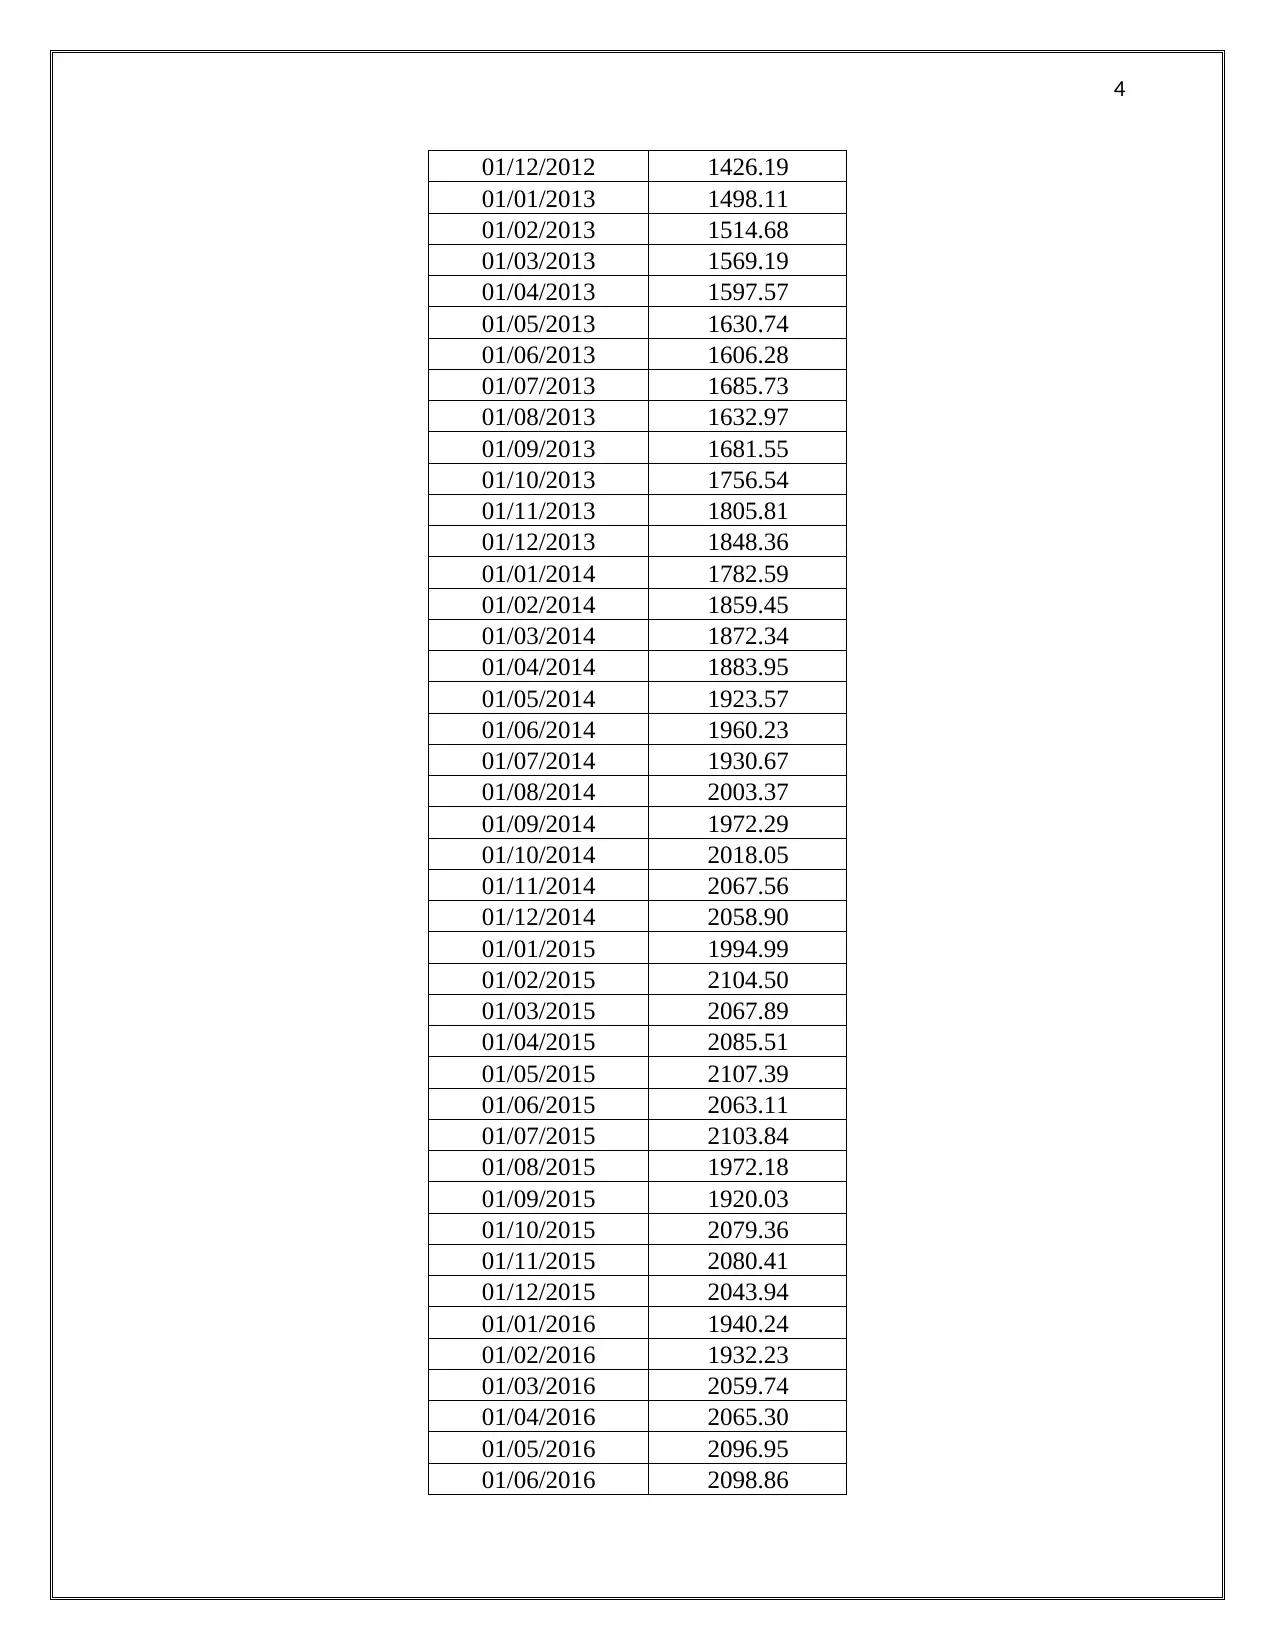
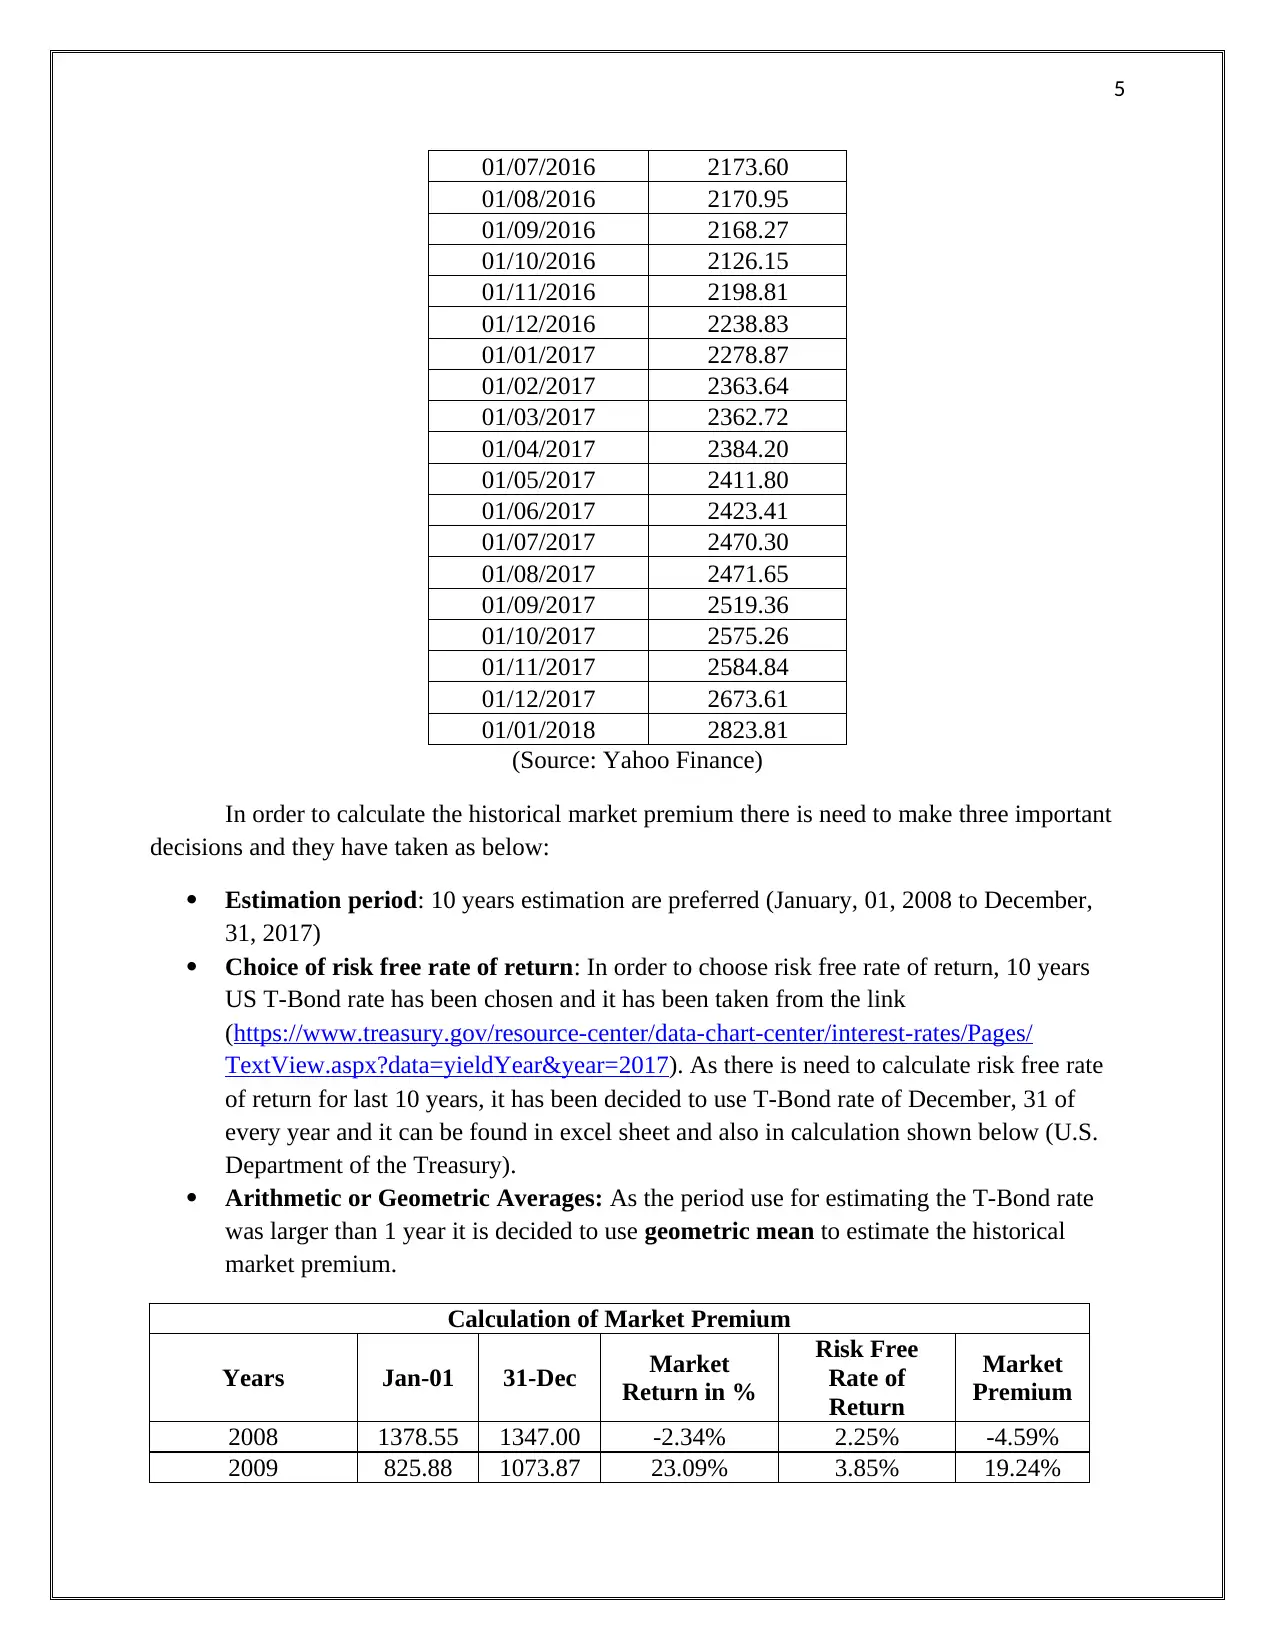
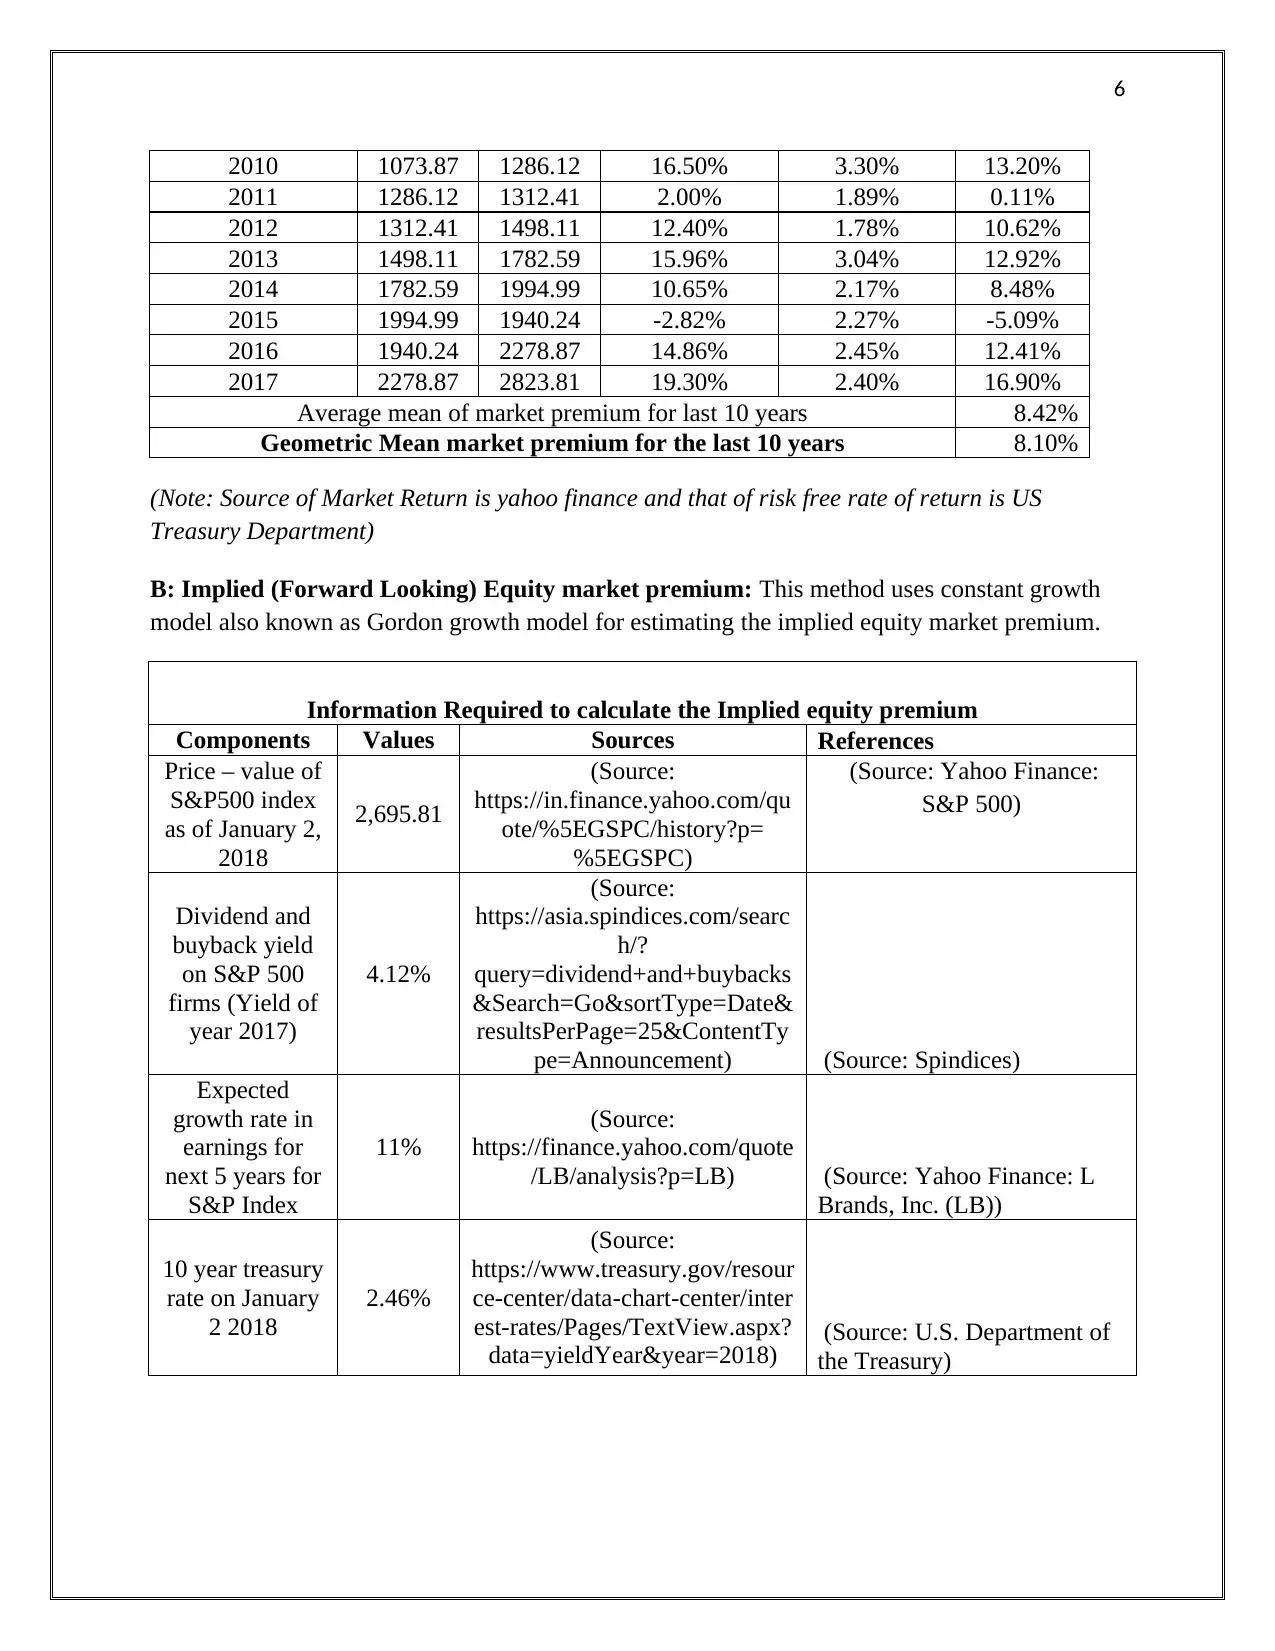
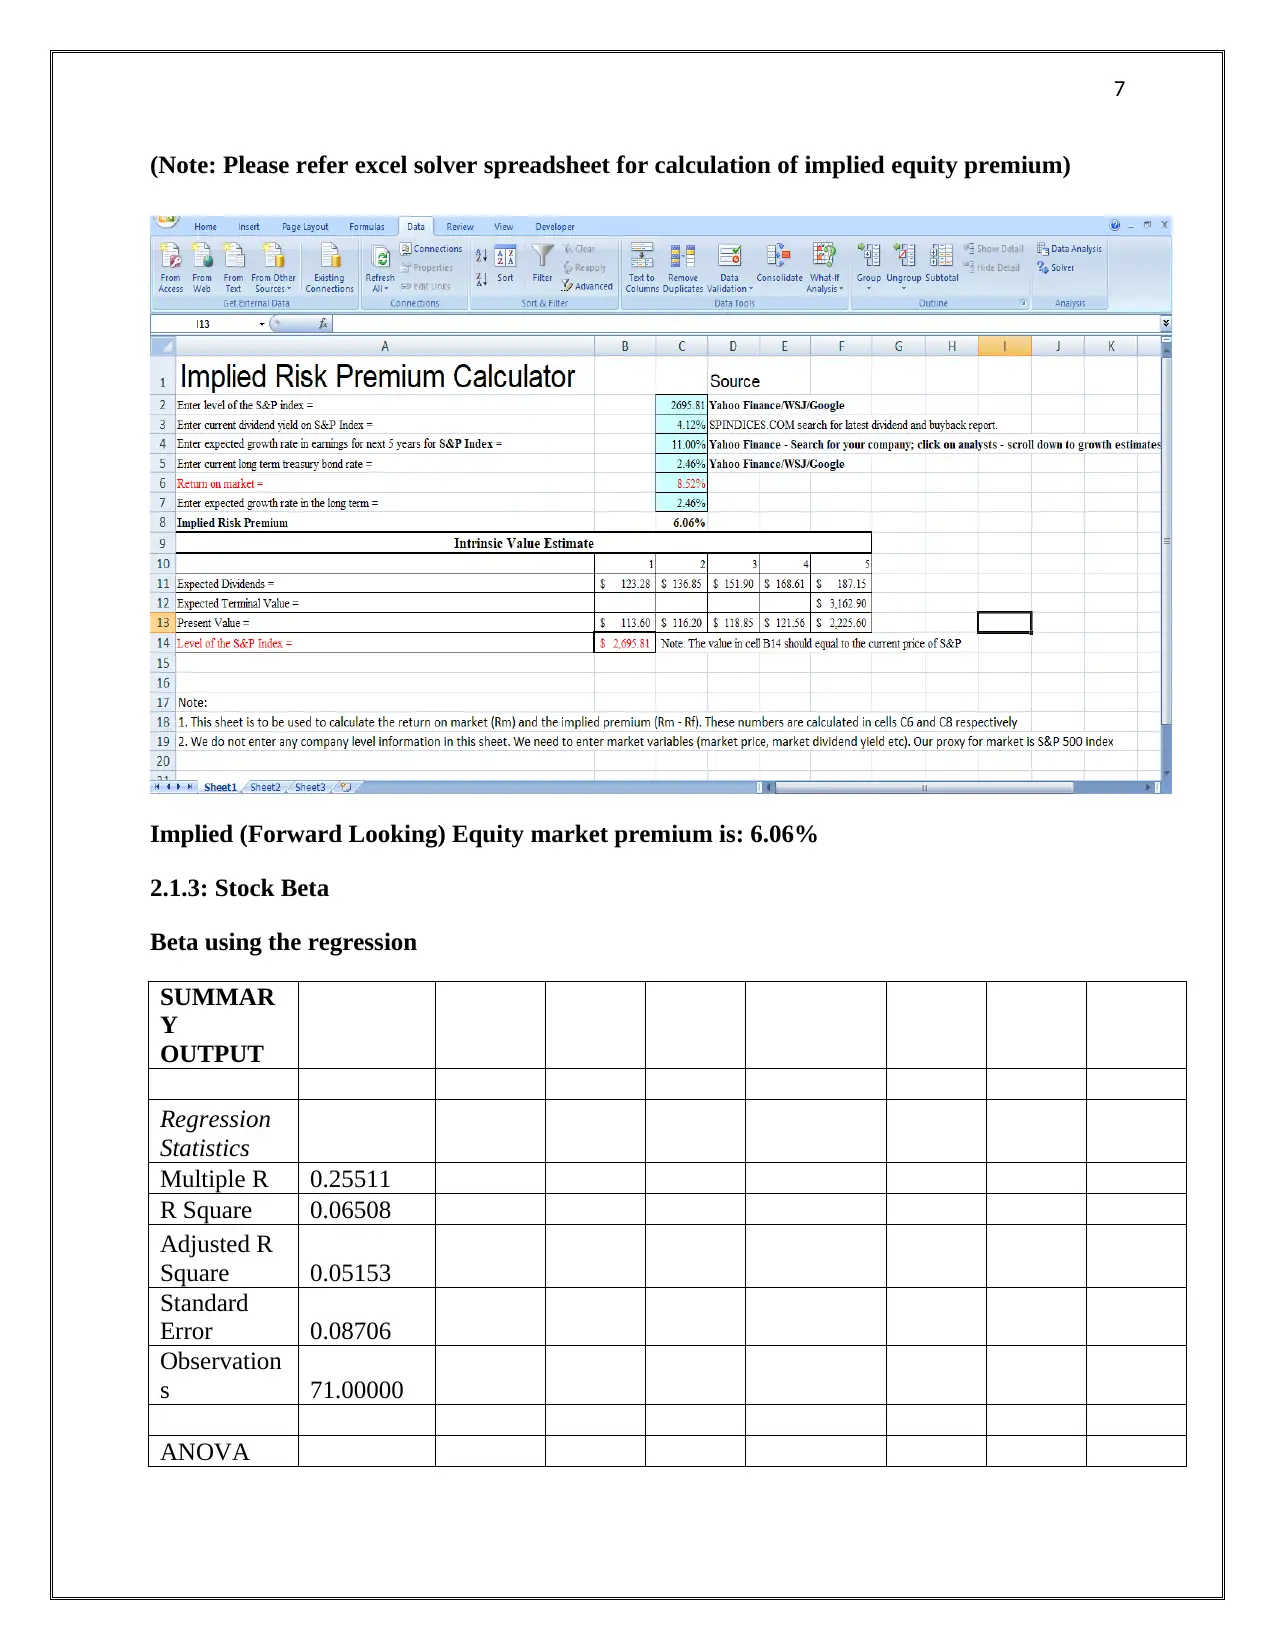
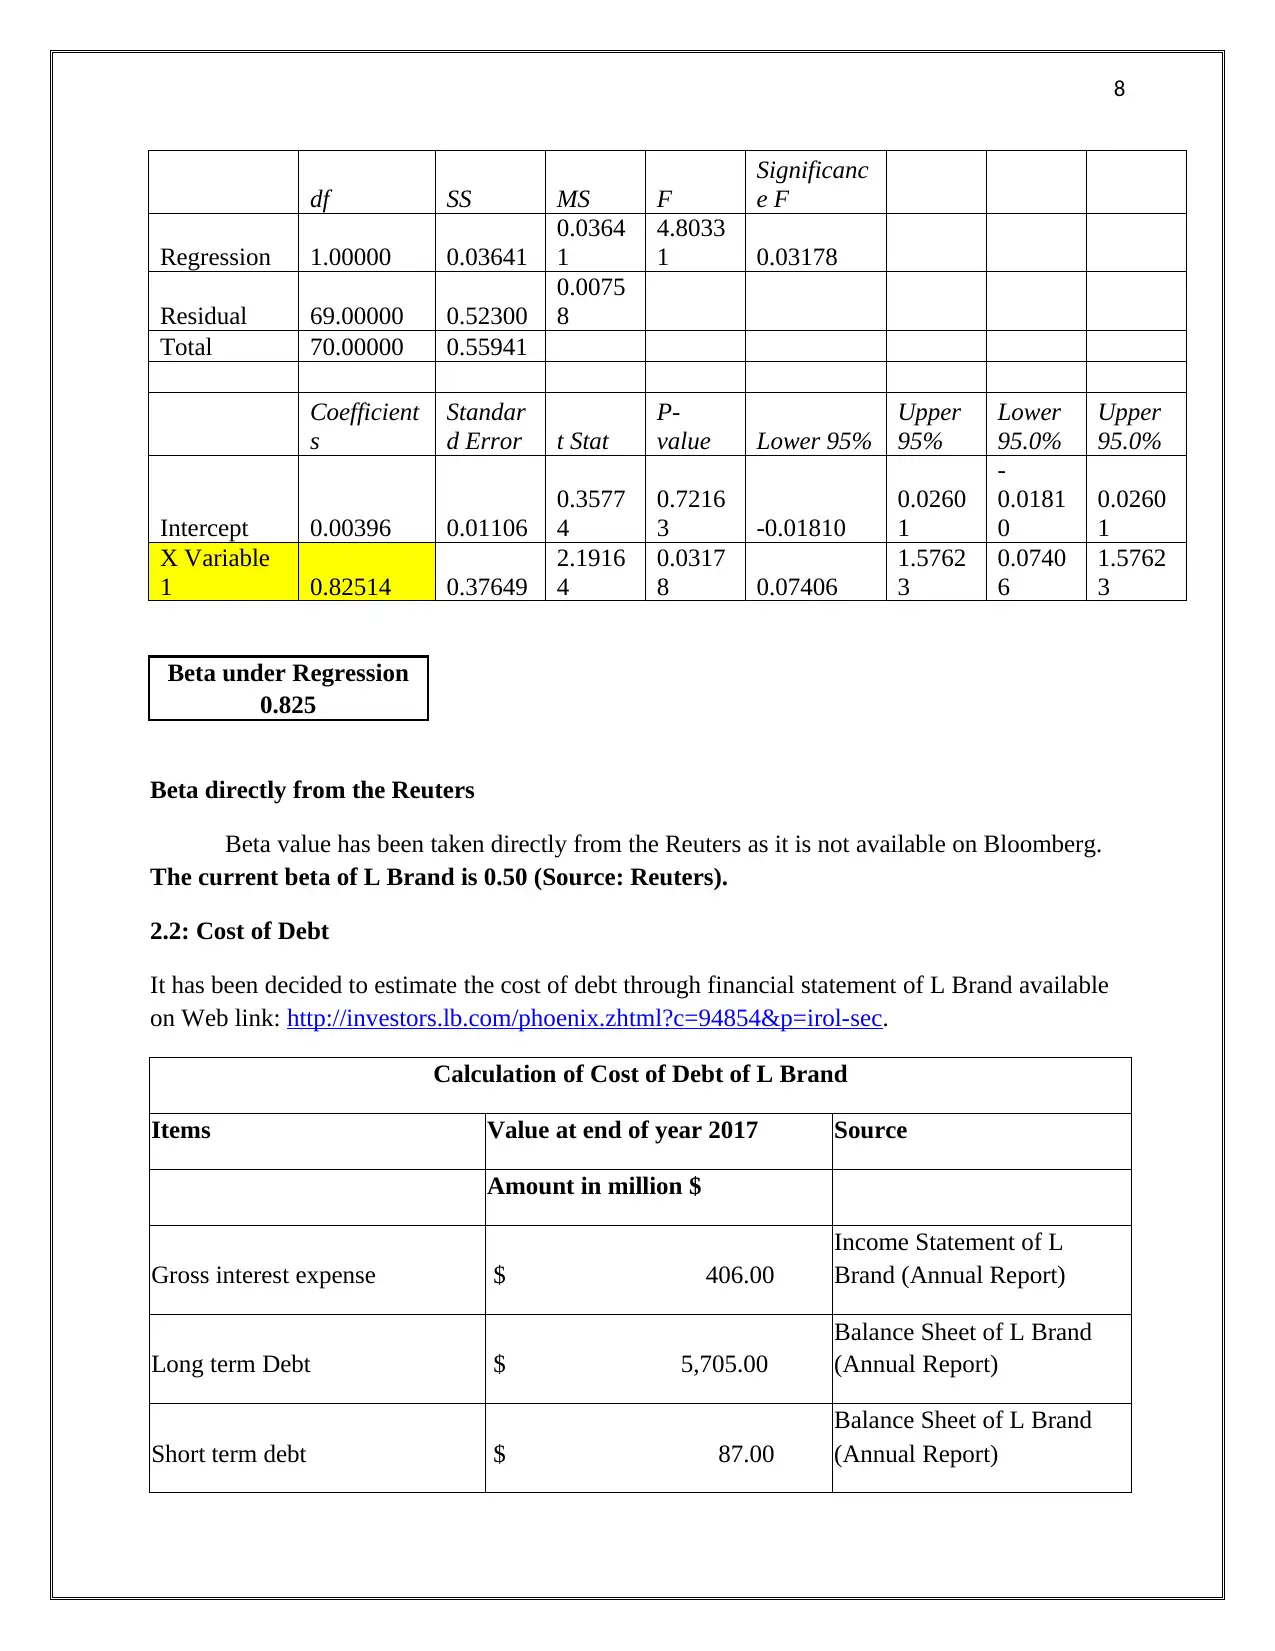
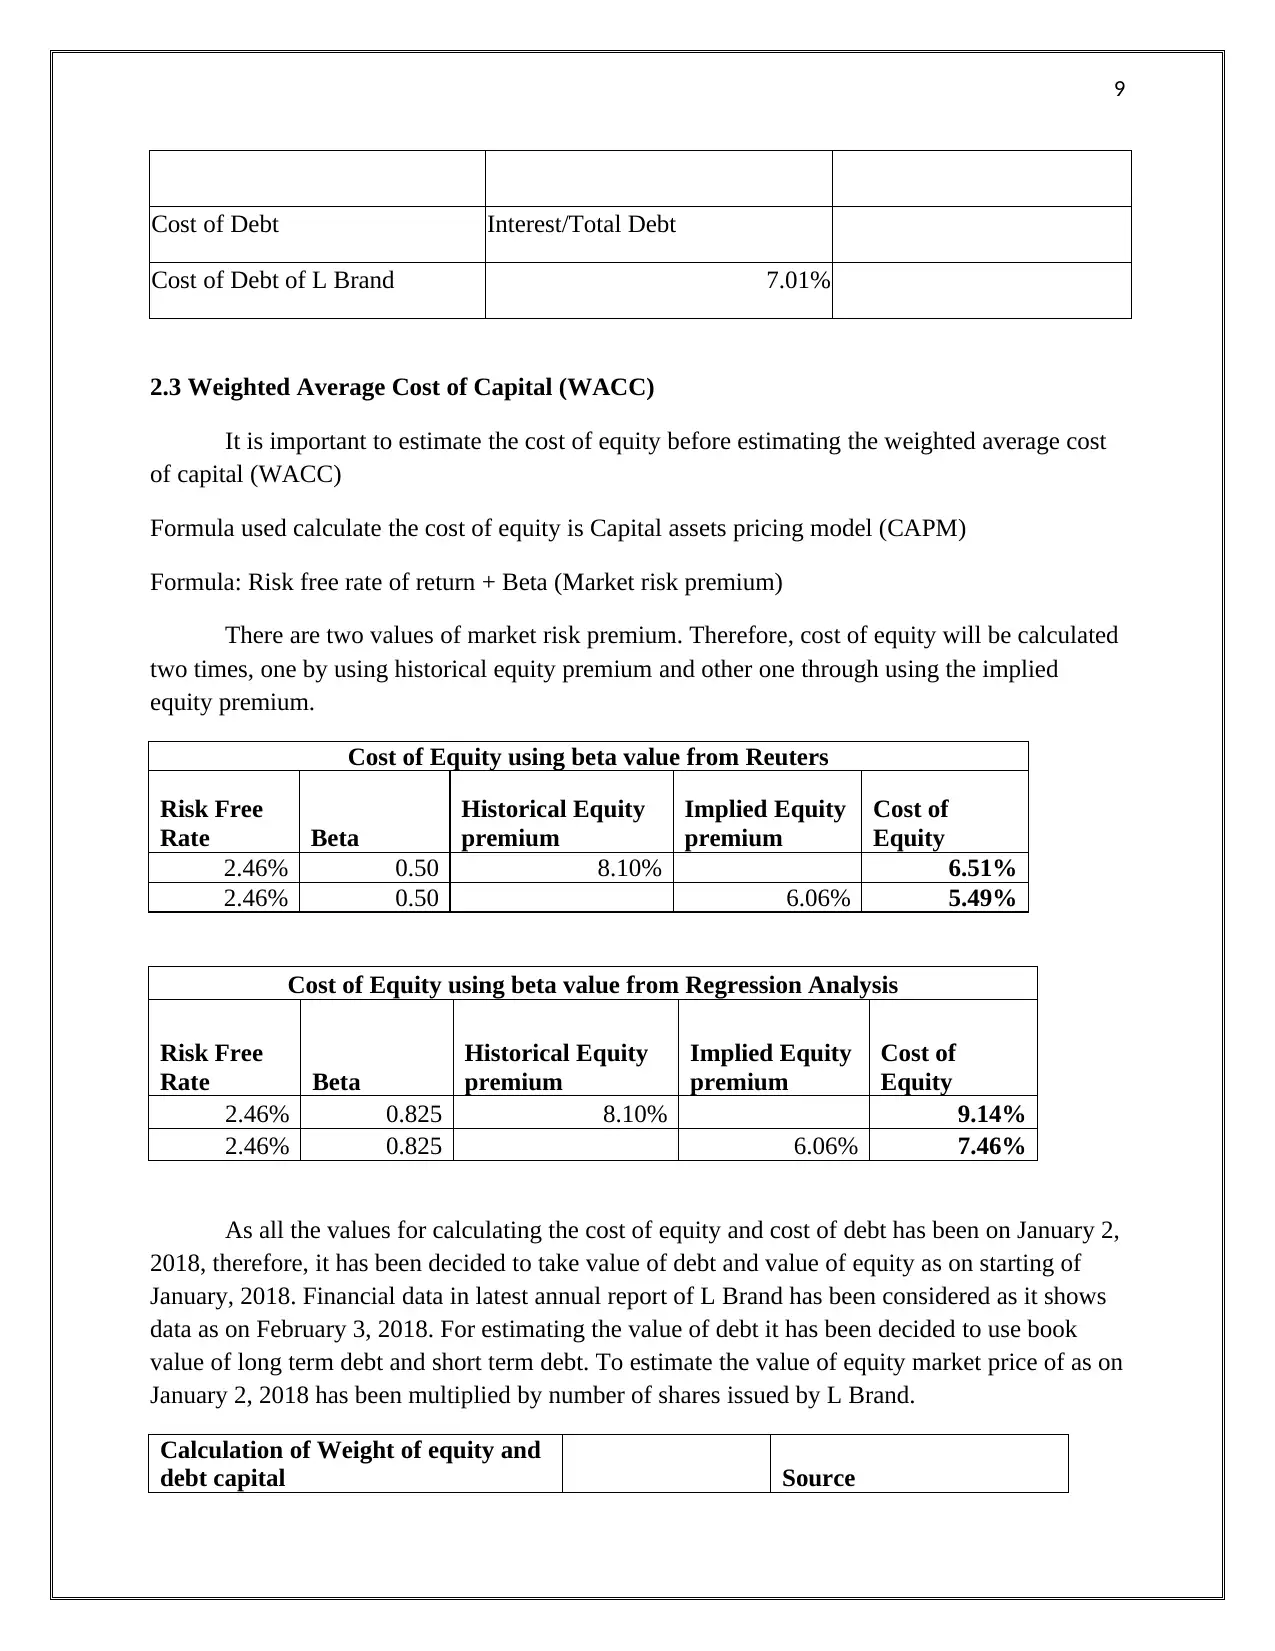
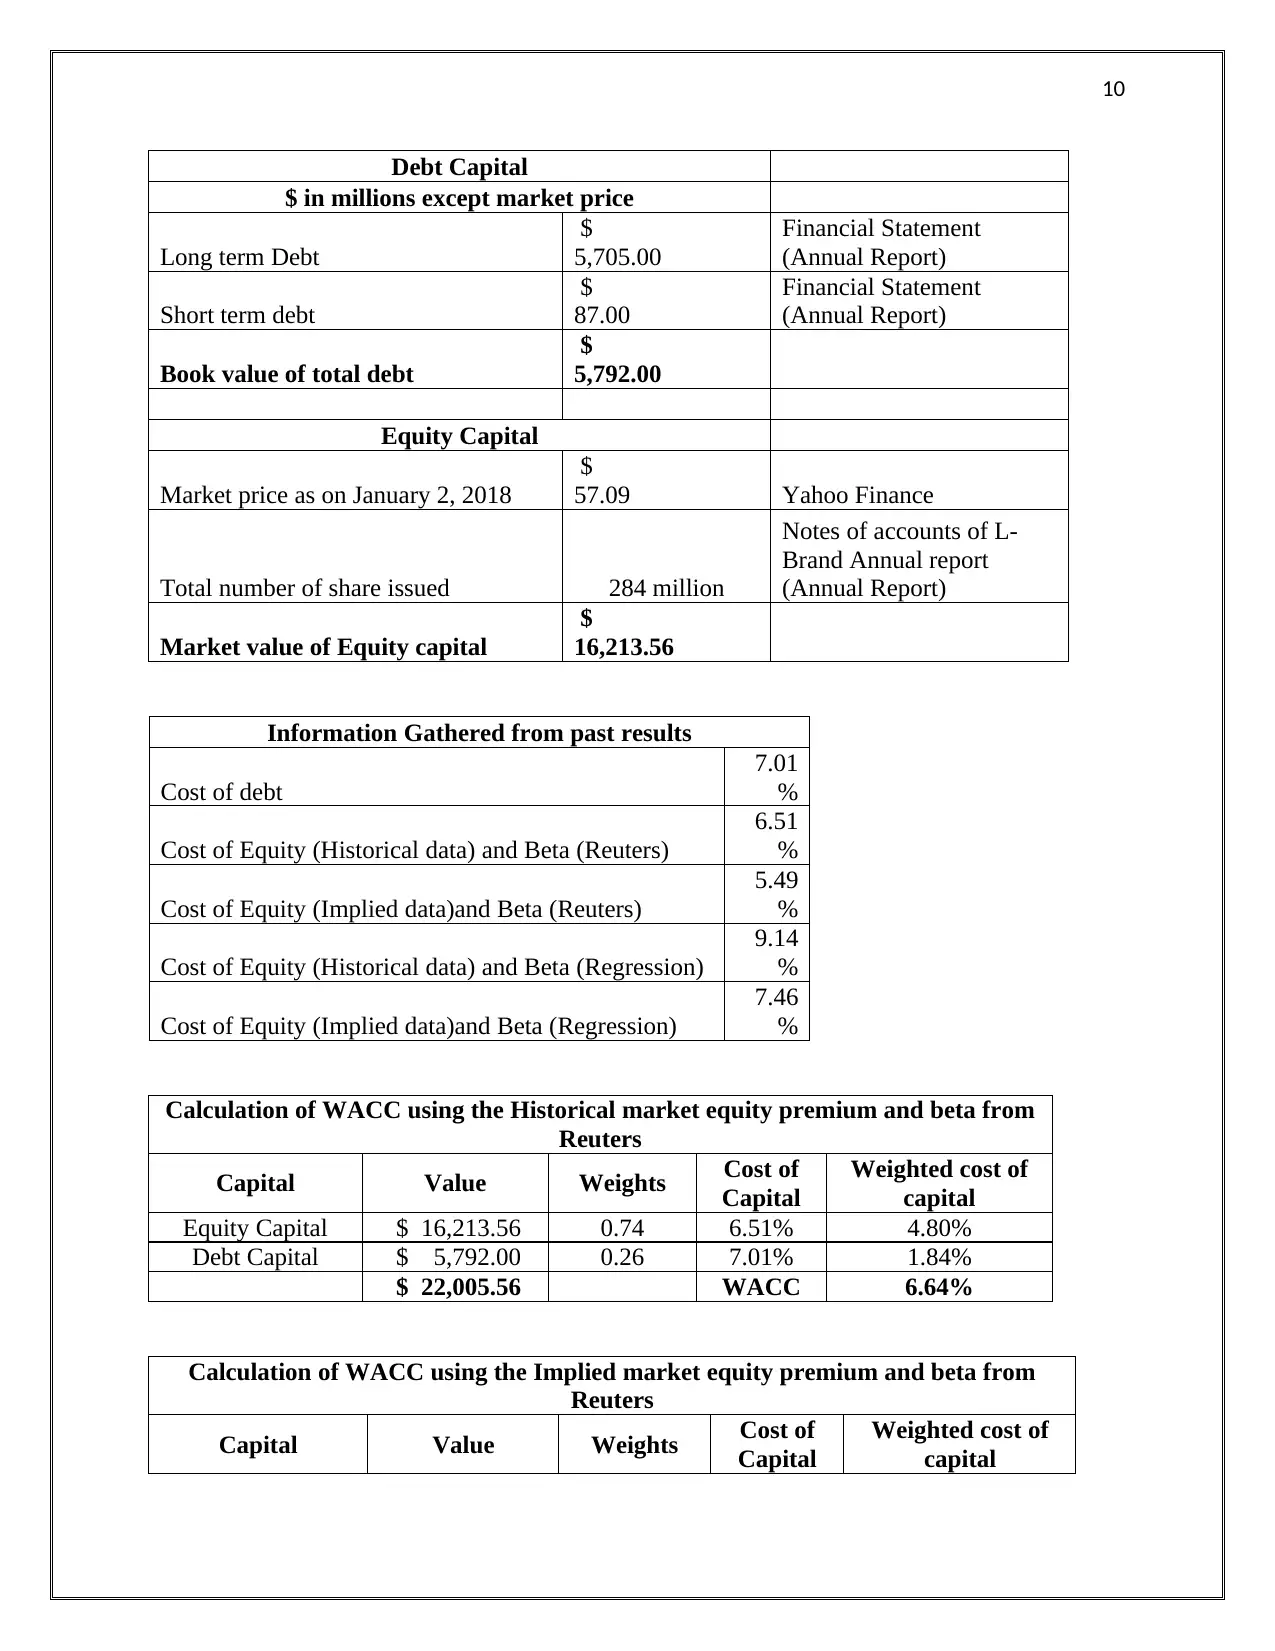
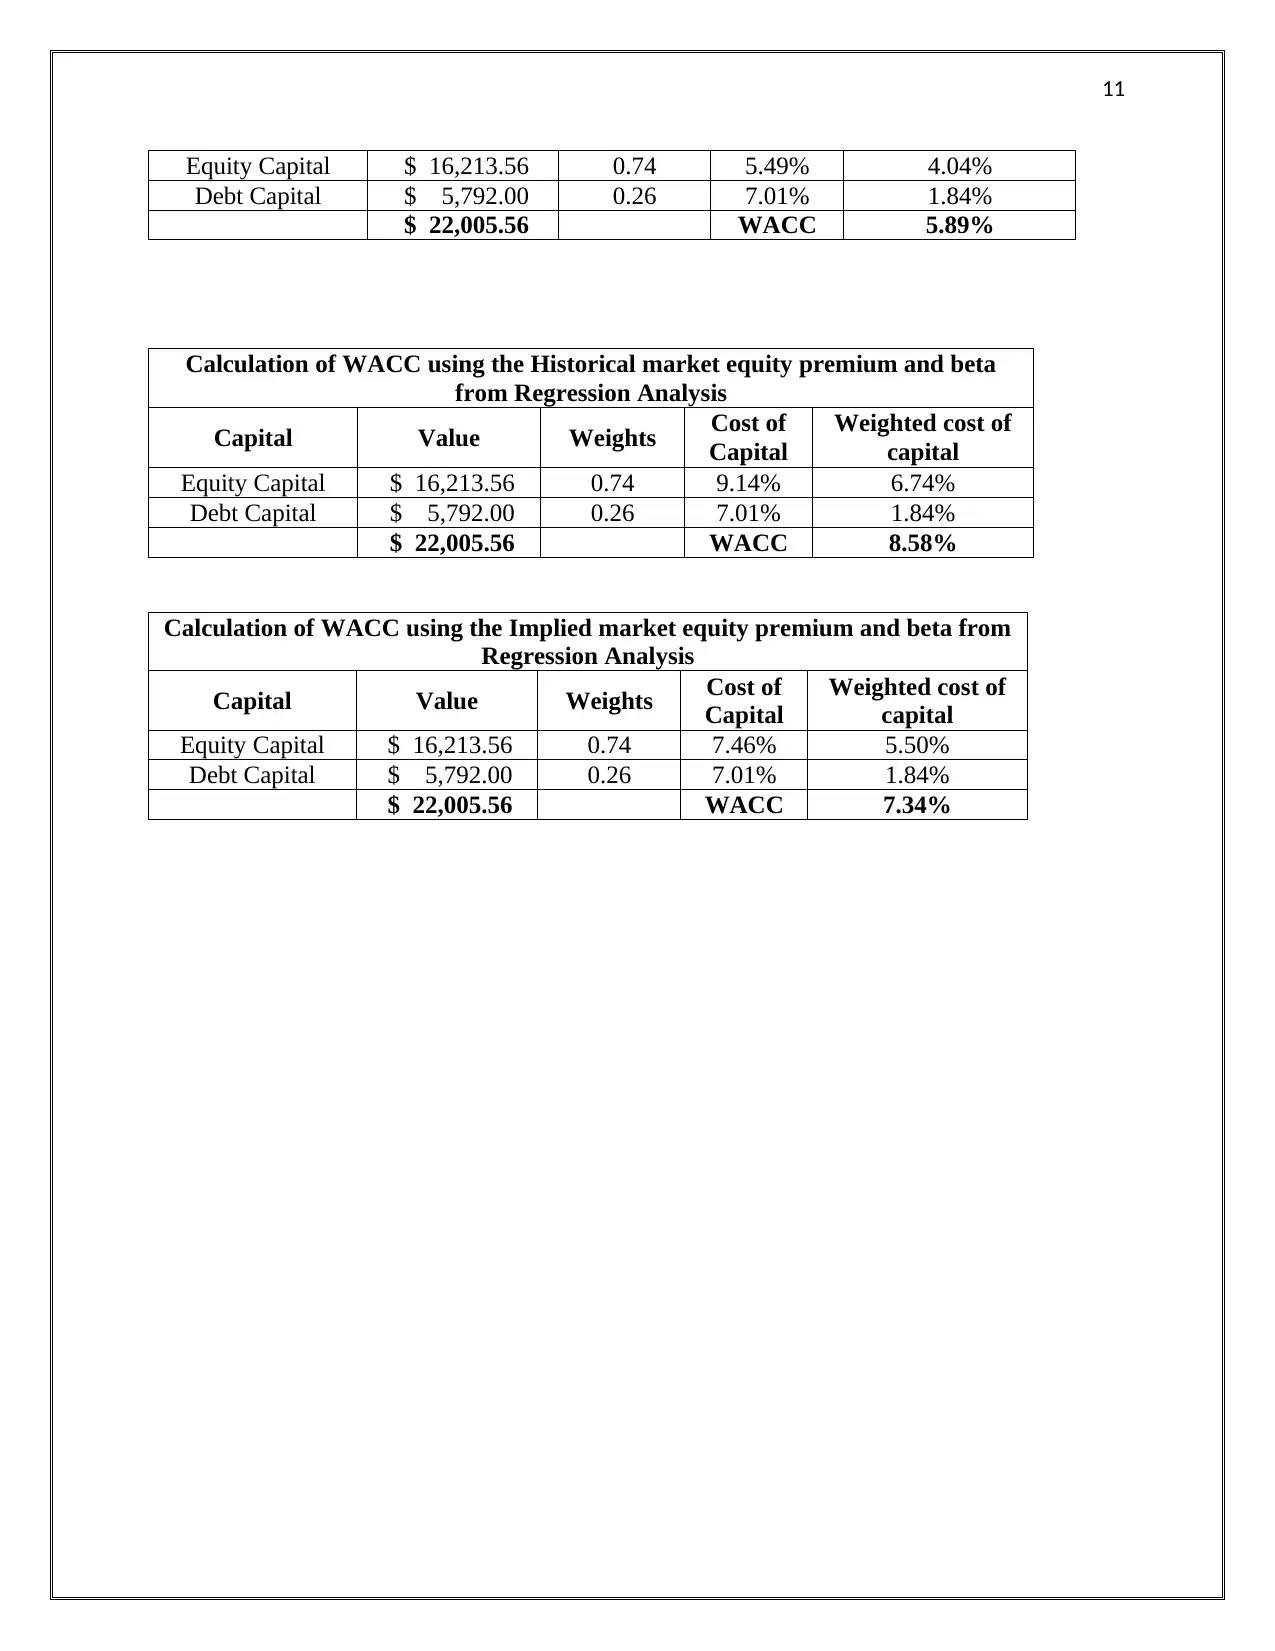
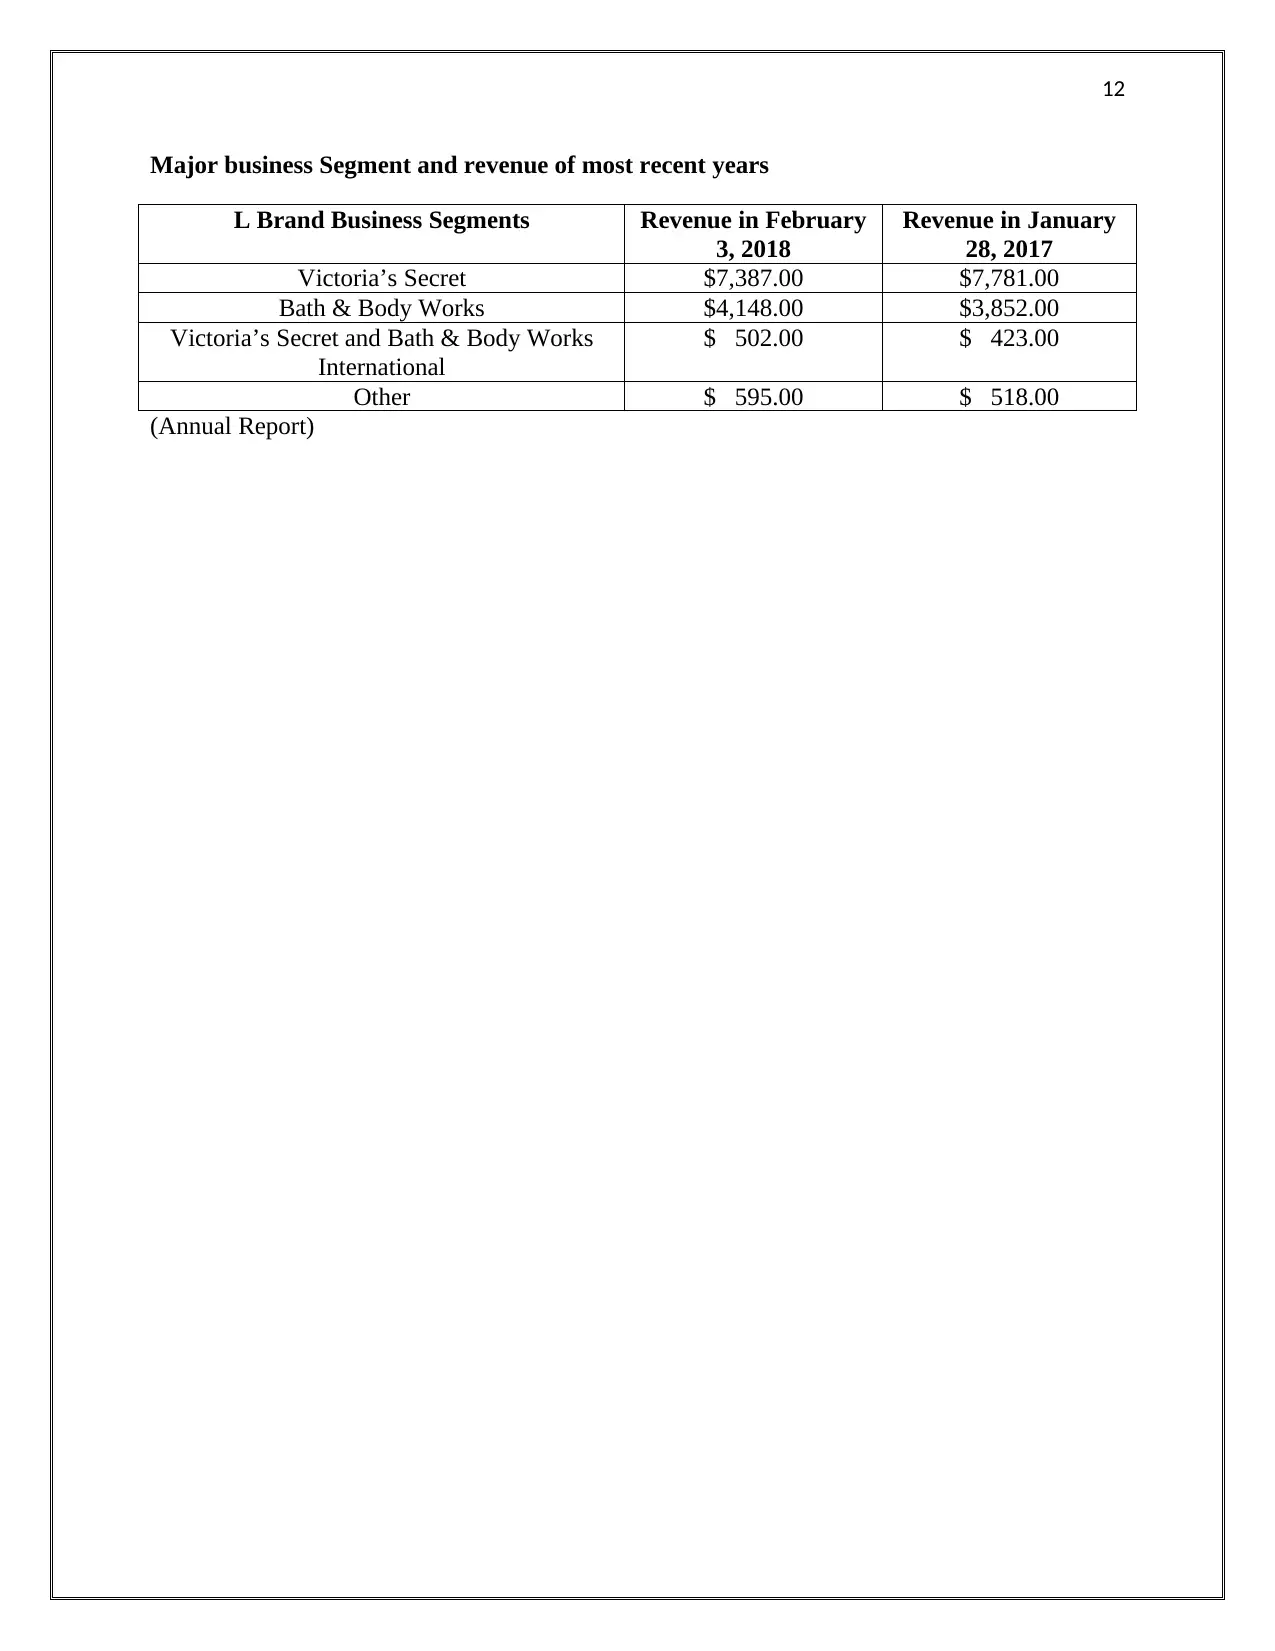
This report provides a detailed analysis of the Weighted Average Cost of Capital (WACC) for L Brands Inc., focusing on estimating the costs of equity and debt. The cost of equity is calculated using the Capital Asset Pricing Model (CAPM), considering both historical and implied equity premiums, and utilizing beta values from Reuters and regression analysis. The risk-free rate is determined using the 10-year U.S. Treasury bond rate. The cost of debt is estimated using the company's financial statements, specifically interest expenses and total debt. The report includes calculations for WACC using various combinations of equity premiums and beta values, along with a breakdown of L Brand's major business segments and revenue. The analysis uses data from sources such as Yahoo Finance, Reuters, and L Brand's annual reports, providing a comprehensive overview of the company's financial structure and cost of capital.

1
Weighted Average cost of capital of L Brand
Paraphrase This Document
Need a fresh take? Get an instant paraphrase of this document with our AI Paraphraser

2
2.1: Cost of Equity
2.1.1: Risk free rate of return
In order to select the risk free rate of return, it has been decided to choose 10 years US
Treasury bond rate as the risk free rate return. The 10 years US T-Bond rate has been chosen
from website of US treasury department (Link: https://www.treasury.gov/resource-center/data-
chart-center/interest-rates/Pages/TextView.aspx?data=yieldYear&year=2018 ) and it has taken
on January, 2 , 2018. The 10 years US T-Bond rate was 2.46 % (U.S. Department of the
Treasury) and it is taken as the proxy for risk free rate of return.
2.1.2: Market equity premium
In this part there is need to calculate two measures of market equity premium:
(A) Historical Premium: It is calculated as average of market premium for last ten years
The market index chosen for the purpose this assignment is S&P 500 and to calculate the
average historical market premium, historical price of last 10 years has been taken from January,
01, 2008 to December, 31, 2017. Data can be found in excel sheet and calculation of historical
market premium has been shown here. Historical data of S&P 500 has been taken from Yahoo
Finance (Source: Yahoo Finance: S&P 500, 2018).
Market index price is given below:
Date Adjusted Close
01/01/2008 1378.55
01/02/2008 1330.63
01/03/2008 1322.70
01/04/2008 1385.59
01/05/2008 1400.38
01/06/2008 1280.00
01/07/2008 1267.38
01/08/2008 1282.83
01/09/2008 1166.36
01/10/2008 968.75
01/11/2008 896.24
01/12/2008 903.25
01/01/2009 825.88
01/02/2009 735.09
01/03/2009 797.87
01/04/2009 872.81

3
01/05/2009 919.14
01/06/2009 919.32
01/07/2009 987.48
01/08/2009 1020.62
01/09/2009 1057.08
01/10/2009 1036.19
01/11/2009 1095.63
01/12/2009 1115.10
01/01/2010 1073.87
01/02/2010 1104.49
01/03/2010 1169.43
01/04/2010 1186.69
01/05/2010 1089.41
01/06/2010 1030.71
01/07/2010 1101.60
01/08/2010 1049.33
01/09/2010 1141.20
01/10/2010 1183.26
01/11/2010 1180.55
01/12/2010 1257.64
01/01/2011 1286.12
01/02/2011 1327.22
01/03/2011 1325.83
01/04/2011 1363.61
01/05/2011 1345.20
01/06/2011 1320.64
01/07/2011 1292.28
01/08/2011 1218.89
01/09/2011 1131.42
01/10/2011 1253.30
01/11/2011 1246.96
01/12/2011 1257.60
01/01/2012 1312.41
01/02/2012 1365.68
01/03/2012 1408.47
01/04/2012 1397.91
01/05/2012 1310.33
01/06/2012 1362.16
01/07/2012 1379.32
01/08/2012 1406.58
01/09/2012 1440.67
01/10/2012 1412.16
01/11/2012 1416.18
⊘ This is a preview!⊘
Do you want full access?
Subscribe today to unlock all pages.

Trusted by 1+ million students worldwide

4
01/12/2012 1426.19
01/01/2013 1498.11
01/02/2013 1514.68
01/03/2013 1569.19
01/04/2013 1597.57
01/05/2013 1630.74
01/06/2013 1606.28
01/07/2013 1685.73
01/08/2013 1632.97
01/09/2013 1681.55
01/10/2013 1756.54
01/11/2013 1805.81
01/12/2013 1848.36
01/01/2014 1782.59
01/02/2014 1859.45
01/03/2014 1872.34
01/04/2014 1883.95
01/05/2014 1923.57
01/06/2014 1960.23
01/07/2014 1930.67
01/08/2014 2003.37
01/09/2014 1972.29
01/10/2014 2018.05
01/11/2014 2067.56
01/12/2014 2058.90
01/01/2015 1994.99
01/02/2015 2104.50
01/03/2015 2067.89
01/04/2015 2085.51
01/05/2015 2107.39
01/06/2015 2063.11
01/07/2015 2103.84
01/08/2015 1972.18
01/09/2015 1920.03
01/10/2015 2079.36
01/11/2015 2080.41
01/12/2015 2043.94
01/01/2016 1940.24
01/02/2016 1932.23
01/03/2016 2059.74
01/04/2016 2065.30
01/05/2016 2096.95
01/06/2016 2098.86
Paraphrase This Document
Need a fresh take? Get an instant paraphrase of this document with our AI Paraphraser

5
01/07/2016 2173.60
01/08/2016 2170.95
01/09/2016 2168.27
01/10/2016 2126.15
01/11/2016 2198.81
01/12/2016 2238.83
01/01/2017 2278.87
01/02/2017 2363.64
01/03/2017 2362.72
01/04/2017 2384.20
01/05/2017 2411.80
01/06/2017 2423.41
01/07/2017 2470.30
01/08/2017 2471.65
01/09/2017 2519.36
01/10/2017 2575.26
01/11/2017 2584.84
01/12/2017 2673.61
01/01/2018 2823.81
(Source: Yahoo Finance)
In order to calculate the historical market premium there is need to make three important
decisions and they have taken as below:
Estimation period: 10 years estimation are preferred (January, 01, 2008 to December,
31, 2017)
Choice of risk free rate of return: In order to choose risk free rate of return, 10 years
US T-Bond rate has been chosen and it has been taken from the link
(https://www.treasury.gov/resource-center/data-chart-center/interest-rates/Pages/
TextView.aspx?data=yieldYear&year=2017). As there is need to calculate risk free rate
of return for last 10 years, it has been decided to use T-Bond rate of December, 31 of
every year and it can be found in excel sheet and also in calculation shown below (U.S.
Department of the Treasury).
Arithmetic or Geometric Averages: As the period use for estimating the T-Bond rate
was larger than 1 year it is decided to use geometric mean to estimate the historical
market premium.
Calculation of Market Premium
Years Jan-01 31-Dec Market
Return in %
Risk Free
Rate of
Return
Market
Premium
2008 1378.55 1347.00 -2.34% 2.25% -4.59%
2009 825.88 1073.87 23.09% 3.85% 19.24%

6
2010 1073.87 1286.12 16.50% 3.30% 13.20%
2011 1286.12 1312.41 2.00% 1.89% 0.11%
2012 1312.41 1498.11 12.40% 1.78% 10.62%
2013 1498.11 1782.59 15.96% 3.04% 12.92%
2014 1782.59 1994.99 10.65% 2.17% 8.48%
2015 1994.99 1940.24 -2.82% 2.27% -5.09%
2016 1940.24 2278.87 14.86% 2.45% 12.41%
2017 2278.87 2823.81 19.30% 2.40% 16.90%
Average mean of market premium for last 10 years 8.42%
Geometric Mean market premium for the last 10 years 8.10%
(Note: Source of Market Return is yahoo finance and that of risk free rate of return is US
Treasury Department)
B: Implied (Forward Looking) Equity market premium: This method uses constant growth
model also known as Gordon growth model for estimating the implied equity market premium.
Information Required to calculate the Implied equity premium
Components Values Sources References
Price – value of
S&P500 index
as of January 2,
2018
2,695.81
(Source:
https://in.finance.yahoo.com/qu
ote/%5EGSPC/history?p=
%5EGSPC)
(Source: Yahoo Finance:
S&P 500)
Dividend and
buyback yield
on S&P 500
firms (Yield of
year 2017)
4.12%
(Source:
https://asia.spindices.com/searc
h/?
query=dividend+and+buybacks
&Search=Go&sortType=Date&
resultsPerPage=25&ContentTy
pe=Announcement) (Source: Spindices)
Expected
growth rate in
earnings for
next 5 years for
S&P Index
11%
(Source:
https://finance.yahoo.com/quote
/LB/analysis?p=LB) (Source: Yahoo Finance: L
Brands, Inc. (LB))
10 year treasury
rate on January
2 2018
2.46%
(Source:
https://www.treasury.gov/resour
ce-center/data-chart-center/inter
est-rates/Pages/TextView.aspx?
data=yieldYear&year=2018) (Source: U.S. Department of
the Treasury)
⊘ This is a preview!⊘
Do you want full access?
Subscribe today to unlock all pages.

Trusted by 1+ million students worldwide

7
(Note: Please refer excel solver spreadsheet for calculation of implied equity premium)
Implied (Forward Looking) Equity market premium is: 6.06%
2.1.3: Stock Beta
Beta using the regression
SUMMAR
Y
OUTPUT
Regression
Statistics
Multiple R 0.25511
R Square 0.06508
Adjusted R
Square 0.05153
Standard
Error 0.08706
Observation
s 71.00000
ANOVA
Paraphrase This Document
Need a fresh take? Get an instant paraphrase of this document with our AI Paraphraser

8
df SS MS F
Significanc
e F
Regression 1.00000 0.03641
0.0364
1
4.8033
1 0.03178
Residual 69.00000 0.52300
0.0075
8
Total 70.00000 0.55941
Coefficient
s
Standar
d Error t Stat
P-
value Lower 95%
Upper
95%
Lower
95.0%
Upper
95.0%
Intercept 0.00396 0.01106
0.3577
4
0.7216
3 -0.01810
0.0260
1
-
0.0181
0
0.0260
1
X Variable
1 0.82514 0.37649
2.1916
4
0.0317
8 0.07406
1.5762
3
0.0740
6
1.5762
3
Beta under Regression
0.825
Beta directly from the Reuters
Beta value has been taken directly from the Reuters as it is not available on Bloomberg.
The current beta of L Brand is 0.50 (Source: Reuters).
2.2: Cost of Debt
It has been decided to estimate the cost of debt through financial statement of L Brand available
on Web link: http://investors.lb.com/phoenix.zhtml?c=94854&p=irol-sec.
Calculation of Cost of Debt of L Brand
Items Value at end of year 2017 Source
Amount in million $
Gross interest expense $ 406.00
Income Statement of L
Brand (Annual Report)
Long term Debt $ 5,705.00
Balance Sheet of L Brand
(Annual Report)
Short term debt $ 87.00
Balance Sheet of L Brand
(Annual Report)

9
Cost of Debt Interest/Total Debt
Cost of Debt of L Brand 7.01%
2.3 Weighted Average Cost of Capital (WACC)
It is important to estimate the cost of equity before estimating the weighted average cost
of capital (WACC)
Formula used calculate the cost of equity is Capital assets pricing model (CAPM)
Formula: Risk free rate of return + Beta (Market risk premium)
There are two values of market risk premium. Therefore, cost of equity will be calculated
two times, one by using historical equity premium and other one through using the implied
equity premium.
Cost of Equity using beta value from Reuters
Risk Free
Rate Beta
Historical Equity
premium
Implied Equity
premium
Cost of
Equity
2.46% 0.50 8.10% 6.51%
2.46% 0.50 6.06% 5.49%
Cost of Equity using beta value from Regression Analysis
Risk Free
Rate Beta
Historical Equity
premium
Implied Equity
premium
Cost of
Equity
2.46% 0.825 8.10% 9.14%
2.46% 0.825 6.06% 7.46%
As all the values for calculating the cost of equity and cost of debt has been on January 2,
2018, therefore, it has been decided to take value of debt and value of equity as on starting of
January, 2018. Financial data in latest annual report of L Brand has been considered as it shows
data as on February 3, 2018. For estimating the value of debt it has been decided to use book
value of long term debt and short term debt. To estimate the value of equity market price of as on
January 2, 2018 has been multiplied by number of shares issued by L Brand.
Calculation of Weight of equity and
debt capital Source
⊘ This is a preview!⊘
Do you want full access?
Subscribe today to unlock all pages.

Trusted by 1+ million students worldwide

10
Debt Capital
$ in millions except market price
Long term Debt
$
5,705.00
Financial Statement
(Annual Report)
Short term debt
$
87.00
Financial Statement
(Annual Report)
Book value of total debt
$
5,792.00
Equity Capital
Market price as on January 2, 2018
$
57.09 Yahoo Finance
Total number of share issued 284 million
Notes of accounts of L-
Brand Annual report
(Annual Report)
Market value of Equity capital
$
16,213.56
Information Gathered from past results
Cost of debt
7.01
%
Cost of Equity (Historical data) and Beta (Reuters)
6.51
%
Cost of Equity (Implied data)and Beta (Reuters)
5.49
%
Cost of Equity (Historical data) and Beta (Regression)
9.14
%
Cost of Equity (Implied data)and Beta (Regression)
7.46
%
Calculation of WACC using the Historical market equity premium and beta from
Reuters
Capital Value Weights Cost of
Capital
Weighted cost of
capital
Equity Capital $ 16,213.56 0.74 6.51% 4.80%
Debt Capital $ 5,792.00 0.26 7.01% 1.84%
$ 22,005.56 WACC 6.64%
Calculation of WACC using the Implied market equity premium and beta from
Reuters
Capital Value Weights Cost of
Capital
Weighted cost of
capital
Paraphrase This Document
Need a fresh take? Get an instant paraphrase of this document with our AI Paraphraser

11
Equity Capital $ 16,213.56 0.74 5.49% 4.04%
Debt Capital $ 5,792.00 0.26 7.01% 1.84%
$ 22,005.56 WACC 5.89%
Calculation of WACC using the Historical market equity premium and beta
from Regression Analysis
Capital Value Weights Cost of
Capital
Weighted cost of
capital
Equity Capital $ 16,213.56 0.74 9.14% 6.74%
Debt Capital $ 5,792.00 0.26 7.01% 1.84%
$ 22,005.56 WACC 8.58%
Calculation of WACC using the Implied market equity premium and beta from
Regression Analysis
Capital Value Weights Cost of
Capital
Weighted cost of
capital
Equity Capital $ 16,213.56 0.74 7.46% 5.50%
Debt Capital $ 5,792.00 0.26 7.01% 1.84%
$ 22,005.56 WACC 7.34%

12
Major business Segment and revenue of most recent years
L Brand Business Segments Revenue in February
3, 2018
Revenue in January
28, 2017
Victoria’s Secret $7,387.00 $7,781.00
Bath & Body Works $4,148.00 $3,852.00
Victoria’s Secret and Bath & Body Works
International
$ 502.00 $ 423.00
Other $ 595.00 $ 518.00
(Annual Report)
⊘ This is a preview!⊘
Do you want full access?
Subscribe today to unlock all pages.

Trusted by 1+ million students worldwide
1 out of 13
Related Documents
Your All-in-One AI-Powered Toolkit for Academic Success.
+13062052269
info@desklib.com
Available 24*7 on WhatsApp / Email
Unlock your academic potential
Copyright © 2020–2025 A2Z Services. All Rights Reserved. Developed and managed by ZUCOL.


