BUS1BAN Major Assignment: Smartphone Demand at La Trobe University

Verified

Added on  2023/06/11

|18
|1219
|112
Report
AI Summary
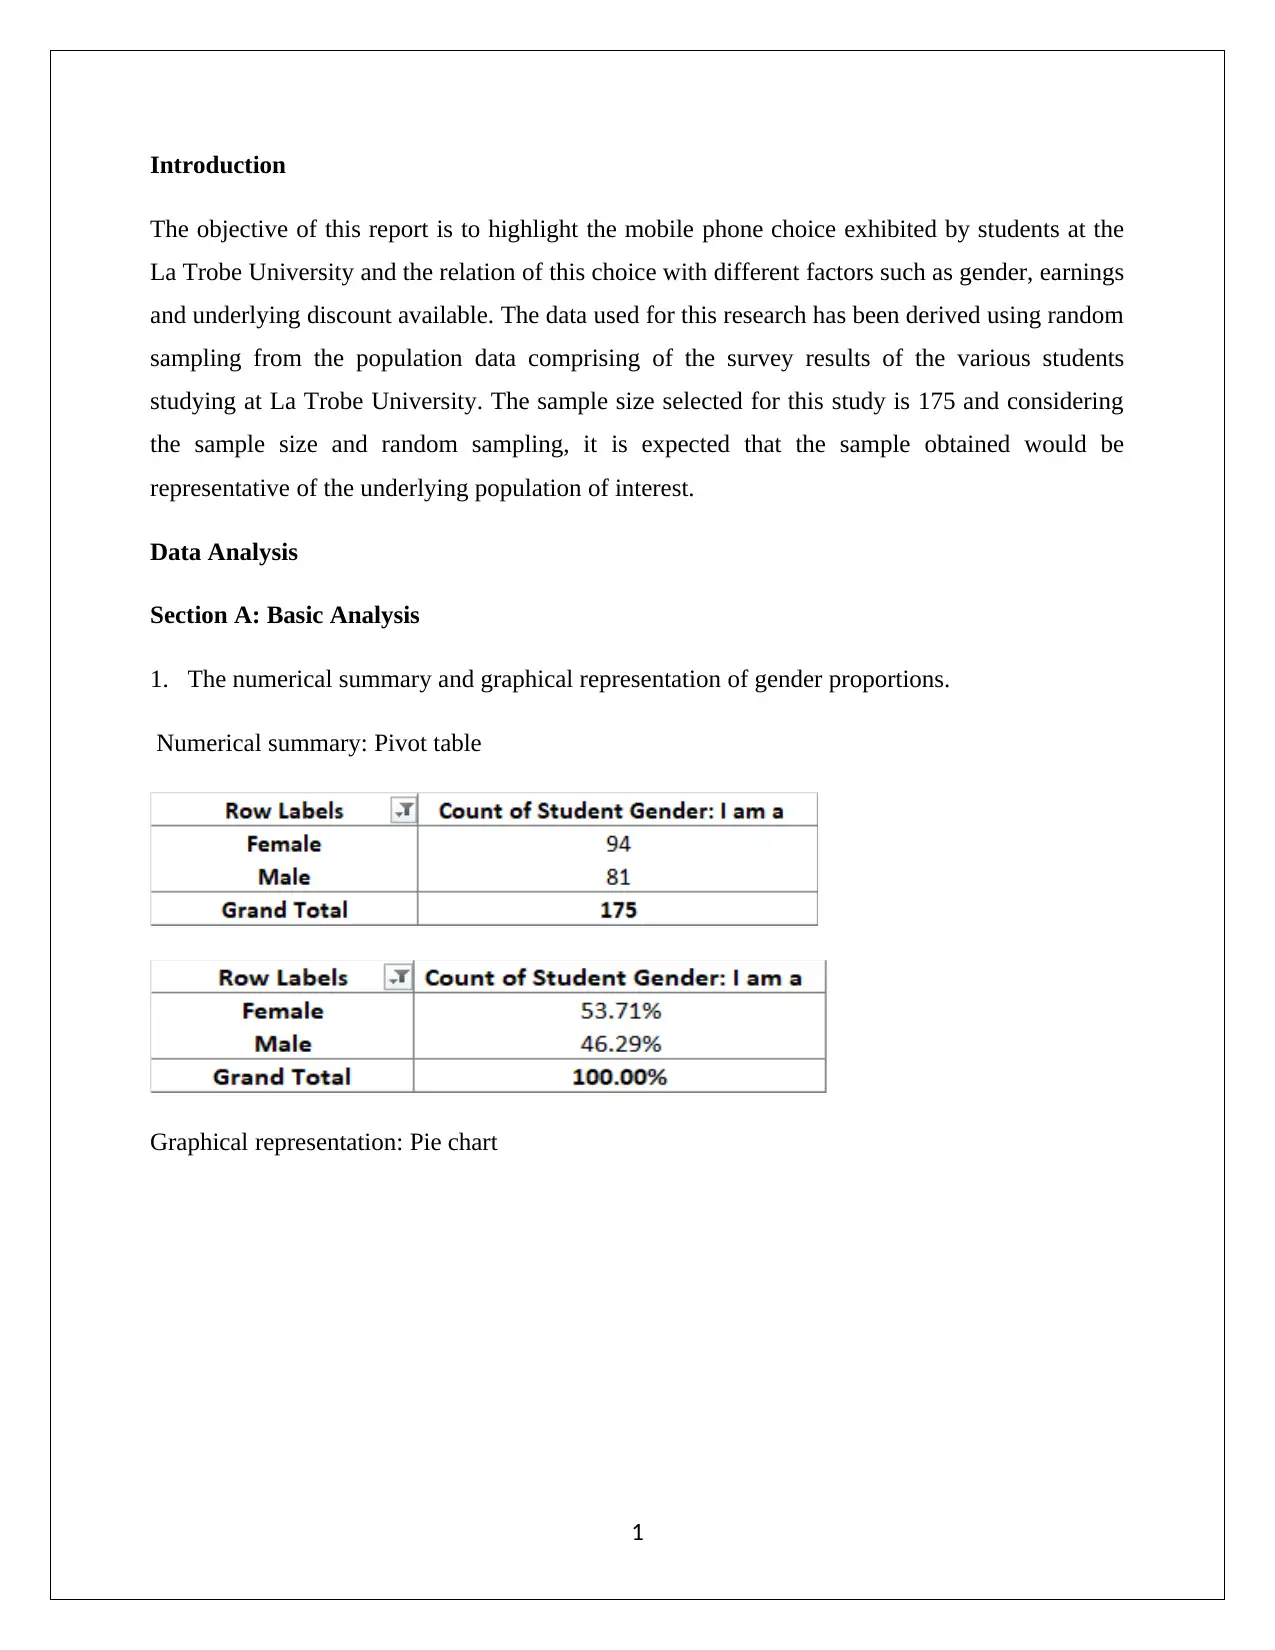
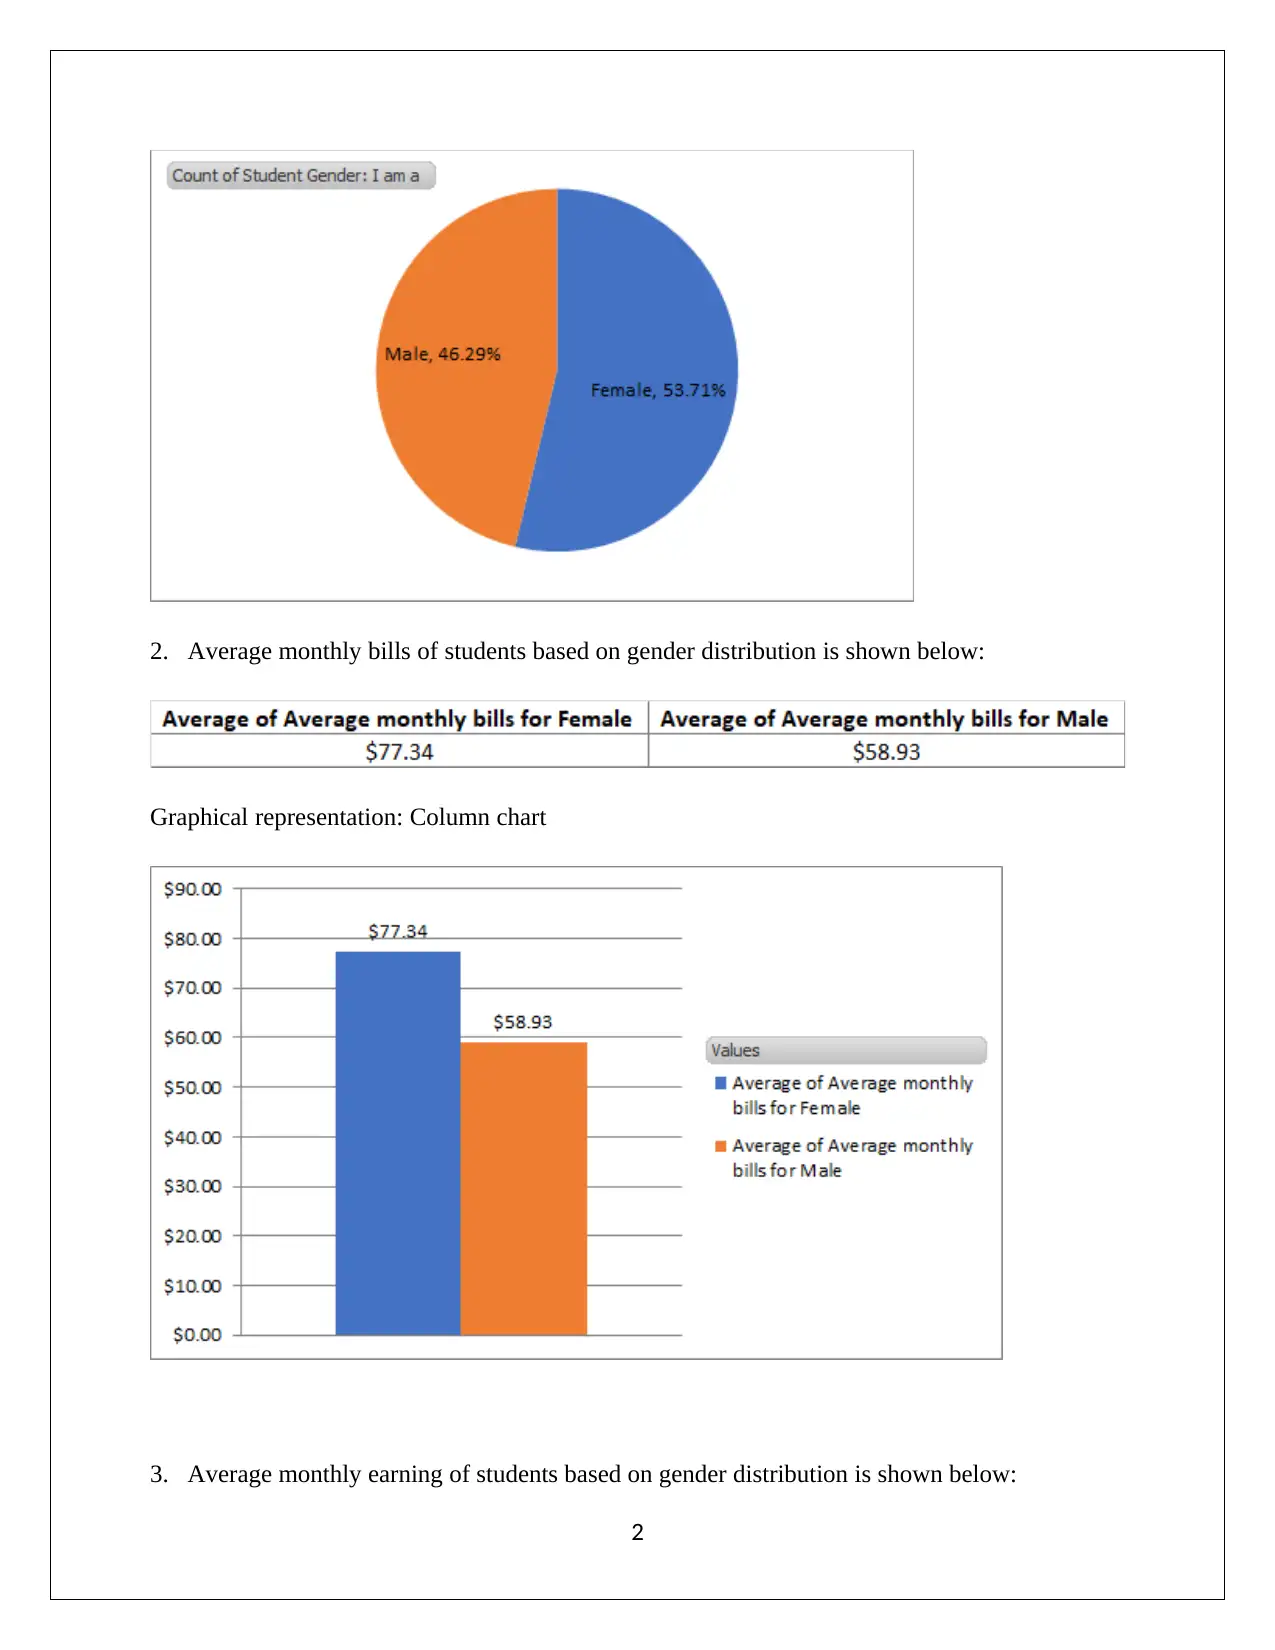
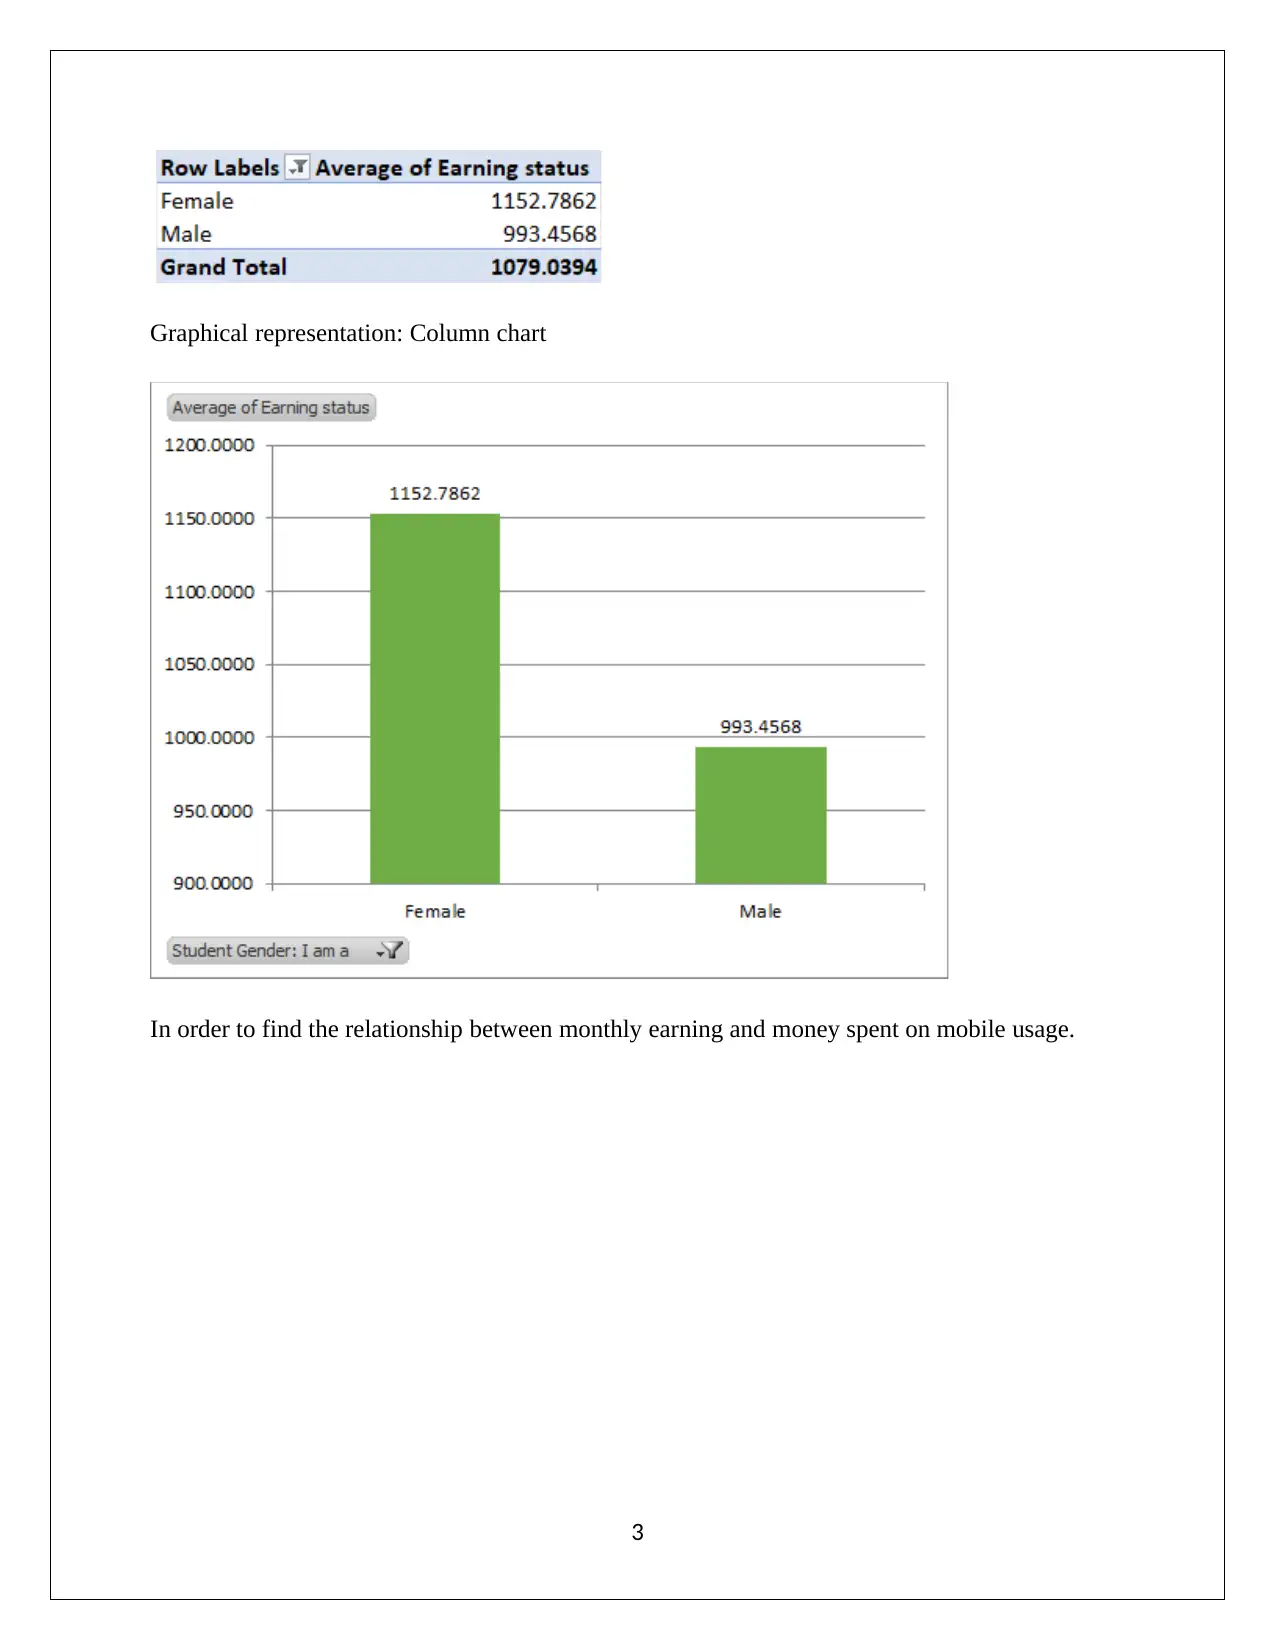
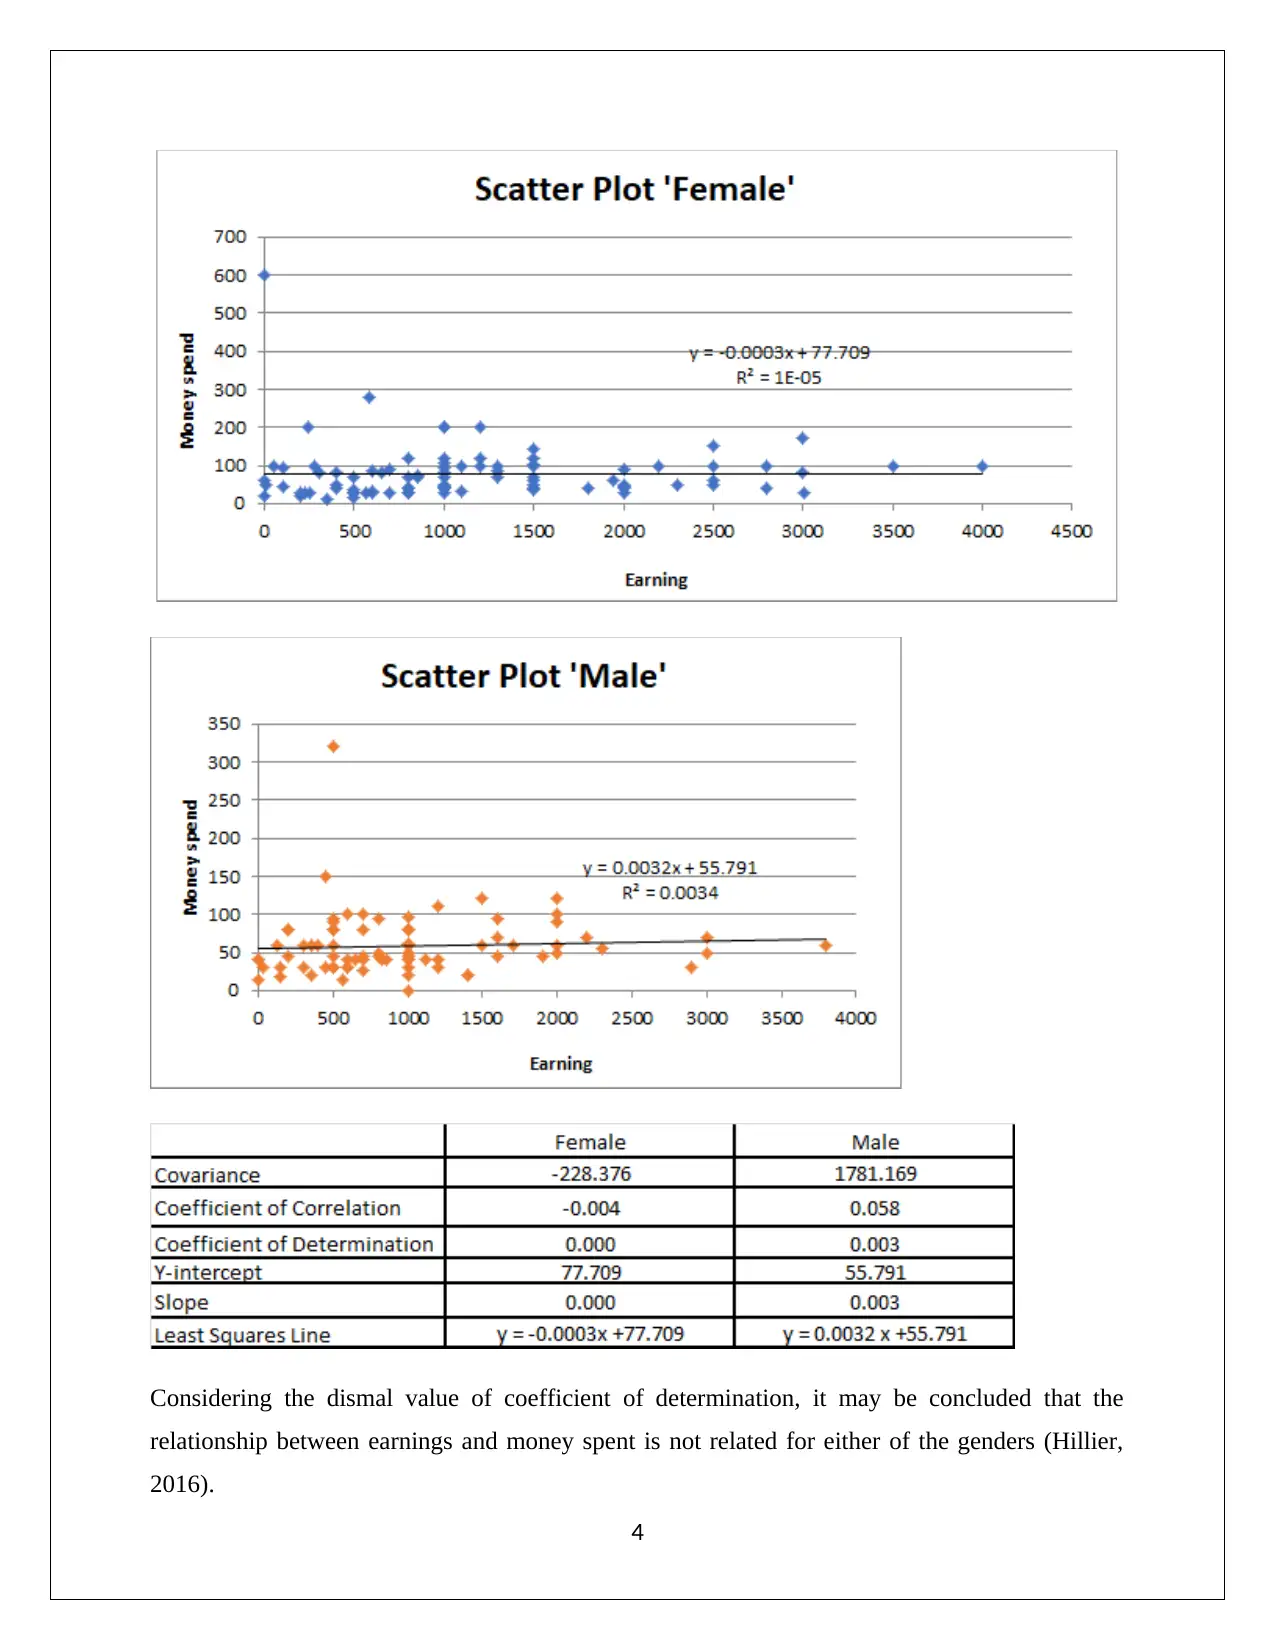
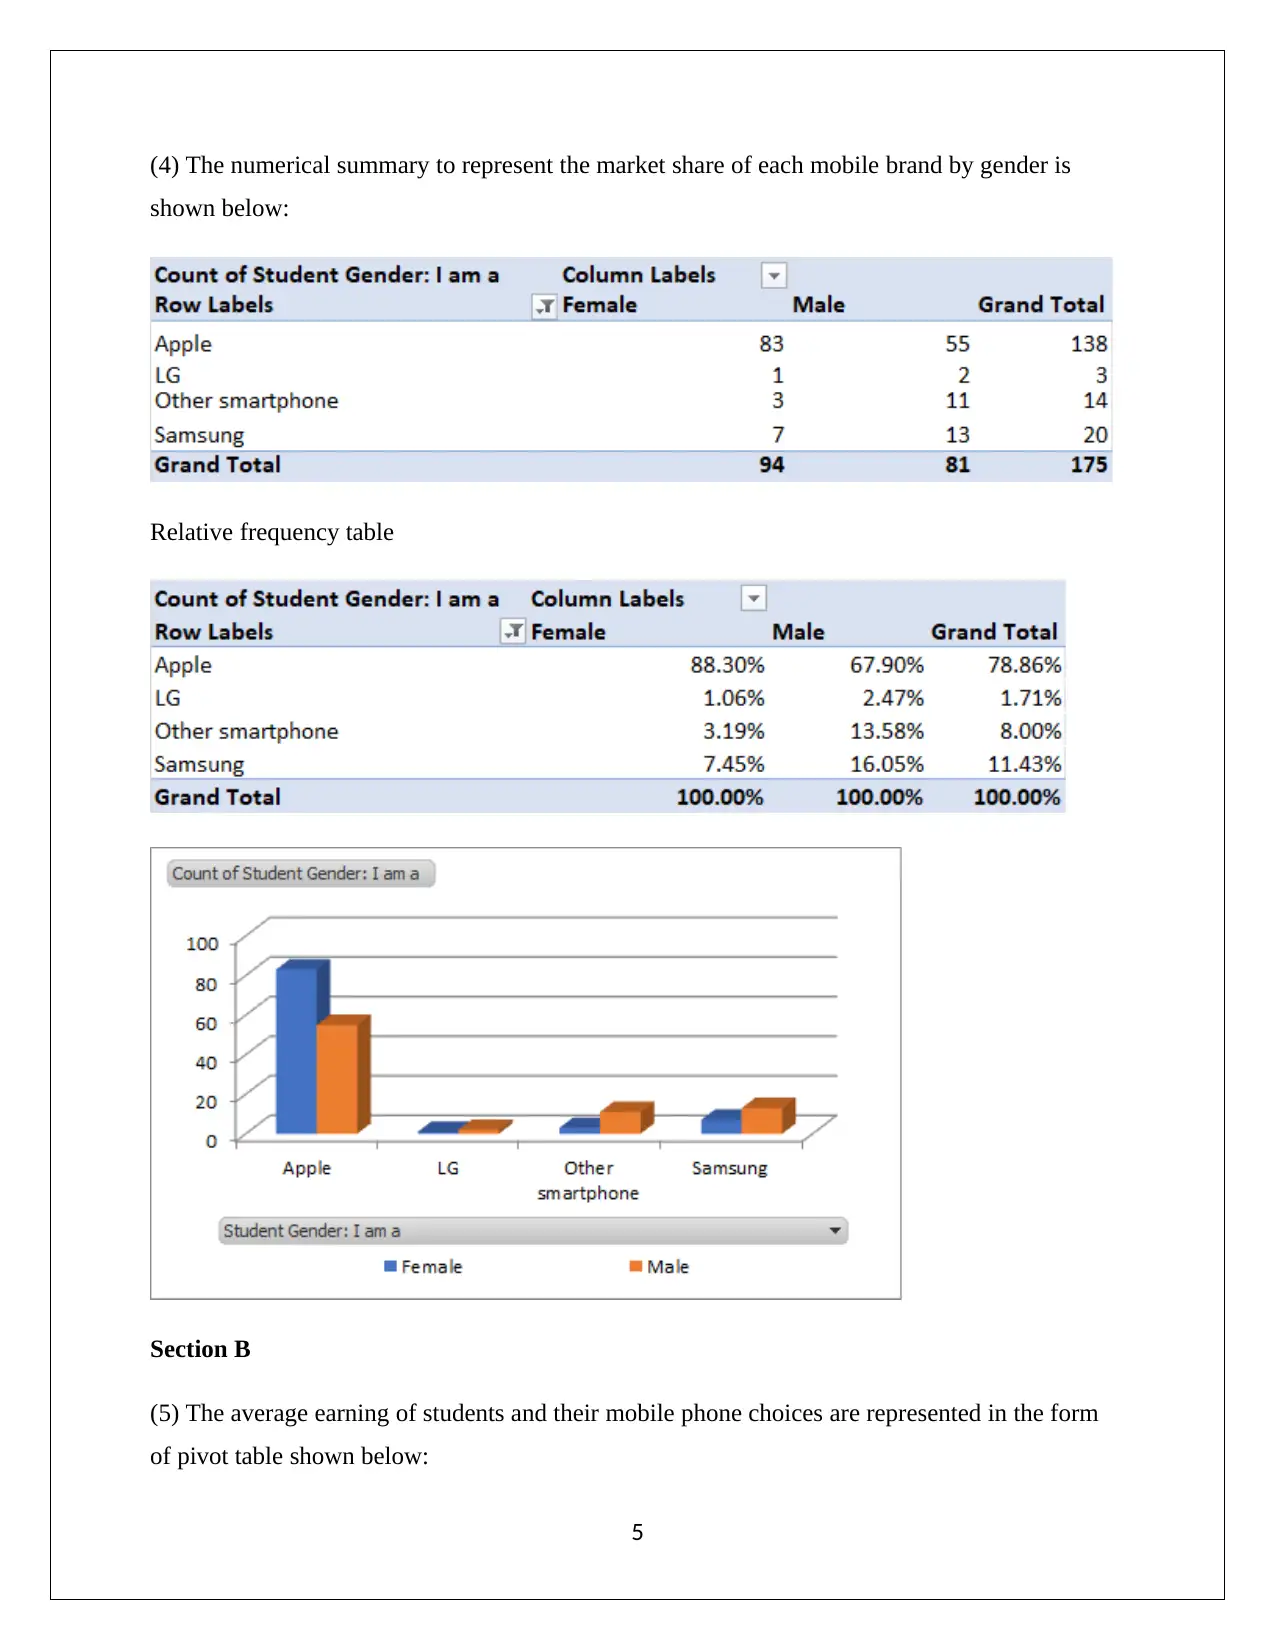
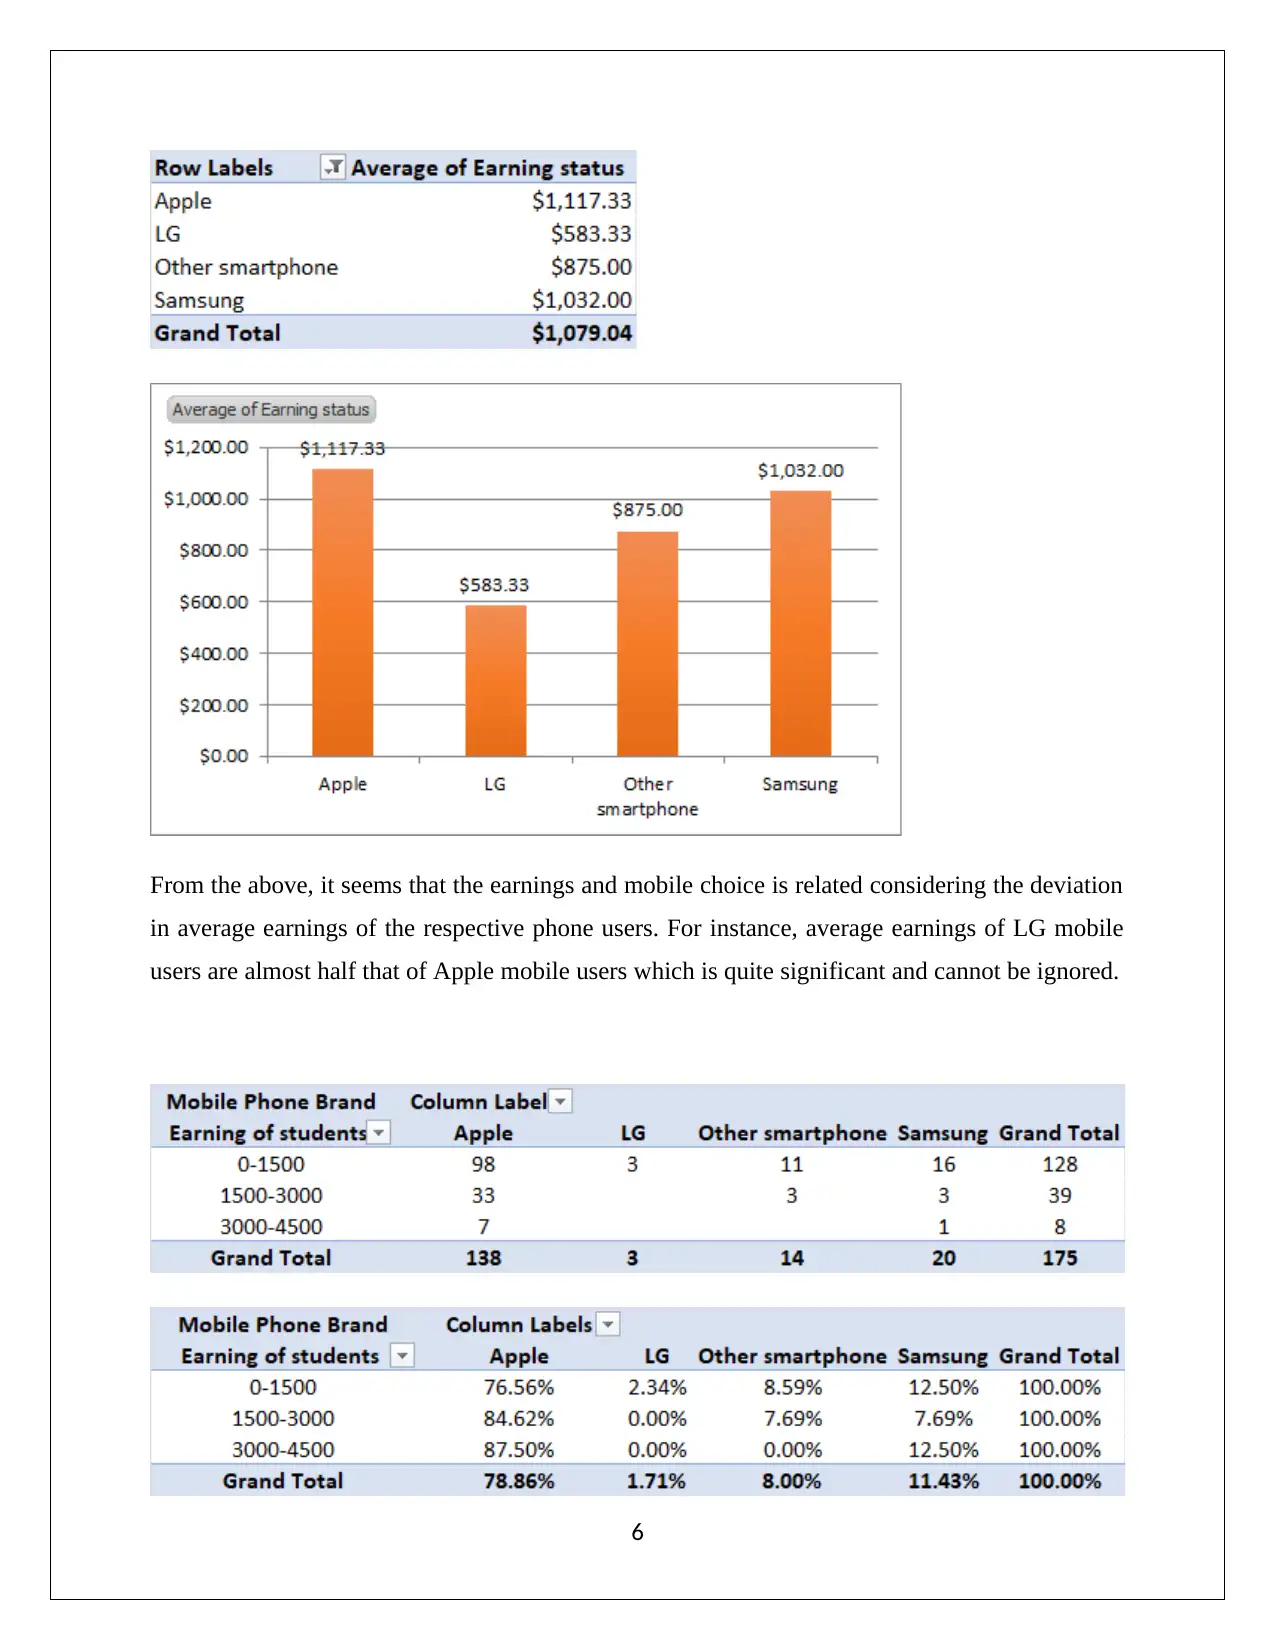
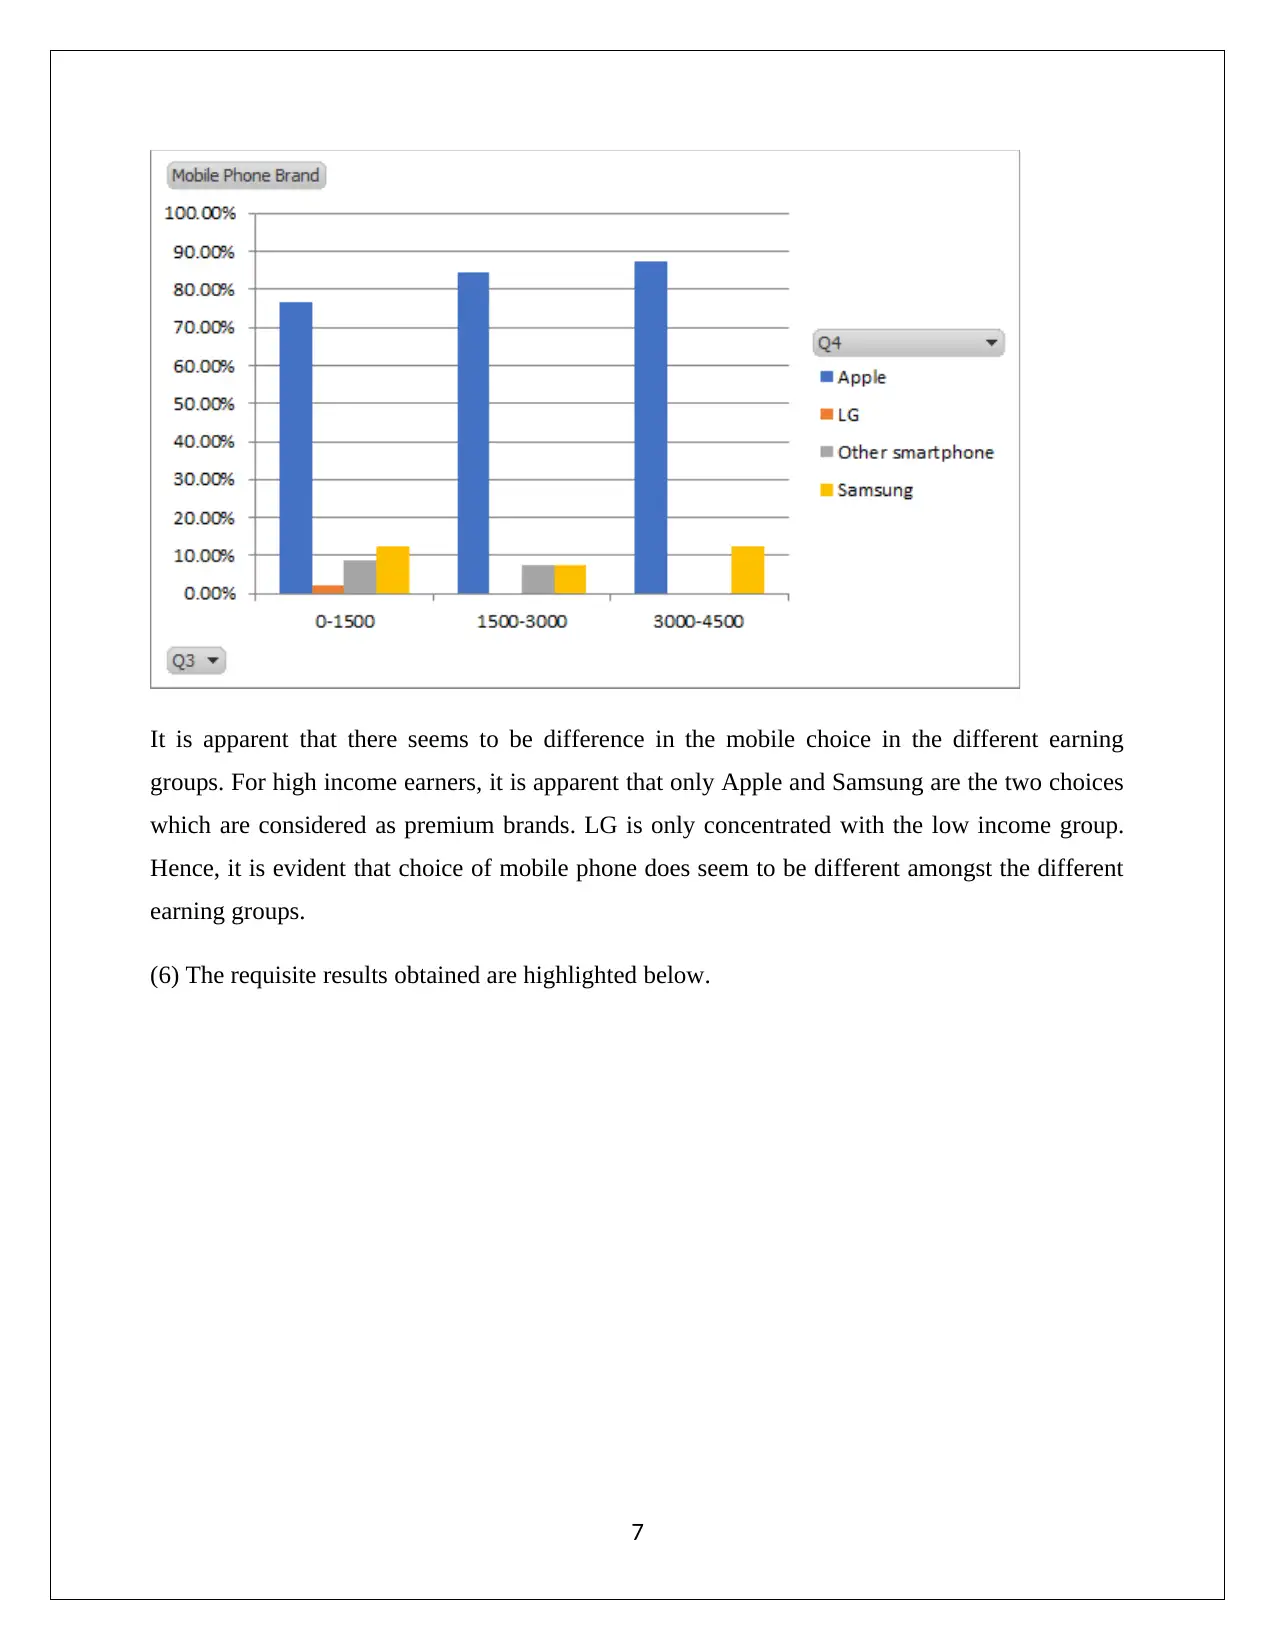
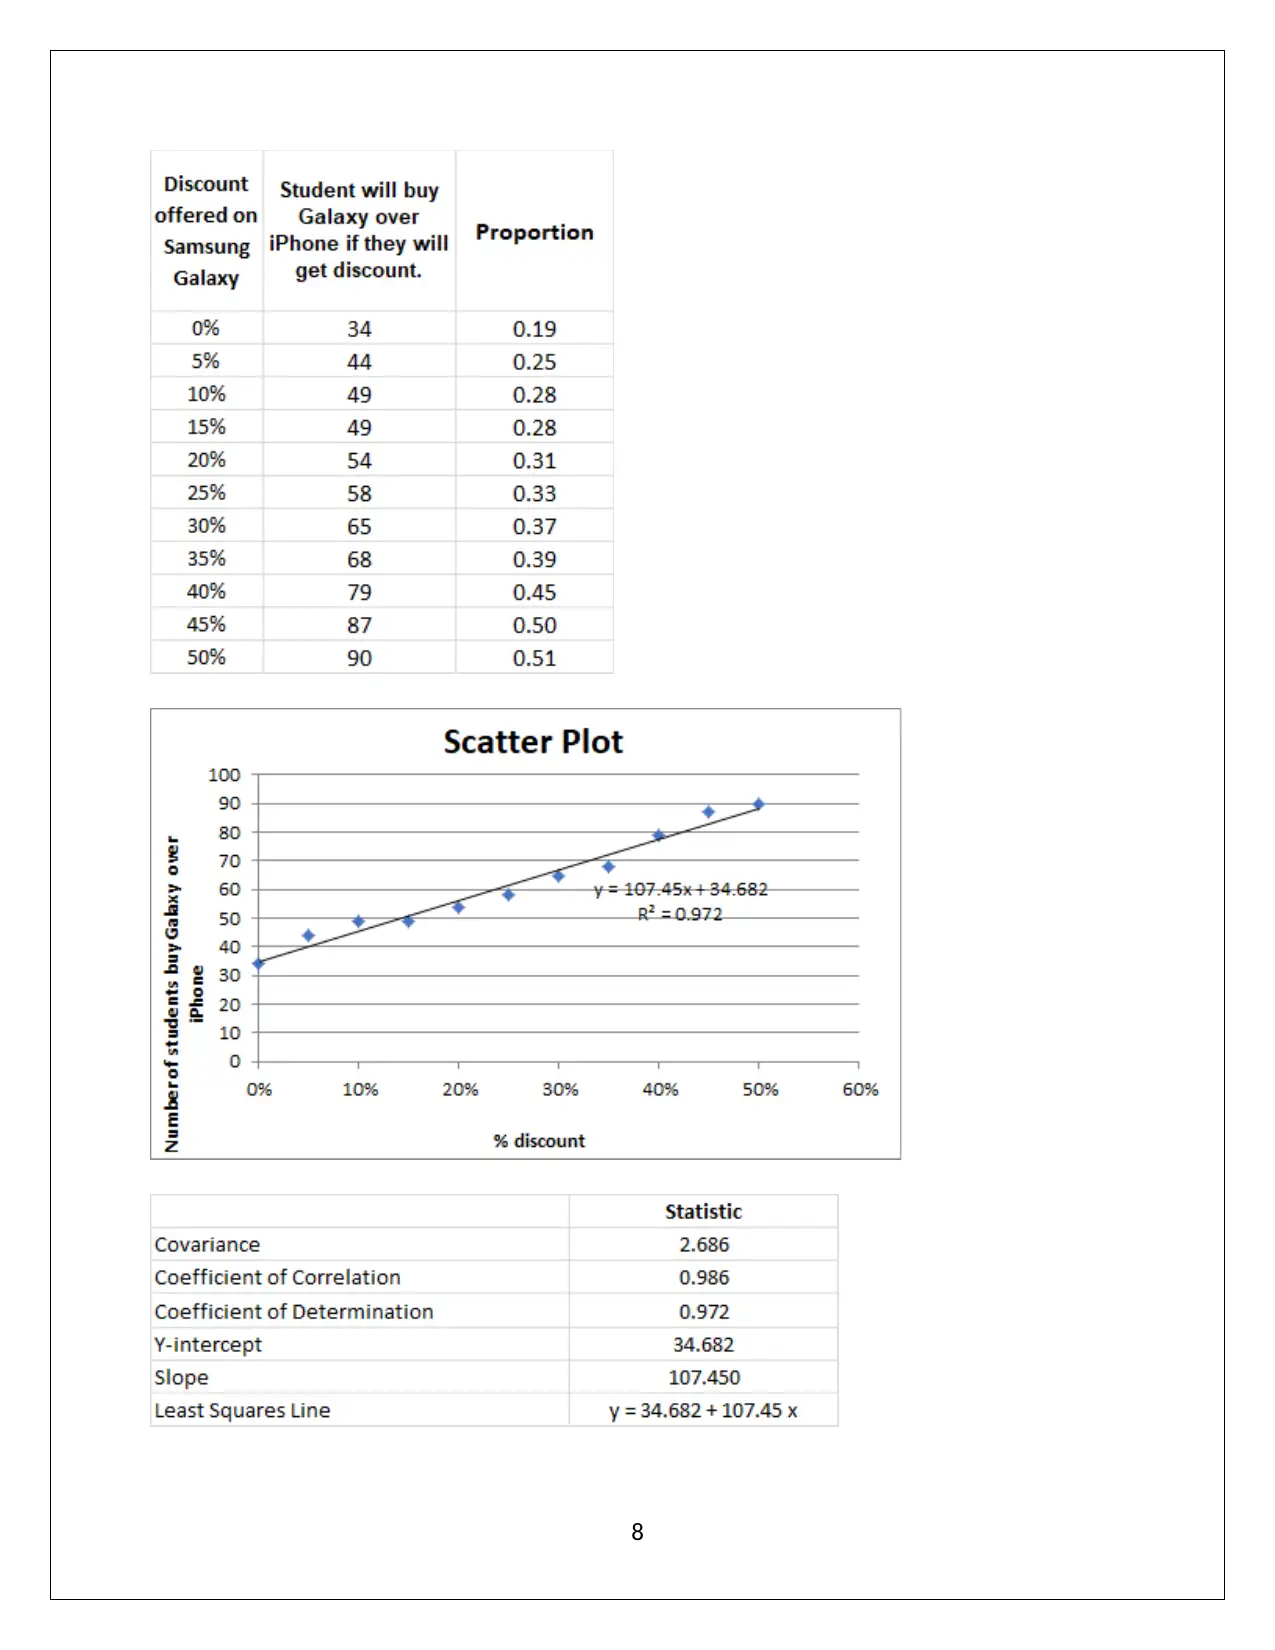
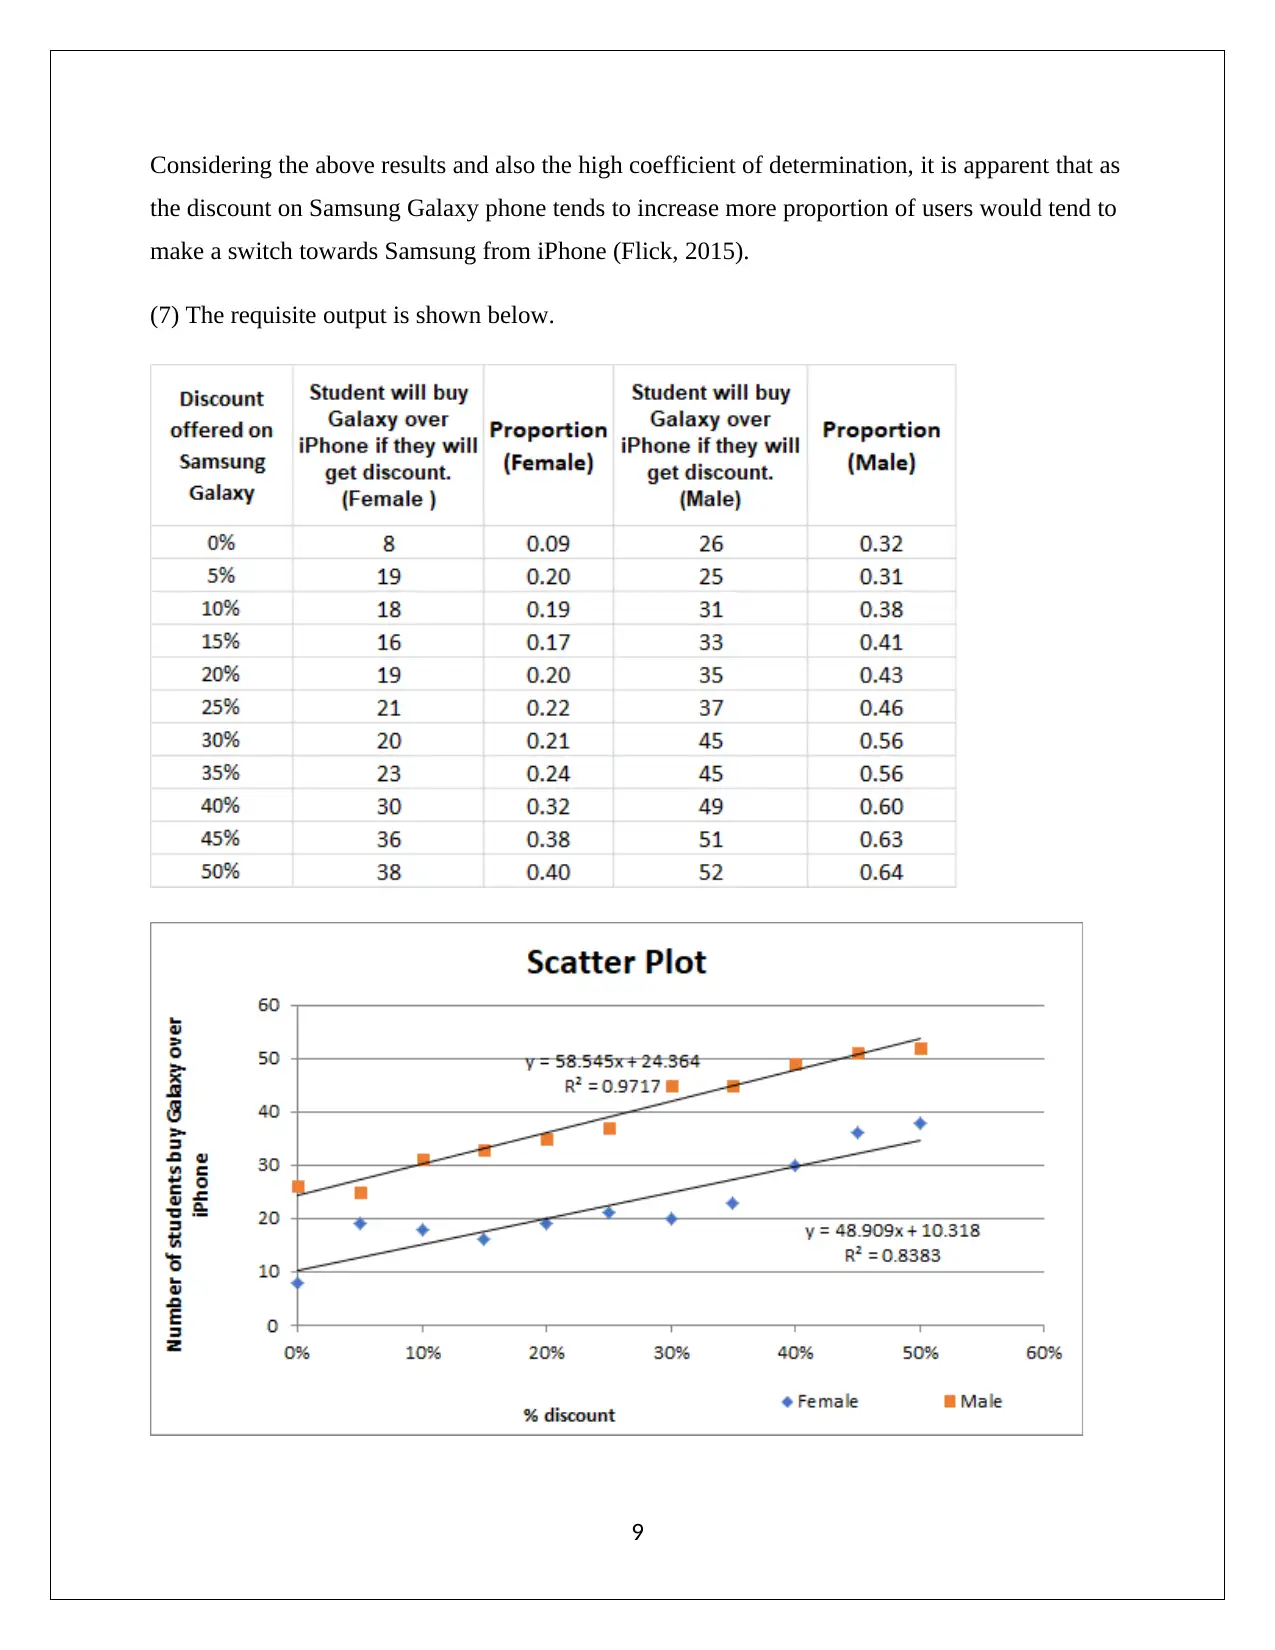
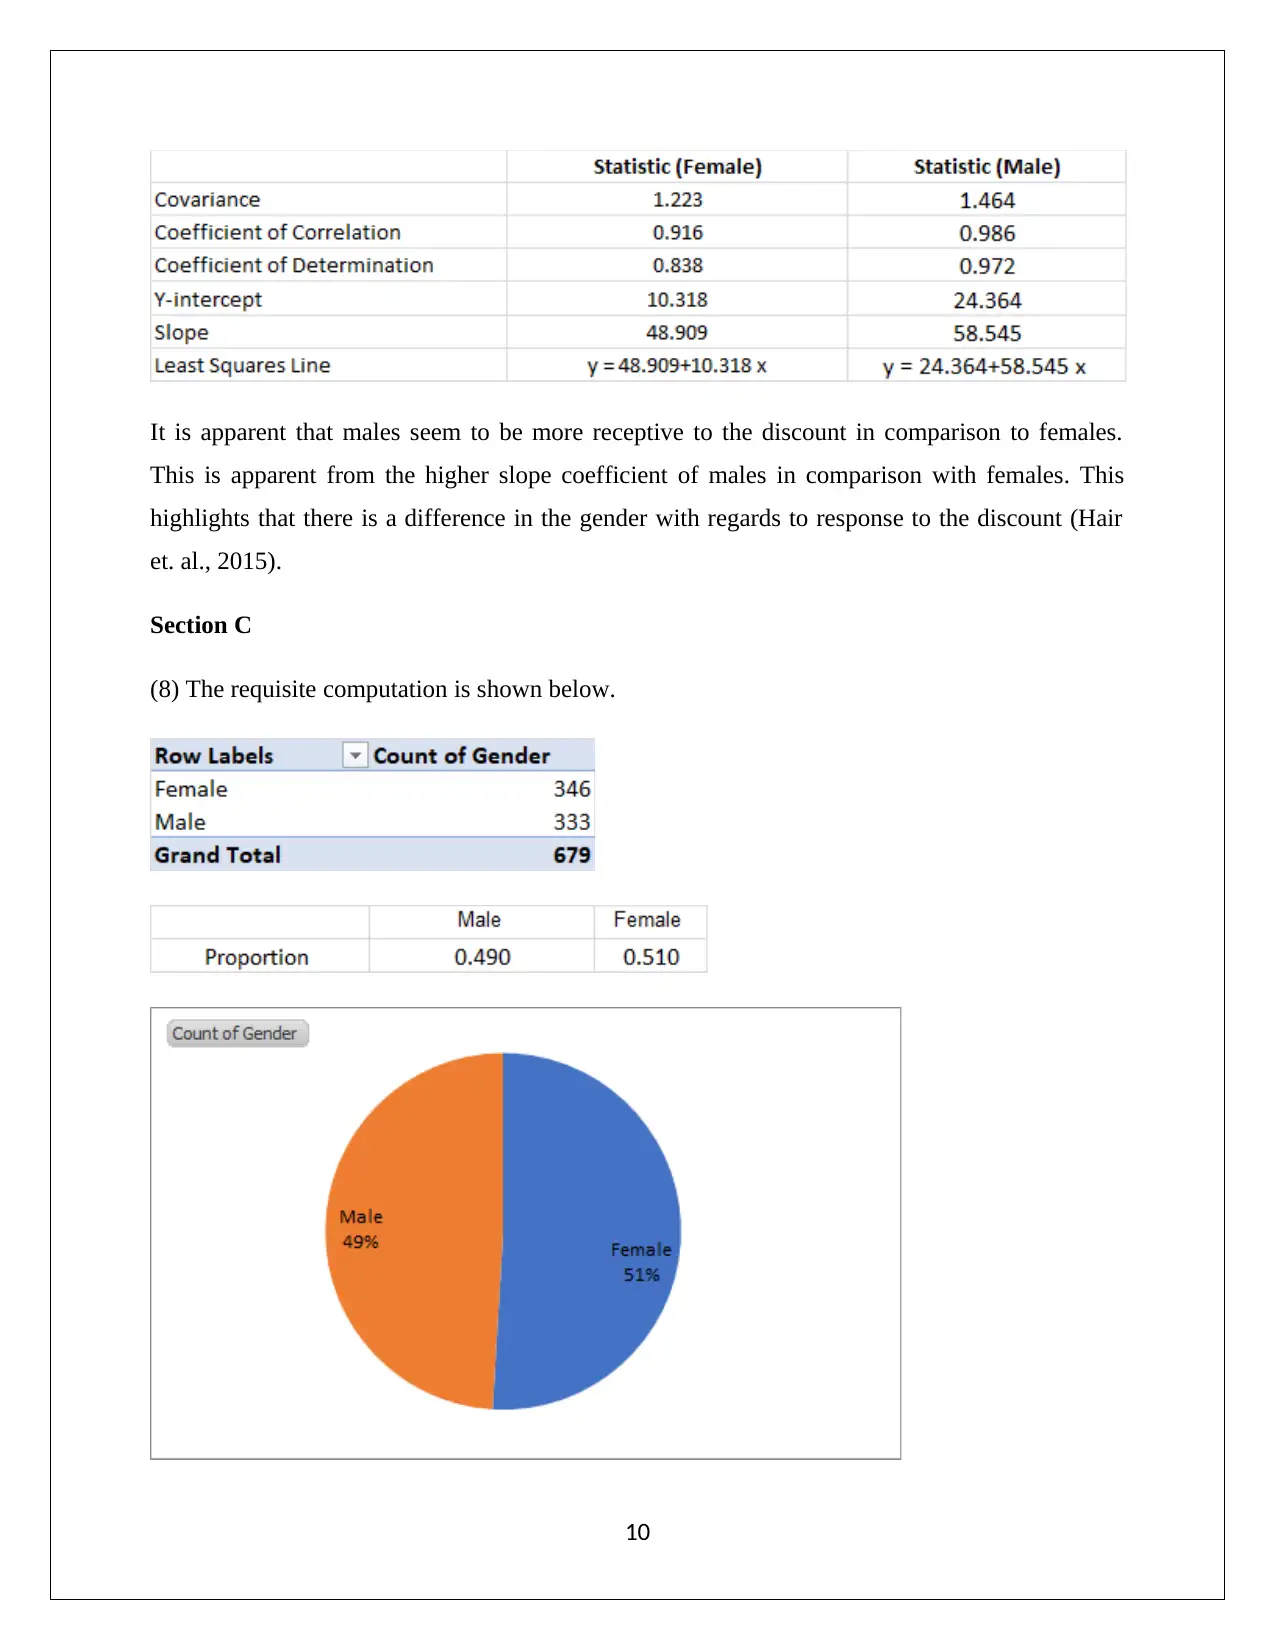
This report analyzes the mobile phone choices of La Trobe University students, examining the relationship between these choices and factors like gender, earnings, and available discounts. Data was collected through random sampling of student survey results, with a sample size of 175. The analysis includes basic statistics on gender proportions, average monthly bills and earnings by gender, and market share by mobile brand. Regression analysis explores the relationship between monthly earnings and mobile usage, while hypothesis testing assesses the market share of iPhones. The report concludes that mobile phone choice is influenced by earnings, gender impacts spending habits, and Samsung Galaxy discounts can drive users away from Apple iPhones, particularly among males. It is also concluded that iPhone share is more than 40% for La Trobe university students as well.
Document Page
Cover Page
BUS1BAN Major Assignment
Teacher’s Name Najam Iqbal
Workshop Details
(Time, day, room)
DW 212 EBL 5, Wednesday’s 2PM till 4PM
Students ID
Number
Students Name Student contribution*
(%)
e.g. 50% means the
student will receive 50%
of the marks awarded
Students Signature
S19416453 Candace Hughes
19095339 Nathan Sleep
18856078 Guyang Zhang
tabler-icon-diamond-filled.svg

Paraphrase This Document

Need a fresh take? Get an instant paraphrase of this document with our AI Paraphraser
Document Page
Introduction
The objective of this report is to highlight the mobile phone choice exhibited by students at the
La Trobe University and the relation of this choice with different factors such as gender, earnings
and underlying discount available. The data used for this research has been derived using random
sampling from the population data comprising of the survey results of the various students
studying at La Trobe University. The sample size selected for this study is 175 and considering
the sample size and random sampling, it is expected that the sample obtained would be
representative of the underlying population of interest.
Data Analysis
Section A: Basic Analysis
1. The numerical summary and graphical representation of gender proportions.
Numerical summary: Pivot table
Graphical representation: Pie chart
1
Document Page
2. Average monthly bills of students based on gender distribution is shown below:
Graphical representation: Column chart
3. Average monthly earning of students based on gender distribution is shown below:
2
Document Page
Graphical representation: Column chart
In order to find the relationship between monthly earning and money spent on mobile usage.
3
tabler-icon-diamond-filled.svg

Paraphrase This Document

Need a fresh take? Get an instant paraphrase of this document with our AI Paraphraser
Document Page
Considering the dismal value of coefficient of determination, it may be concluded that the
relationship between earnings and money spent is not related for either of the genders (Hillier,
2016).
4
Document Page
(4) The numerical summary to represent the market share of each mobile brand by gender is
shown below:
Relative frequency table
Section B
(5) The average earning of students and their mobile phone choices are represented in the form
of pivot table shown below:
5
Document Page
From the above, it seems that the earnings and mobile choice is related considering the deviation
in average earnings of the respective phone users. For instance, average earnings of LG mobile
users are almost half that of Apple mobile users which is quite significant and cannot be ignored.
6
tabler-icon-diamond-filled.svg

Paraphrase This Document

Need a fresh take? Get an instant paraphrase of this document with our AI Paraphraser
Document Page
It is apparent that there seems to be difference in the mobile choice in the different earning
groups. For high income earners, it is apparent that only Apple and Samsung are the two choices
which are considered as premium brands. LG is only concentrated with the low income group.
Hence, it is evident that choice of mobile phone does seem to be different amongst the different
earning groups.
(6) The requisite results obtained are highlighted below.
7
Document Page
8
Document Page
Considering the above results and also the high coefficient of determination, it is apparent that as
the discount on Samsung Galaxy phone tends to increase more proportion of users would tend to
make a switch towards Samsung from iPhone (Flick, 2015).
(7) The requisite output is shown below.
9
tabler-icon-diamond-filled.svg

Paraphrase This Document

Need a fresh take? Get an instant paraphrase of this document with our AI Paraphraser
Document Page
It is apparent that males seem to be more receptive to the discount in comparison to females.
This is apparent from the higher slope coefficient of males in comparison with females. This
highlights that there is a difference in the gender with regards to response to the discount (Hair
et. al., 2015).
Section C
(8) The requisite computation is shown below.
10
Document Page
95% confidence interval
11
chevron_up_icon
1 out of 18
circle_padding
hide_on_mobile
zoom_out_icon
[object Object]