MKT20019 - Research Report: Ladder Art Space & Student Art Attendance
VerifiedAdded on 2023/03/31
|23
|3265
|97
Report
AI Summary
This research report investigates how Ladder Art Space can increase student participation in its art classes, particularly among male students. The study explores university students' awareness and attitudes toward art events and their preferred types of art classes. Key findings reveal that most students do not frequently attend art classes, with a notable gender disparity showing lower attendance among males. A positive correlation exists between student age and attendance rate, suggesting increased interest in art as students mature. The report also evaluates students' overall attitudes toward art classes and examines the relationship between gender and preferred class types. Statistical analyses, including frequency tests, cross-tabulations, correlation analysis, and ANOVA tests, support these findings. The report concludes with strategic recommendations for Ladder Art Space to enhance student engagement, focusing on targeted sensitization efforts to highlight the importance of art and art activities.

1
MARKETING RESEARCH
Name of Student:
Name of Institution;
Date:
MARKETING RESEARCH
Name of Student:
Name of Institution;
Date:
Paraphrase This Document
Need a fresh take? Get an instant paraphrase of this document with our AI Paraphraser
2
Executive Summary
This is a report on research carried out by Ladder Art Space Company. The main objective of
the research was to identify ways in which the organization can increase the number of students
taking their classes. More emphasis was on male students. The main research problem was to
investigate the attitude and awareness levels of university students towards arts events. The
research also sought to identify the most preferred type of art class by this group of students.
There were three (3) research objectives of the study with different research questions. The
research objectives, research questions and the recommendations based the findings are
discussed below.
To begin with, the research question sought to investigate the attendance of art by university
students in Melbourne. The results demonstrated that the majority of university students do not
often attend art classes. The frequency of those who least often attend art classes is 42
representing 28% (the majority).
The other research question was to investigate the difference in the rate of attendance of by
gender. The difference was investigated by cross tabulations. The crosstab demonstrated that
there were a total of 150 university students. Out of the 150 students, 57 of them were identified
to be male students while the remaining 93 were female students. From the results, it is clear
that the majority of students who do not often attend art class are males (25). There are more
males who do not often attend art classes (25) than female students (17).
The other research question investigated the relationship between age and rate of attendance.
The relationship was investigated using the correlation analysis. This is a statistical technique
that is used to investigate the nature and strength of the relationship that exists between two or
more variables. The result of the analysis is recorded in the table below. From the table, the
results indicate that the correlation coefficient between the attendance rate and the age of the
participants is 0.782. This is a strong positive correlation coefficient. It implies that if the age of
3
a student is increased by 1 unit, this will cause a corresponding increase in the rate of
attendance by 0.782 units and vice versa. This relationship is therefore significant since the
significance value (0.023) is less than the standard level of significance (0.05).
To investigate the attitude of the students and their awareness levels towards different types of
art classes, the frequency table of attitude towards art classes was obtained. From the results,
most of the students (10%) rate their attitudes at 4.5 on a scale of 1 to 7.
The difference in interest in life drawing classes based on the exposure levels was investigated
using the ANOVA test. The results obtained indicated that the significant value is less than the
standard level of significance (0.05). Statistically speaking, the evidence is sufficient to
conclude that there was a difference in interest in life drawing classes by the level of exposure.
How the gender of the participant was related to the most preferred type of classes was
investigated using the Analysis of variance (ANOVA) test. ANOVA test investigates whether
there exists any significant difference in the mean values of the difference. The findings are
recorded in a table shown below. These results clearly show that the significance value is 0.163,
a value which is less than the significance value. In conclusion, it is statistically correct to
conclude that these variables have no significant difference in their means.
⊘ This is a preview!⊘
Do you want full access?
Subscribe today to unlock all pages.
Trusted by 1+ million students worldwide
4
Contents
Methodology.............................................................................................................................................5
Results.......................................................................................................................................................5
Conclusion and Recommendations..........................................................................................................12
References...............................................................................................................................................13
Appendix: relevant output from statistical analysis software packages...................................................14
-
Paraphrase This Document
Need a fresh take? Get an instant paraphrase of this document with our AI Paraphraser
5
Methodology
The research question was aimed at investigating the attendance patterns of arts events by
university students in the city of Melbourne. The results demonstrated that the majority of
university students do not often attend art classes. The other research question was to
investigate the difference in the rate of attendance of by gender. The difference was investigated
by cross tabulations. Also, the research investigated how the age of participants was related to
their rate of attendance. This relationship was investigated by evaluating the correlation
analysis.
The attitude of the participants towards events and their levels of interest towards different
types of art classes was investigated by obtaining the frequency table of attitude towards art
classes overall. The difference in interest in life drawing classes by the level of exposure was
investigated using the ANOVA test. An Analysis of variance (ANOVA) test was carried out to
investigate how gender and the most preferred type of classes were related.
Results
Research Objective 1: To investigate the attendance rate arts events in Melbourne among
university students
RQ1: How many university students in Melbourne attend arts events within a given
period, say one day?
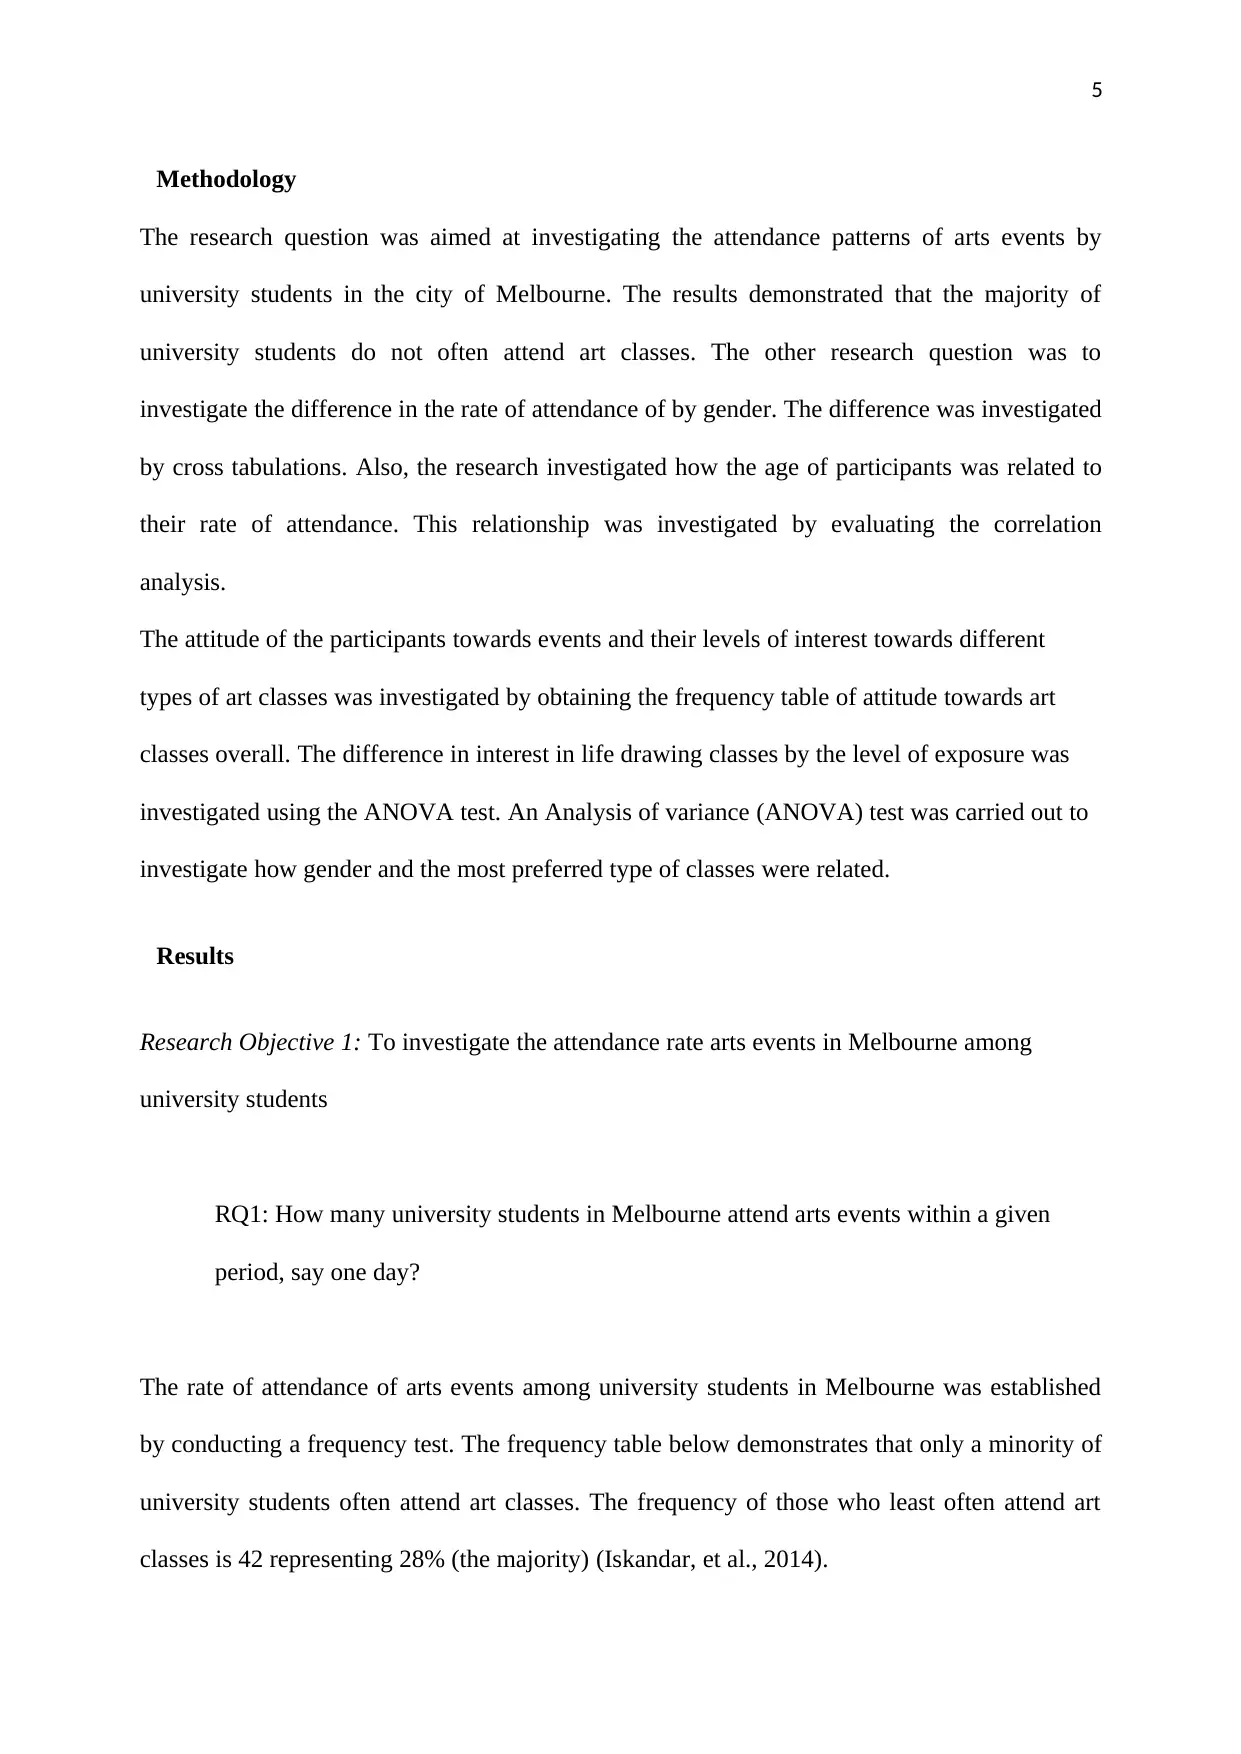
The rate of attendance of arts events among university students in Melbourne was established
by conducting a frequency test. The frequency table below demonstrates that only a minority of
university students often attend art classes. The frequency of those who least often attend art
classes is 42 representing 28% (the majority) (Iskandar, et al., 2014).
Methodology
The research question was aimed at investigating the attendance patterns of arts events by
university students in the city of Melbourne. The results demonstrated that the majority of
university students do not often attend art classes. The other research question was to
investigate the difference in the rate of attendance of by gender. The difference was investigated
by cross tabulations. Also, the research investigated how the age of participants was related to
their rate of attendance. This relationship was investigated by evaluating the correlation
analysis.
The attitude of the participants towards events and their levels of interest towards different
types of art classes was investigated by obtaining the frequency table of attitude towards art
classes overall. The difference in interest in life drawing classes by the level of exposure was
investigated using the ANOVA test. An Analysis of variance (ANOVA) test was carried out to
investigate how gender and the most preferred type of classes were related.
Results
Research Objective 1: To investigate the attendance rate arts events in Melbourne among
university students
RQ1: How many university students in Melbourne attend arts events within a given
period, say one day?
The rate of attendance of arts events among university students in Melbourne was established
by conducting a frequency test. The frequency table below demonstrates that only a minority of
university students often attend art classes. The frequency of those who least often attend art
classes is 42 representing 28% (the majority) (Iskandar, et al., 2014).
6
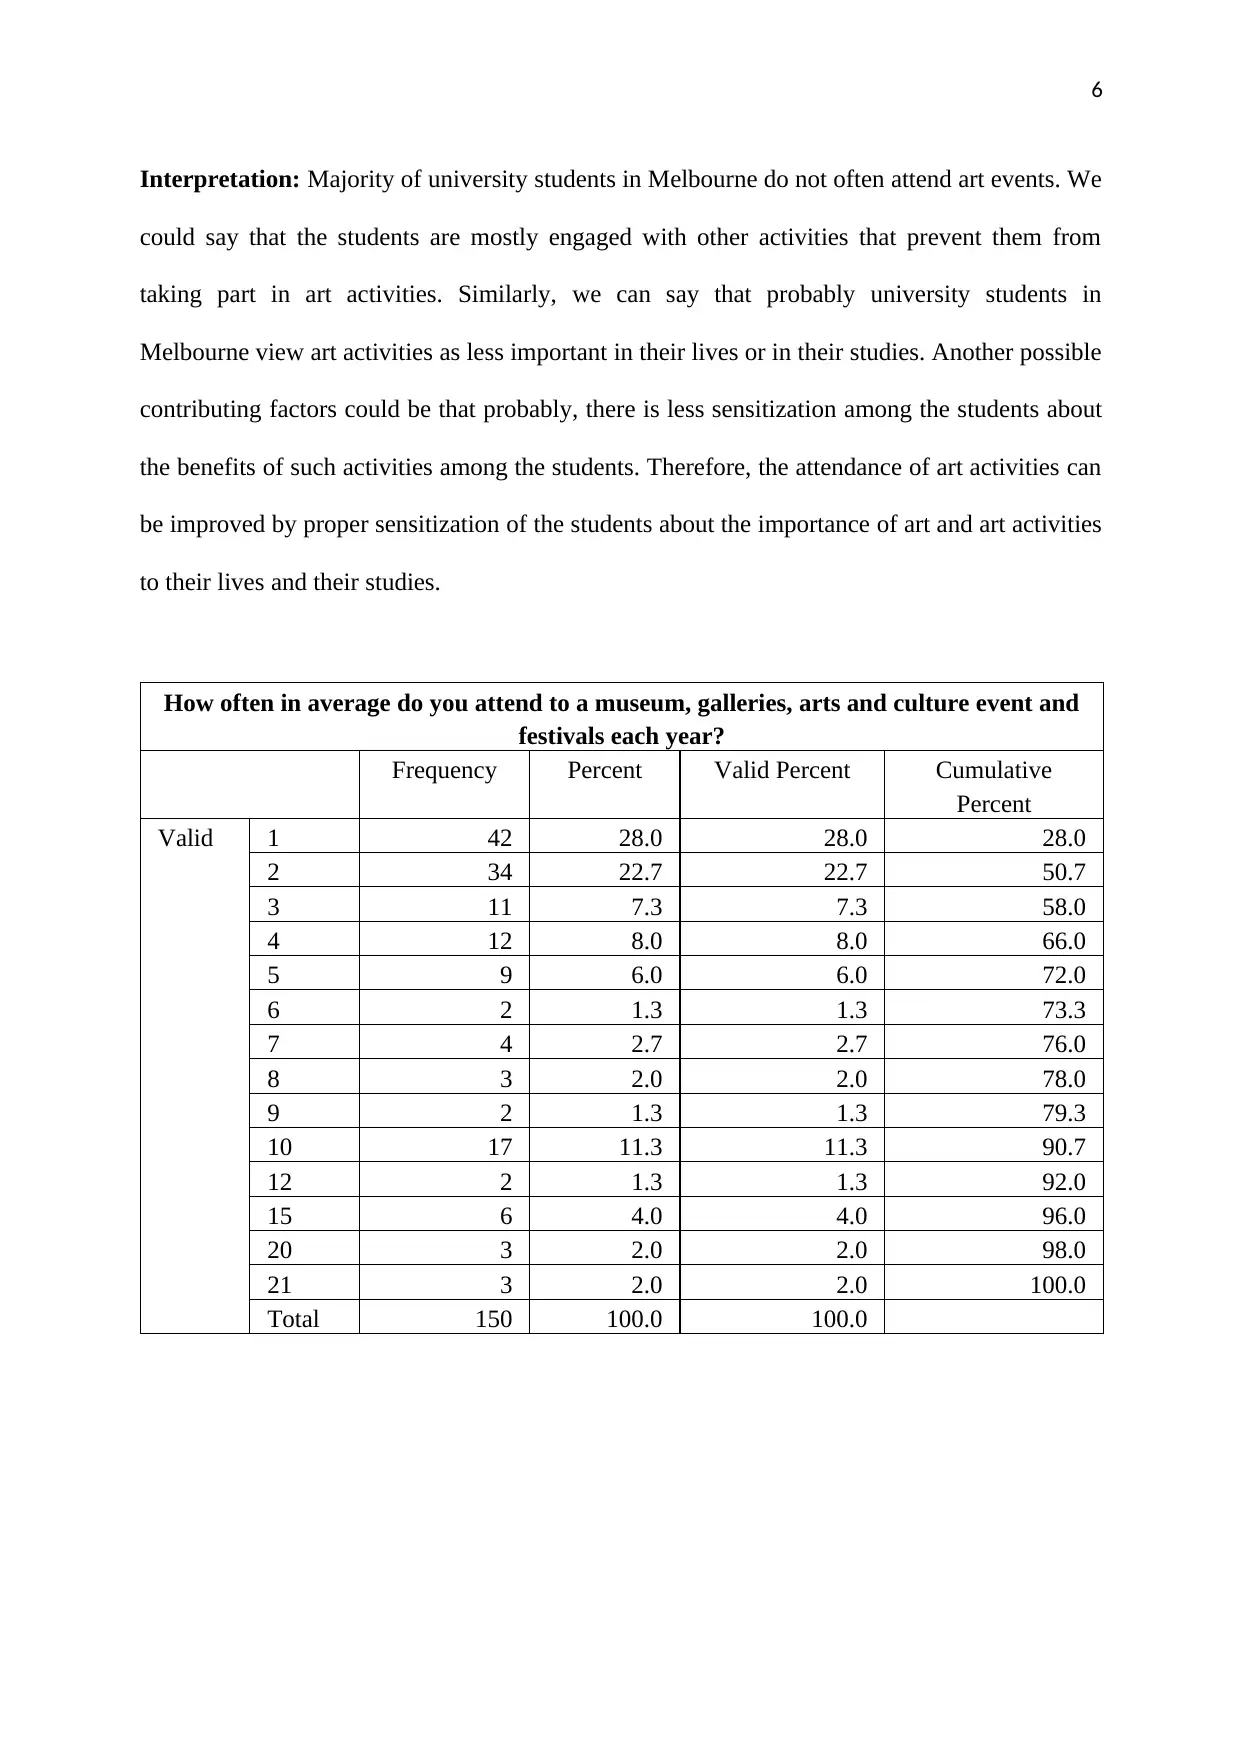
Interpretation: Majority of university students in Melbourne do not often attend art events. We
could say that the students are mostly engaged with other activities that prevent them from
taking part in art activities. Similarly, we can say that probably university students in
Melbourne view art activities as less important in their lives or in their studies. Another possible
contributing factors could be that probably, there is less sensitization among the students about
the benefits of such activities among the students. Therefore, the attendance of art activities can
be improved by proper sensitization of the students about the importance of art and art activities
to their lives and their studies.
How often in average do you attend to a museum, galleries, arts and culture event and
festivals each year?
Frequency Percent Valid Percent Cumulative
Percent
Valid 1 42 28.0 28.0 28.0
2 34 22.7 22.7 50.7
3 11 7.3 7.3 58.0
4 12 8.0 8.0 66.0
5 9 6.0 6.0 72.0
6 2 1.3 1.3 73.3
7 4 2.7 2.7 76.0
8 3 2.0 2.0 78.0
9 2 1.3 1.3 79.3
10 17 11.3 11.3 90.7
12 2 1.3 1.3 92.0
15 6 4.0 4.0 96.0
20 3 2.0 2.0 98.0
21 3 2.0 2.0 100.0
Total 150 100.0 100.0
⊘ This is a preview!⊘
Do you want full access?
Subscribe today to unlock all pages.
Trusted by 1+ million students worldwide
7
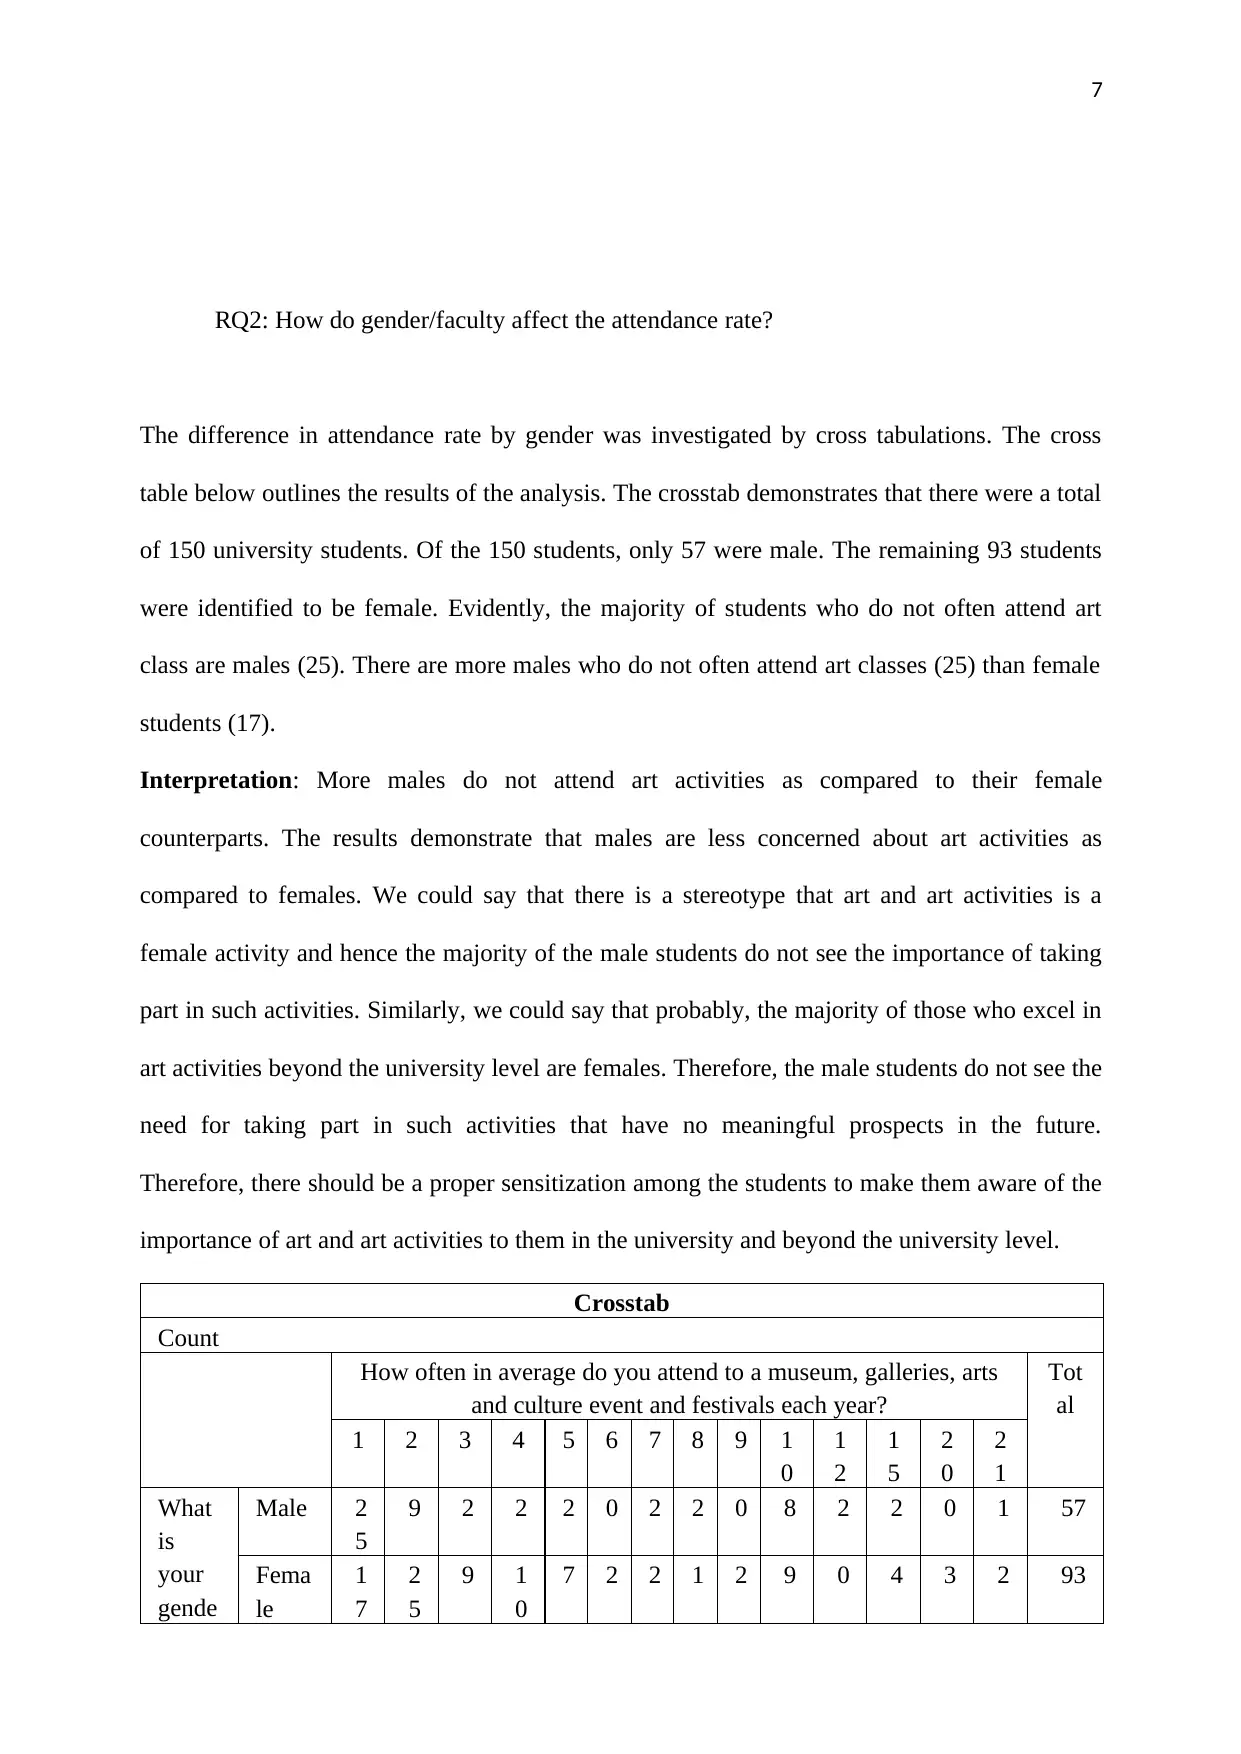
RQ2: How do gender/faculty affect the attendance rate?
The difference in attendance rate by gender was investigated by cross tabulations. The cross
table below outlines the results of the analysis. The crosstab demonstrates that there were a total
of 150 university students. Of the 150 students, only 57 were male. The remaining 93 students
were identified to be female. Evidently, the majority of students who do not often attend art
class are males (25). There are more males who do not often attend art classes (25) than female
students (17).
Interpretation: More males do not attend art activities as compared to their female
counterparts. The results demonstrate that males are less concerned about art activities as
compared to females. We could say that there is a stereotype that art and art activities is a
female activity and hence the majority of the male students do not see the importance of taking
part in such activities. Similarly, we could say that probably, the majority of those who excel in
art activities beyond the university level are females. Therefore, the male students do not see the
need for taking part in such activities that have no meaningful prospects in the future.
Therefore, there should be a proper sensitization among the students to make them aware of the
importance of art and art activities to them in the university and beyond the university level.
Crosstab
Count
How often in average do you attend to a museum, galleries, arts
and culture event and festivals each year?
Tot
al
1 2 3 4 5 6 7 8 9 1
0
1
2
1
5
2
0
2
1
What
is
your
gende
Male 2
5
9 2 2 2 0 2 2 0 8 2 2 0 1 57
Fema
le
1
7
2
5
9 1
0
7 2 2 1 2 9 0 4 3 2 93
Paraphrase This Document
Need a fresh take? Get an instant paraphrase of this document with our AI Paraphraser
8
r?
Total 4
2
3
4
1
1
1
2
9 2 4 3 2 1
7
2 6 3 3 150
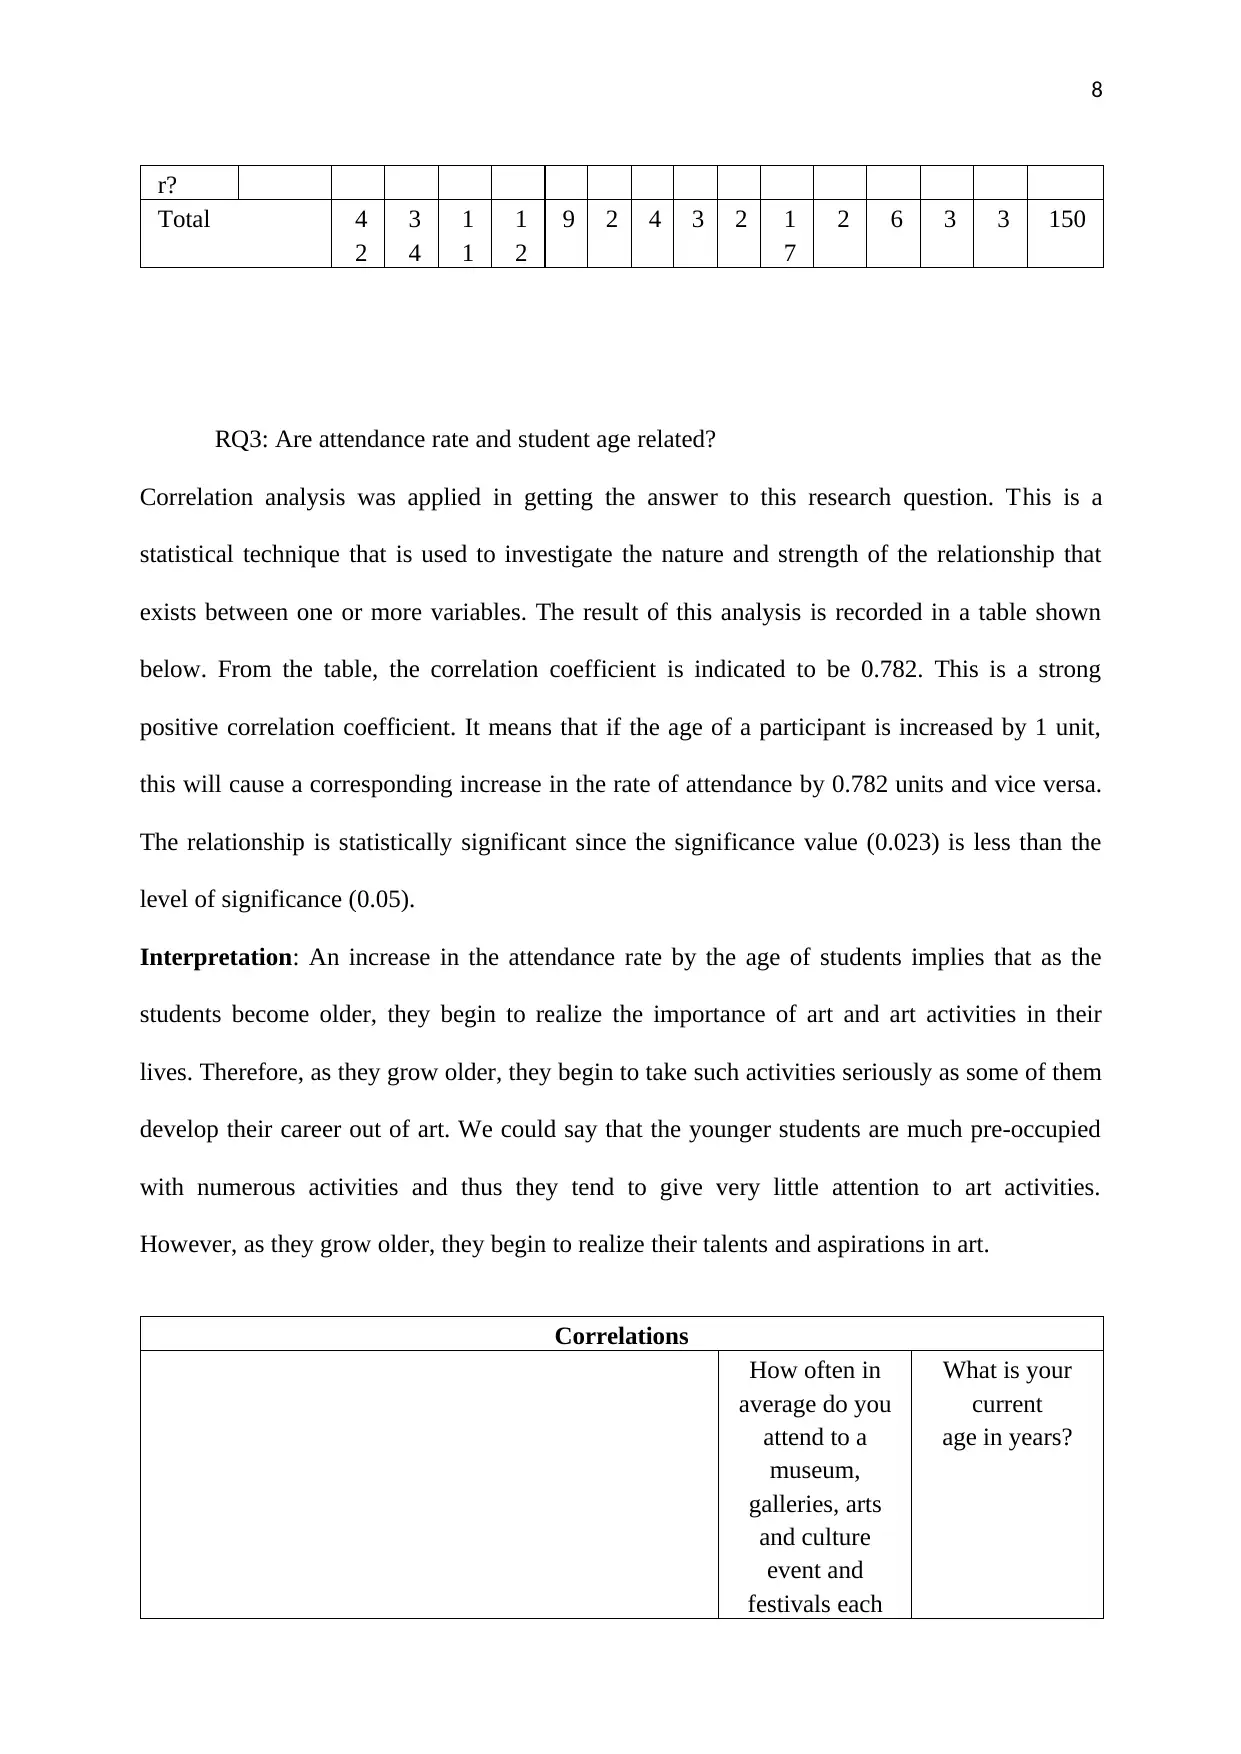
RQ3: Are attendance rate and student age related?
Correlation analysis was applied in getting the answer to this research question. This is a
statistical technique that is used to investigate the nature and strength of the relationship that
exists between one or more variables. The result of this analysis is recorded in a table shown
below. From the table, the correlation coefficient is indicated to be 0.782. This is a strong
positive correlation coefficient. It means that if the age of a participant is increased by 1 unit,
this will cause a corresponding increase in the rate of attendance by 0.782 units and vice versa.
The relationship is statistically significant since the significance value (0.023) is less than the
level of significance (0.05).
Interpretation: An increase in the attendance rate by the age of students implies that as the
students become older, they begin to realize the importance of art and art activities in their
lives. Therefore, as they grow older, they begin to take such activities seriously as some of them
develop their career out of art. We could say that the younger students are much pre-occupied
with numerous activities and thus they tend to give very little attention to art activities.
However, as they grow older, they begin to realize their talents and aspirations in art.
Correlations
How often in
average do you
attend to a
museum,
galleries, arts
and culture
event and
festivals each
What is your
current
age in years?
r?
Total 4
2
3
4
1
1
1
2
9 2 4 3 2 1
7
2 6 3 3 150
RQ3: Are attendance rate and student age related?
Correlation analysis was applied in getting the answer to this research question. This is a
statistical technique that is used to investigate the nature and strength of the relationship that
exists between one or more variables. The result of this analysis is recorded in a table shown
below. From the table, the correlation coefficient is indicated to be 0.782. This is a strong
positive correlation coefficient. It means that if the age of a participant is increased by 1 unit,
this will cause a corresponding increase in the rate of attendance by 0.782 units and vice versa.
The relationship is statistically significant since the significance value (0.023) is less than the
level of significance (0.05).
Interpretation: An increase in the attendance rate by the age of students implies that as the
students become older, they begin to realize the importance of art and art activities in their
lives. Therefore, as they grow older, they begin to take such activities seriously as some of them
develop their career out of art. We could say that the younger students are much pre-occupied
with numerous activities and thus they tend to give very little attention to art activities.
However, as they grow older, they begin to realize their talents and aspirations in art.
Correlations
How often in
average do you
attend to a
museum,
galleries, arts
and culture
event and
festivals each
What is your
current
age in years?
9
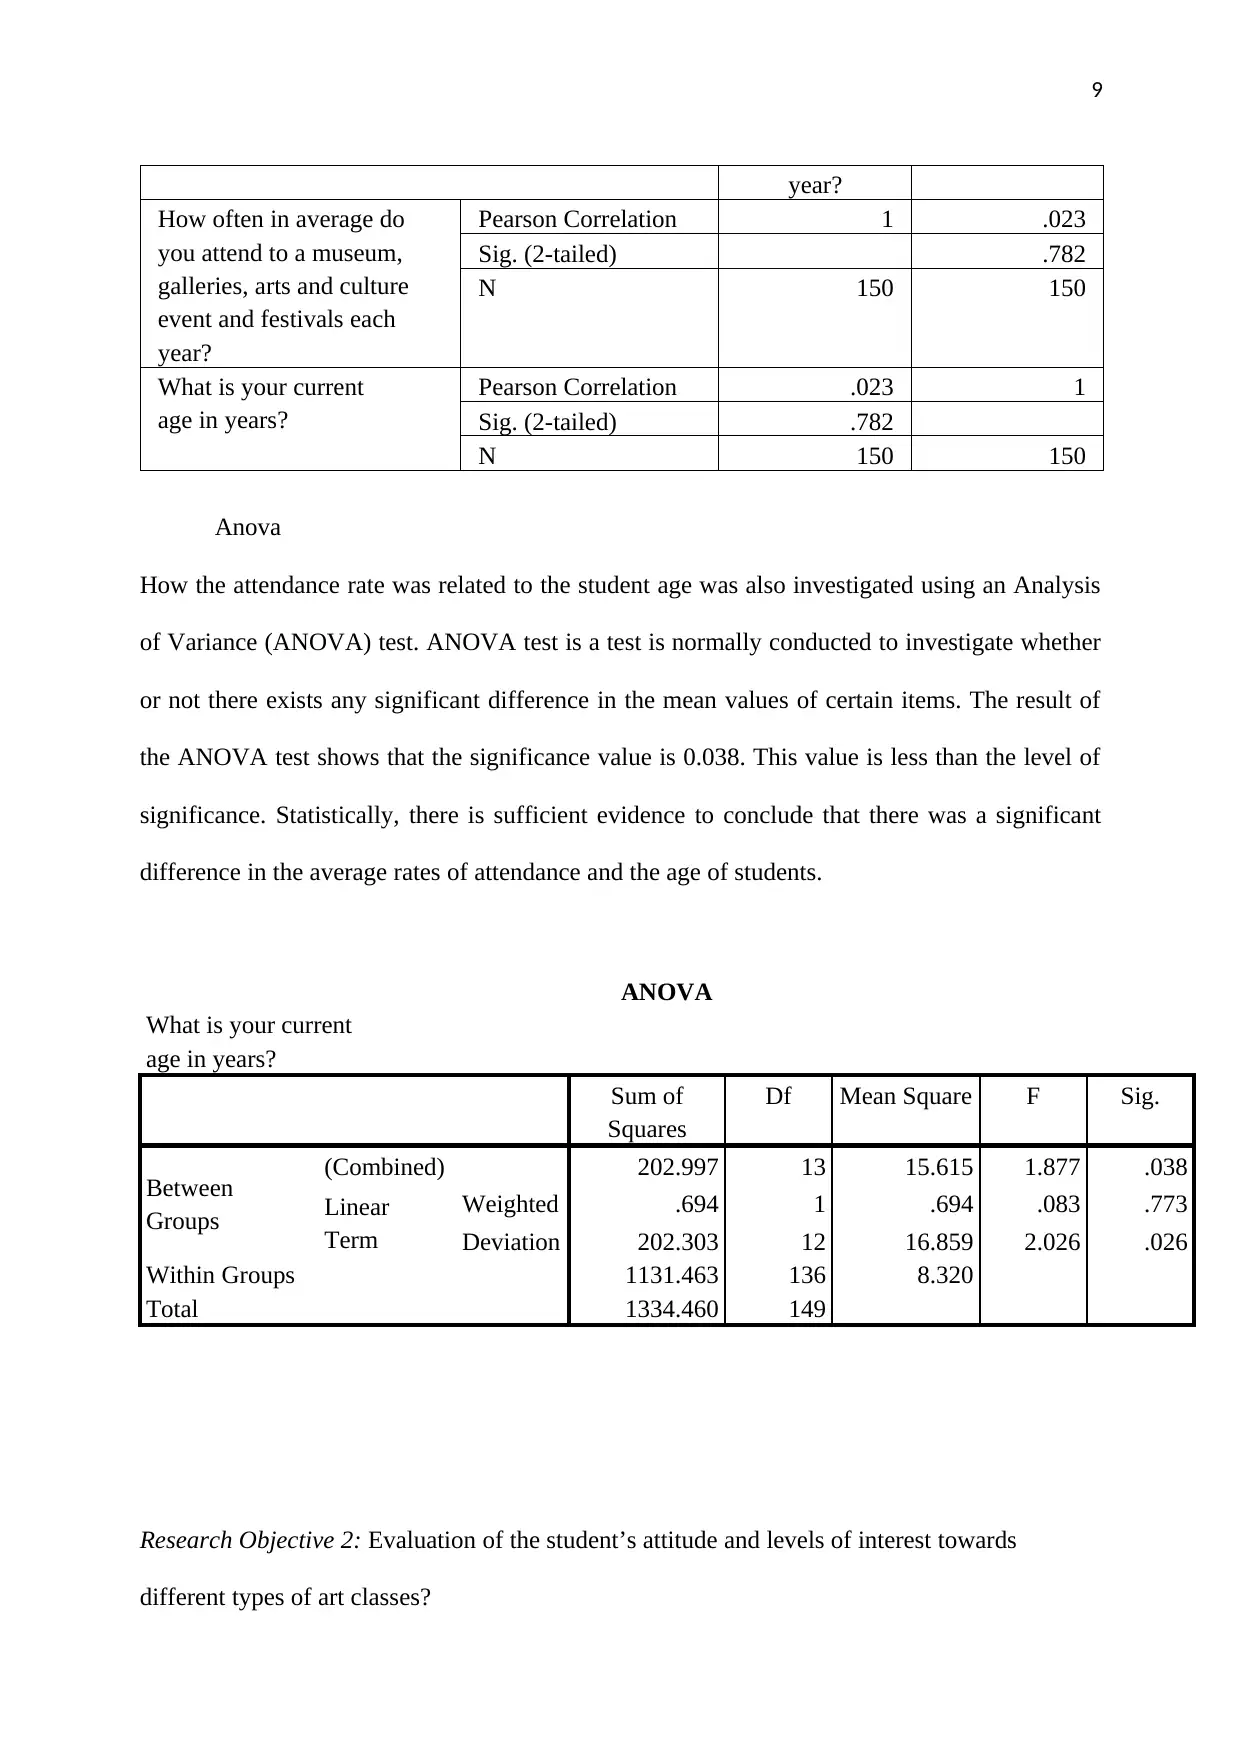
year?
How often in average do
you attend to a museum,
galleries, arts and culture
event and festivals each
year?
Pearson Correlation 1 .023
Sig. (2-tailed) .782
N 150 150
What is your current
age in years?
Pearson Correlation .023 1
Sig. (2-tailed) .782
N 150 150
Anova
How the attendance rate was related to the student age was also investigated using an Analysis
of Variance (ANOVA) test. ANOVA test is a test is normally conducted to investigate whether
or not there exists any significant difference in the mean values of certain items. The result of
the ANOVA test shows that the significance value is 0.038. This value is less than the level of
significance. Statistically, there is sufficient evidence to conclude that there was a significant
difference in the average rates of attendance and the age of students.
ANOVA
What is your current
age in years?
Sum of
Squares
Df Mean Square F Sig.
Between
Groups
(Combined) 202.997 13 15.615 1.877 .038
Linear
Term
Weighted .694 1 .694 .083 .773
Deviation 202.303 12 16.859 2.026 .026
Within Groups 1131.463 136 8.320
Total 1334.460 149
Research Objective 2: Evaluation of the student’s attitude and levels of interest towards
different types of art classes?
year?
How often in average do
you attend to a museum,
galleries, arts and culture
event and festivals each
year?
Pearson Correlation 1 .023
Sig. (2-tailed) .782
N 150 150
What is your current
age in years?
Pearson Correlation .023 1
Sig. (2-tailed) .782
N 150 150
Anova
How the attendance rate was related to the student age was also investigated using an Analysis
of Variance (ANOVA) test. ANOVA test is a test is normally conducted to investigate whether
or not there exists any significant difference in the mean values of certain items. The result of
the ANOVA test shows that the significance value is 0.038. This value is less than the level of
significance. Statistically, there is sufficient evidence to conclude that there was a significant
difference in the average rates of attendance and the age of students.
ANOVA
What is your current
age in years?
Sum of
Squares
Df Mean Square F Sig.
Between
Groups
(Combined) 202.997 13 15.615 1.877 .038
Linear
Term
Weighted .694 1 .694 .083 .773
Deviation 202.303 12 16.859 2.026 .026
Within Groups 1131.463 136 8.320
Total 1334.460 149
Research Objective 2: Evaluation of the student’s attitude and levels of interest towards
different types of art classes?
⊘ This is a preview!⊘
Do you want full access?
Subscribe today to unlock all pages.
Trusted by 1+ million students worldwide
10
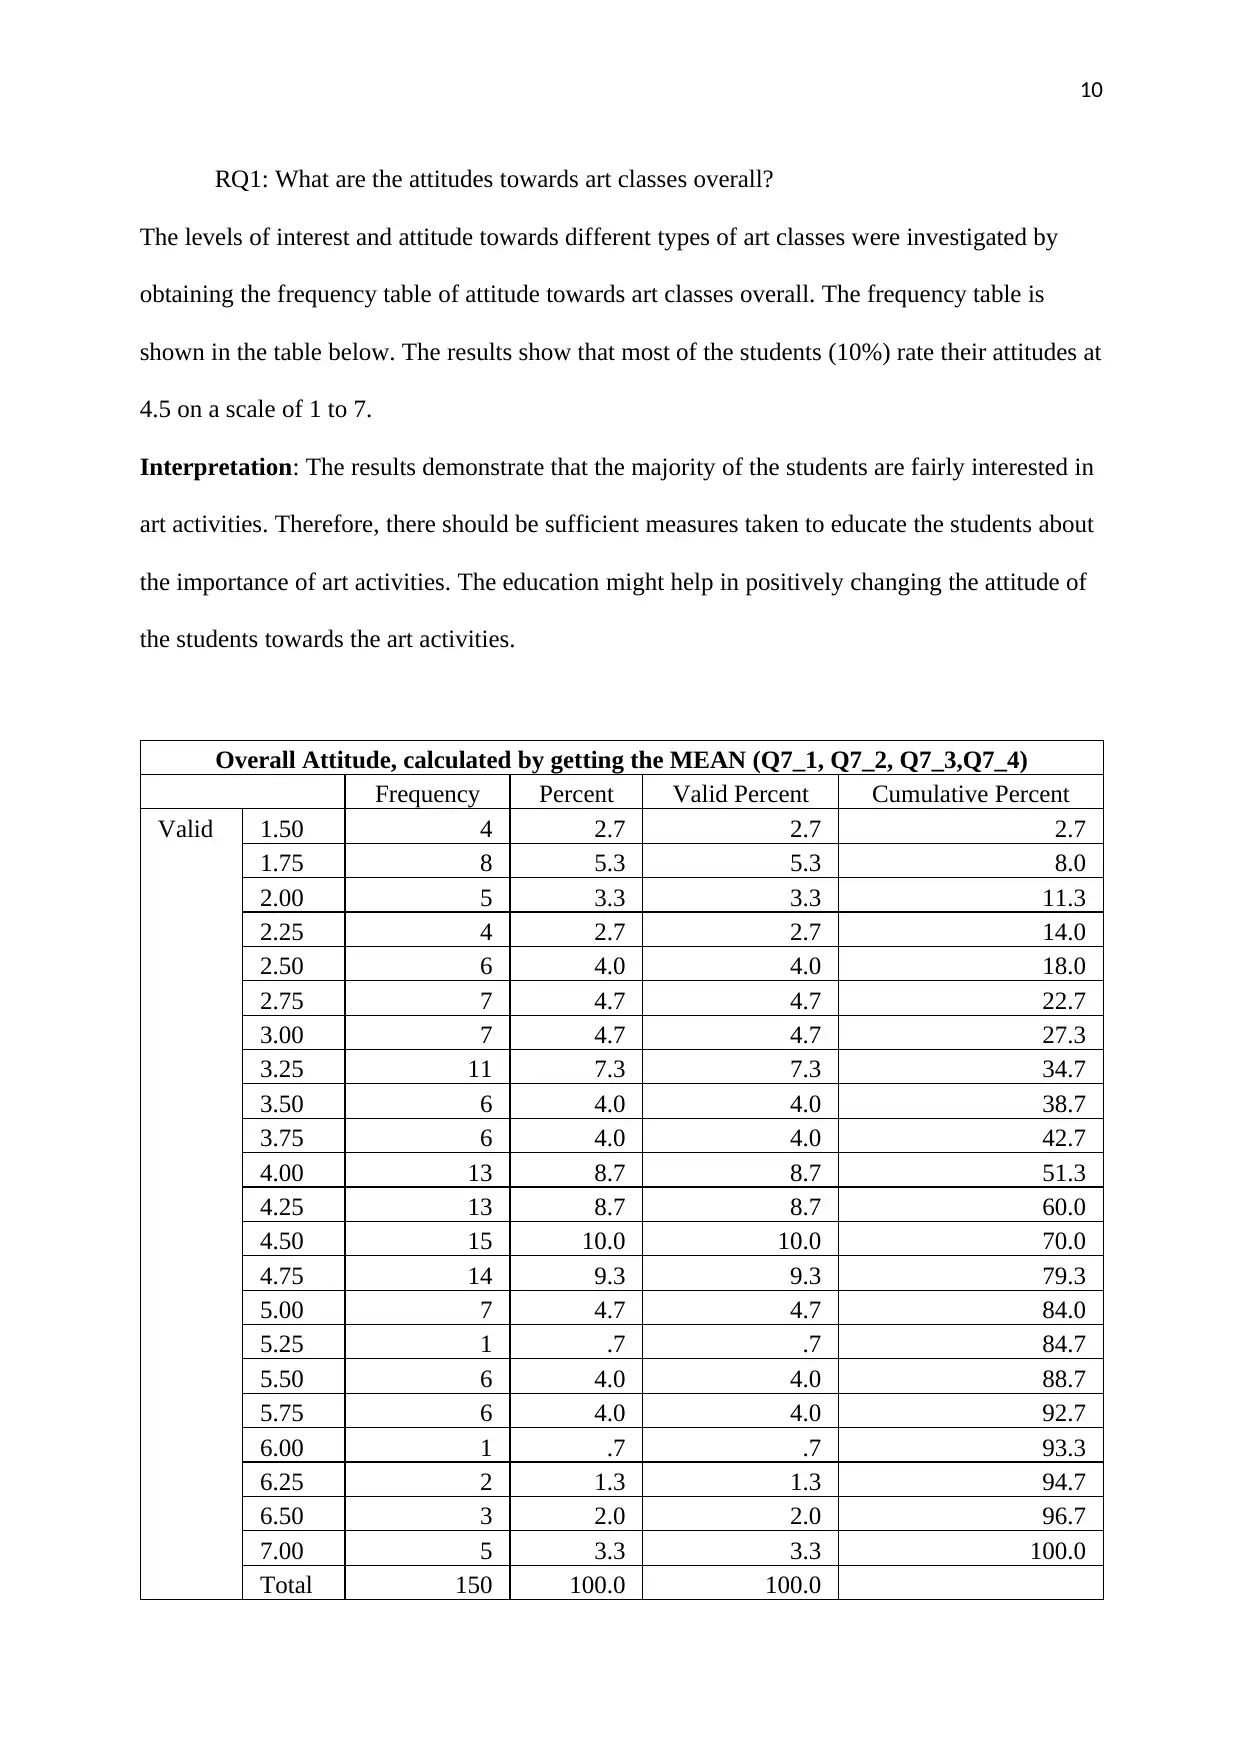
RQ1: What are the attitudes towards art classes overall?
The levels of interest and attitude towards different types of art classes were investigated by
obtaining the frequency table of attitude towards art classes overall. The frequency table is
shown in the table below. The results show that most of the students (10%) rate their attitudes at
4.5 on a scale of 1 to 7.
Interpretation: The results demonstrate that the majority of the students are fairly interested in
art activities. Therefore, there should be sufficient measures taken to educate the students about
the importance of art activities. The education might help in positively changing the attitude of
the students towards the art activities.
Overall Attitude, calculated by getting the MEAN (Q7_1, Q7_2, Q7_3,Q7_4)
Frequency Percent Valid Percent Cumulative Percent
Valid 1.50 4 2.7 2.7 2.7
1.75 8 5.3 5.3 8.0
2.00 5 3.3 3.3 11.3
2.25 4 2.7 2.7 14.0
2.50 6 4.0 4.0 18.0
2.75 7 4.7 4.7 22.7
3.00 7 4.7 4.7 27.3
3.25 11 7.3 7.3 34.7
3.50 6 4.0 4.0 38.7
3.75 6 4.0 4.0 42.7
4.00 13 8.7 8.7 51.3
4.25 13 8.7 8.7 60.0
4.50 15 10.0 10.0 70.0
4.75 14 9.3 9.3 79.3
5.00 7 4.7 4.7 84.0
5.25 1 .7 .7 84.7
5.50 6 4.0 4.0 88.7
5.75 6 4.0 4.0 92.7
6.00 1 .7 .7 93.3
6.25 2 1.3 1.3 94.7
6.50 3 2.0 2.0 96.7
7.00 5 3.3 3.3 100.0
Total 150 100.0 100.0
Paraphrase This Document
Need a fresh take? Get an instant paraphrase of this document with our AI Paraphraser
11
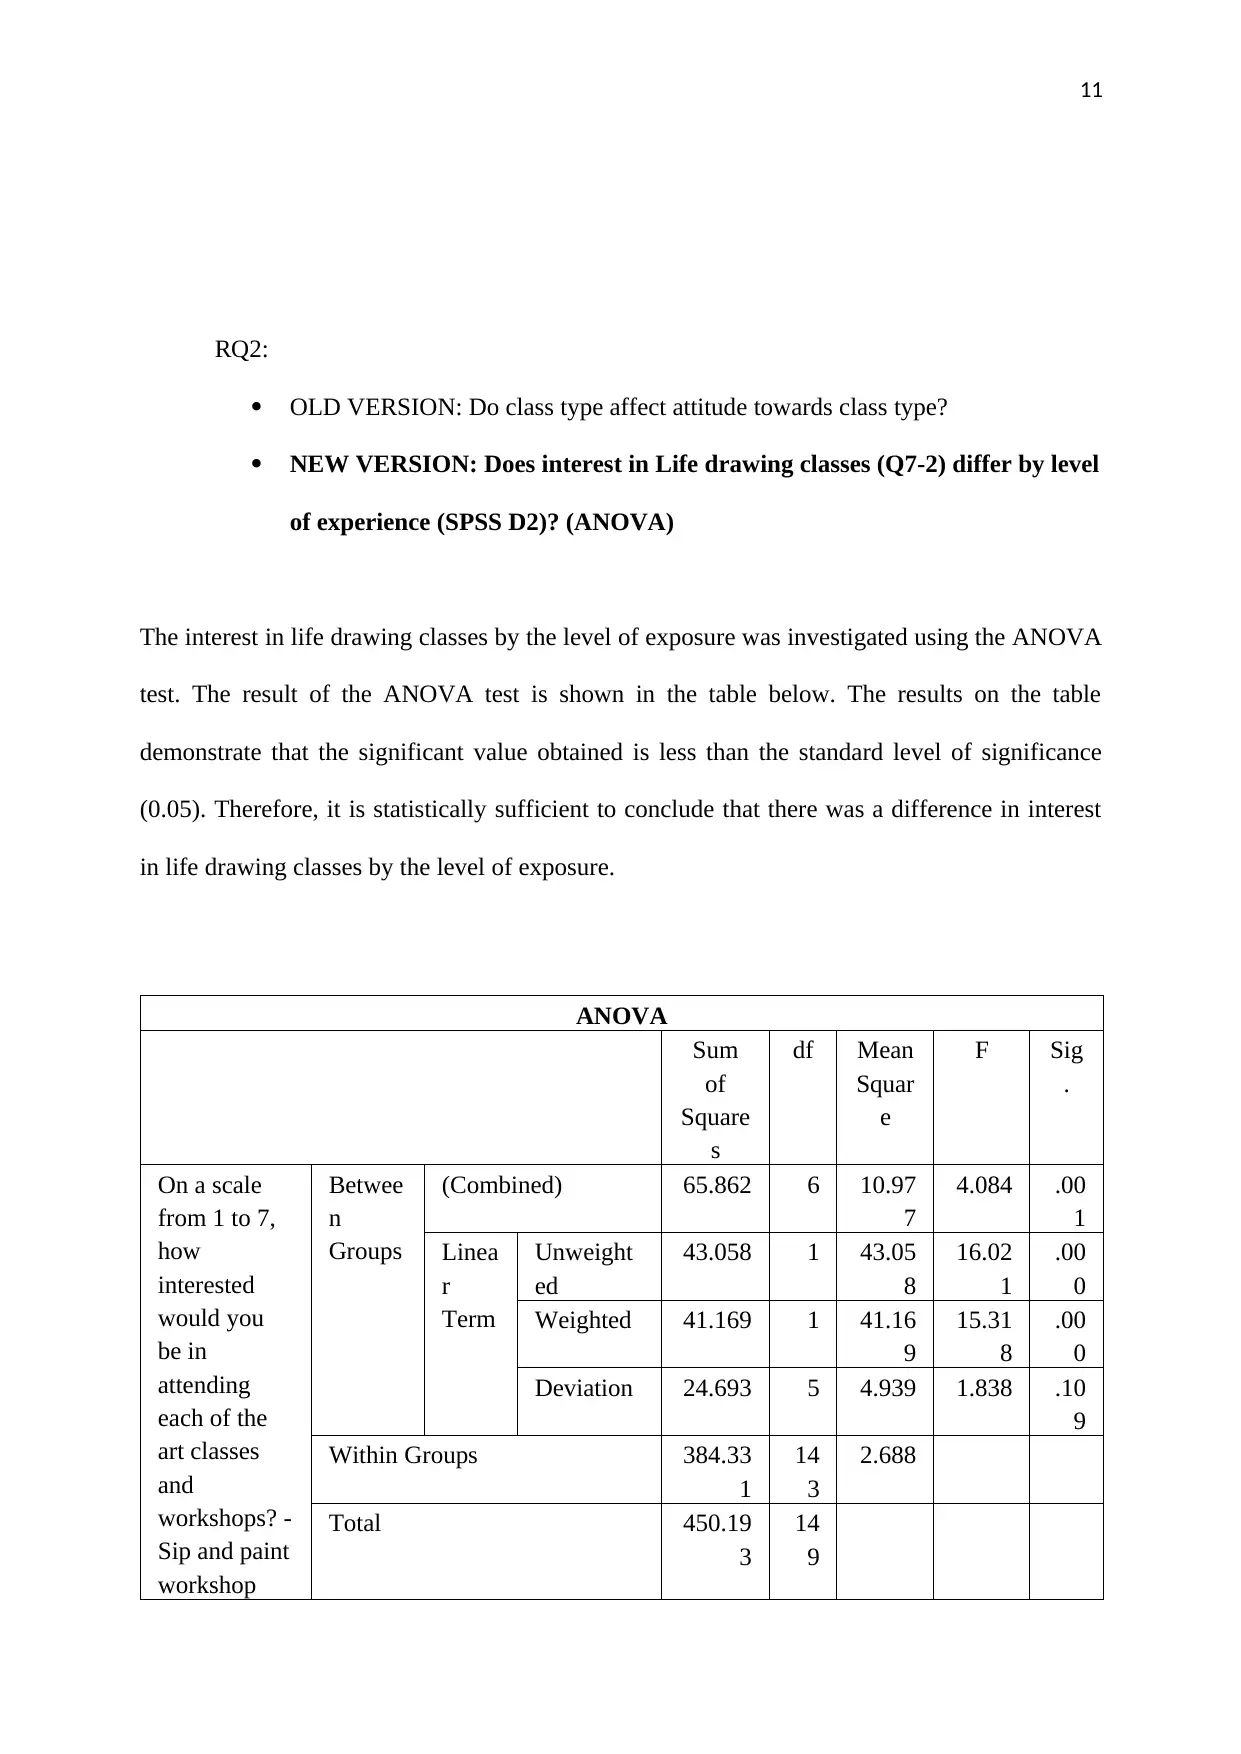
RQ2:
OLD VERSION: Do class type affect attitude towards class type?
NEW VERSION: Does interest in Life drawing classes (Q7-2) differ by level
of experience (SPSS D2)? (ANOVA)
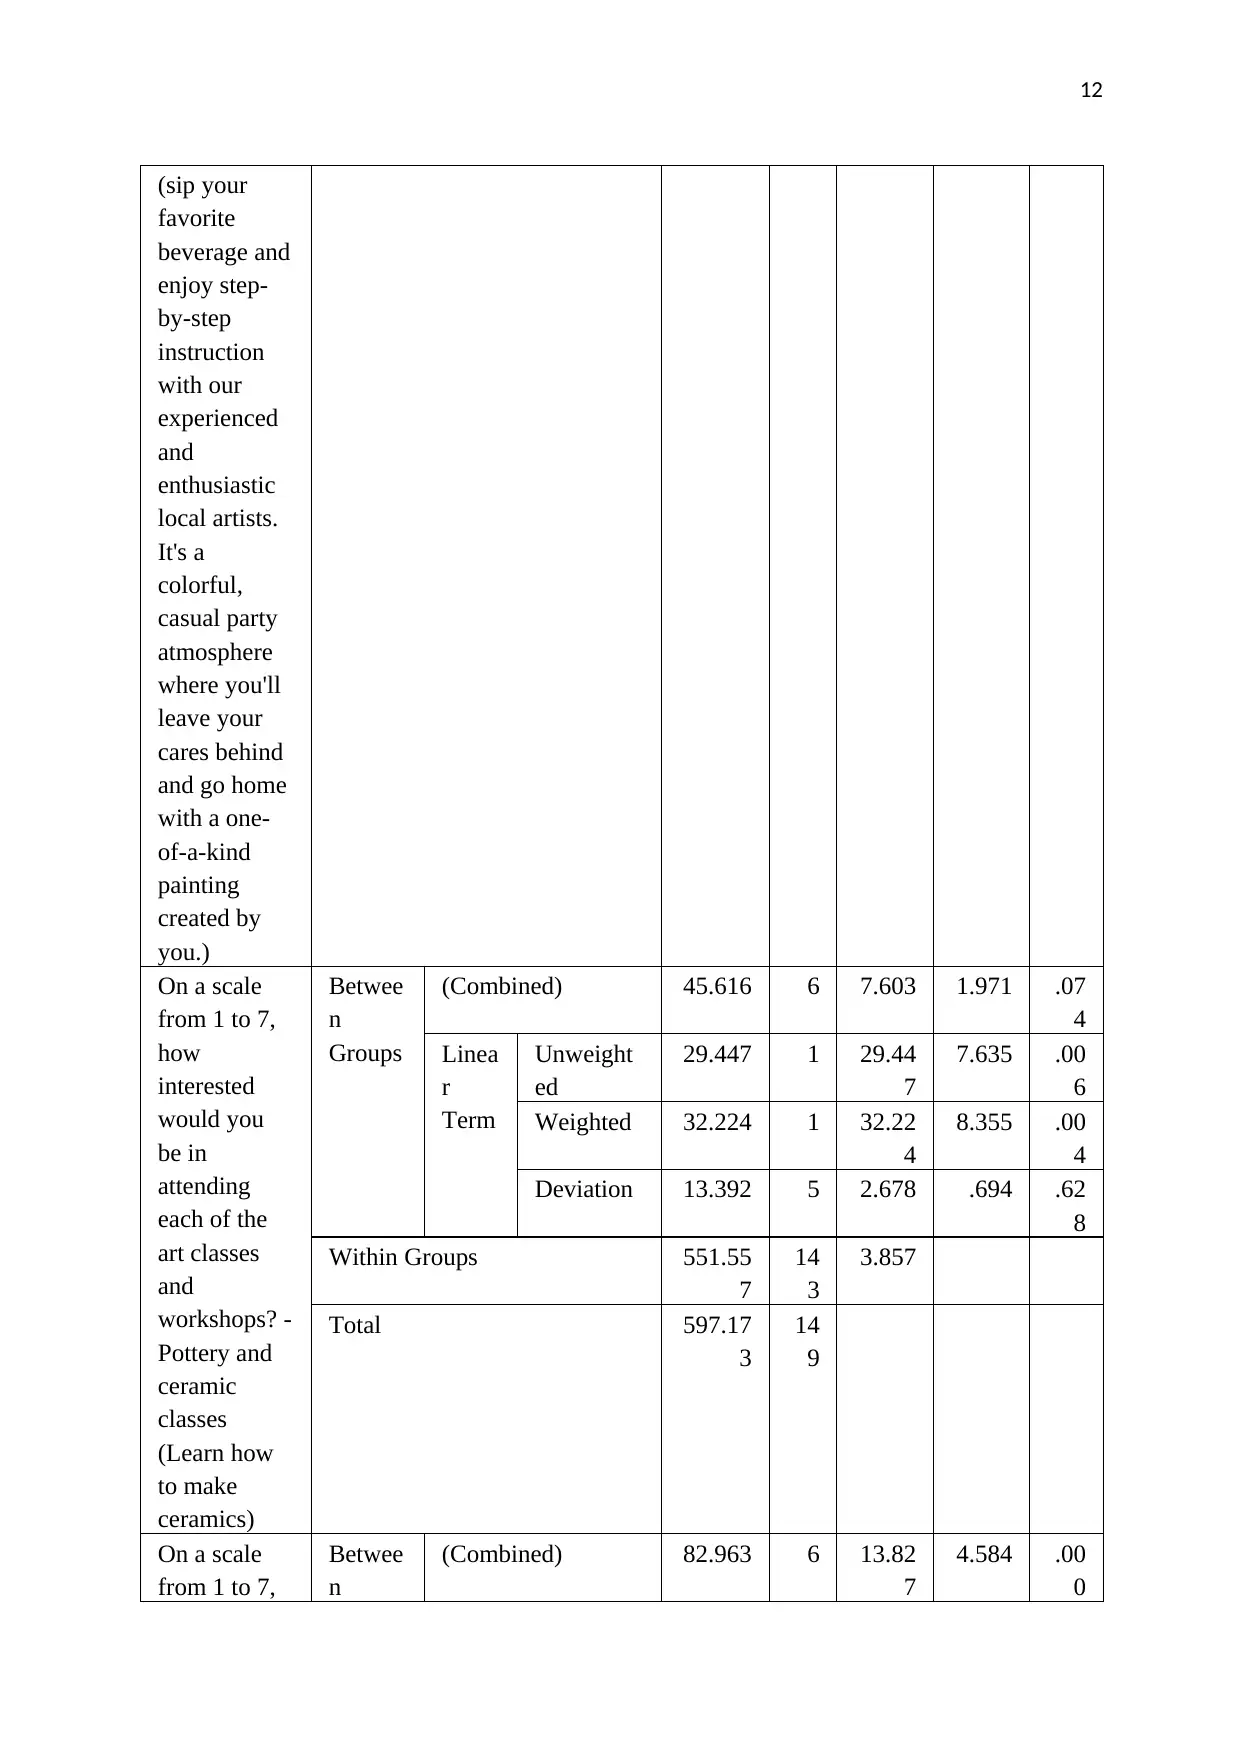
The interest in life drawing classes by the level of exposure was investigated using the ANOVA
test. The result of the ANOVA test is shown in the table below. The results on the table
demonstrate that the significant value obtained is less than the standard level of significance
(0.05). Therefore, it is statistically sufficient to conclude that there was a difference in interest
in life drawing classes by the level of exposure.
ANOVA
Sum
of
Square
s
df Mean
Squar
e
F Sig
.
On a scale
from 1 to 7,
how
interested
would you
be in
attending
each of the
art classes
and
workshops? -
Sip and paint
workshop
Betwee
n
Groups
(Combined) 65.862 6 10.97
7
4.084 .00
1
Linea
r
Term
Unweight
ed
43.058 1 43.05
8
16.02
1
.00
0
Weighted 41.169 1 41.16
9
15.31
8
.00
0
Deviation 24.693 5 4.939 1.838 .10
9
Within Groups 384.33
1
14
3
2.688
Total 450.19
3
14
9
RQ2:
OLD VERSION: Do class type affect attitude towards class type?
NEW VERSION: Does interest in Life drawing classes (Q7-2) differ by level
of experience (SPSS D2)? (ANOVA)
The interest in life drawing classes by the level of exposure was investigated using the ANOVA
test. The result of the ANOVA test is shown in the table below. The results on the table
demonstrate that the significant value obtained is less than the standard level of significance
(0.05). Therefore, it is statistically sufficient to conclude that there was a difference in interest
in life drawing classes by the level of exposure.
ANOVA
Sum
of
Square
s
df Mean
Squar
e
F Sig
.
On a scale
from 1 to 7,
how
interested
would you
be in
attending
each of the
art classes
and
workshops? -
Sip and paint
workshop
Betwee
n
Groups
(Combined) 65.862 6 10.97
7
4.084 .00
1
Linea
r
Term
Unweight
ed
43.058 1 43.05
8
16.02
1
.00
0
Weighted 41.169 1 41.16
9
15.31
8
.00
0
Deviation 24.693 5 4.939 1.838 .10
9
Within Groups 384.33
1
14
3
2.688
Total 450.19
3
14
9
12
(sip your
favorite
beverage and
enjoy step-
by-step
instruction
with our
experienced
and
enthusiastic
local artists.
It's a
colorful,
casual party
atmosphere
where you'll
leave your
cares behind
and go home
with a one-
of-a-kind
painting
created by
you.)
On a scale
from 1 to 7,
how
interested
would you
be in
attending
each of the
art classes
and
workshops? -
Pottery and
ceramic
classes
(Learn how
to make
ceramics)
Betwee
n
Groups
(Combined) 45.616 6 7.603 1.971 .07
4
Linea
r
Term
Unweight
ed
29.447 1 29.44
7
7.635 .00
6
Weighted 32.224 1 32.22
4
8.355 .00
4
Deviation 13.392 5 2.678 .694 .62
8
Within Groups 551.55
7
14
3
3.857
Total 597.17
3
14
9
On a scale
from 1 to 7,
Betwee
n
(Combined) 82.963 6 13.82
7
4.584 .00
0
⊘ This is a preview!⊘
Do you want full access?
Subscribe today to unlock all pages.
Trusted by 1+ million students worldwide
1 out of 23
Related Documents

![Statistics Assignment 2: SPSS Analysis and Report - [University Name]](/_next/image/?url=https%3A%2F%2Fdesklib.com%2Fmedia%2Fimages%2Fin%2F8784072a20714d2aa647583645940fe0.jpg&w=256&q=75)


Your All-in-One AI-Powered Toolkit for Academic Success.
+13062052269
info@desklib.com
Available 24*7 on WhatsApp / Email
![[object Object]](/_next/static/media/star-bottom.7253800d.svg)
Unlock your academic potential
Copyright © 2020–2026 A2Z Services. All Rights Reserved. Developed and managed by ZUCOL.