Land Surveying and Analysis Report: EXT Buildings 28, 29, & 30 Area
VerifiedAdded on 2023/06/11
|21
|4302
|238
Report
AI Summary
This engineering survey report provides a detailed description of the land surrounding EXT Buildings 28, 29, and 30, achieved through a comprehensive survey procedure using a total station. The report outlines the theory behind elevation identification using leveling experiments and rod readings, and details the methodology involving equipment checks, benchmark identification, and data recording. Calculations for reduced levels, angle and distance measurements, and error adjustments are presented, including the use of horizontal and vertical measurements between Temporary Bench Marks (TBMs) and error correction methods. The report includes tables of recorded values, calculations for average traverse lengths, and adjusted angle computations, concluding with the determination of distances, associated errors, and corrected coordinates, offering a thorough analysis of the surveyed area.
Running head: ENGINEERING SURVEY
Engineering Survey
Name
Institution
Engineering Survey
Name
Institution
Paraphrase This Document
Need a fresh take? Get an instant paraphrase of this document with our AI Paraphraser
ENGINEERING SURVEY 2
Engineering Project Survey
Introduction
In engineering. surveying plays the important role of helping experts to identify the different
distances. elavations. and angles that specific pieces of land where the projects are to done on.
allowing for the accurate design of these projects. This report details an accurate description of
the land situated around the EXT BUILDING 28. EXT BUILDING 29. and BUIDLING 30
through a survey procedure using a total station. The results of these procedures will be utilized
for purpose of producing a contoured and detailed survey of the area marked by these buildings.
Theory
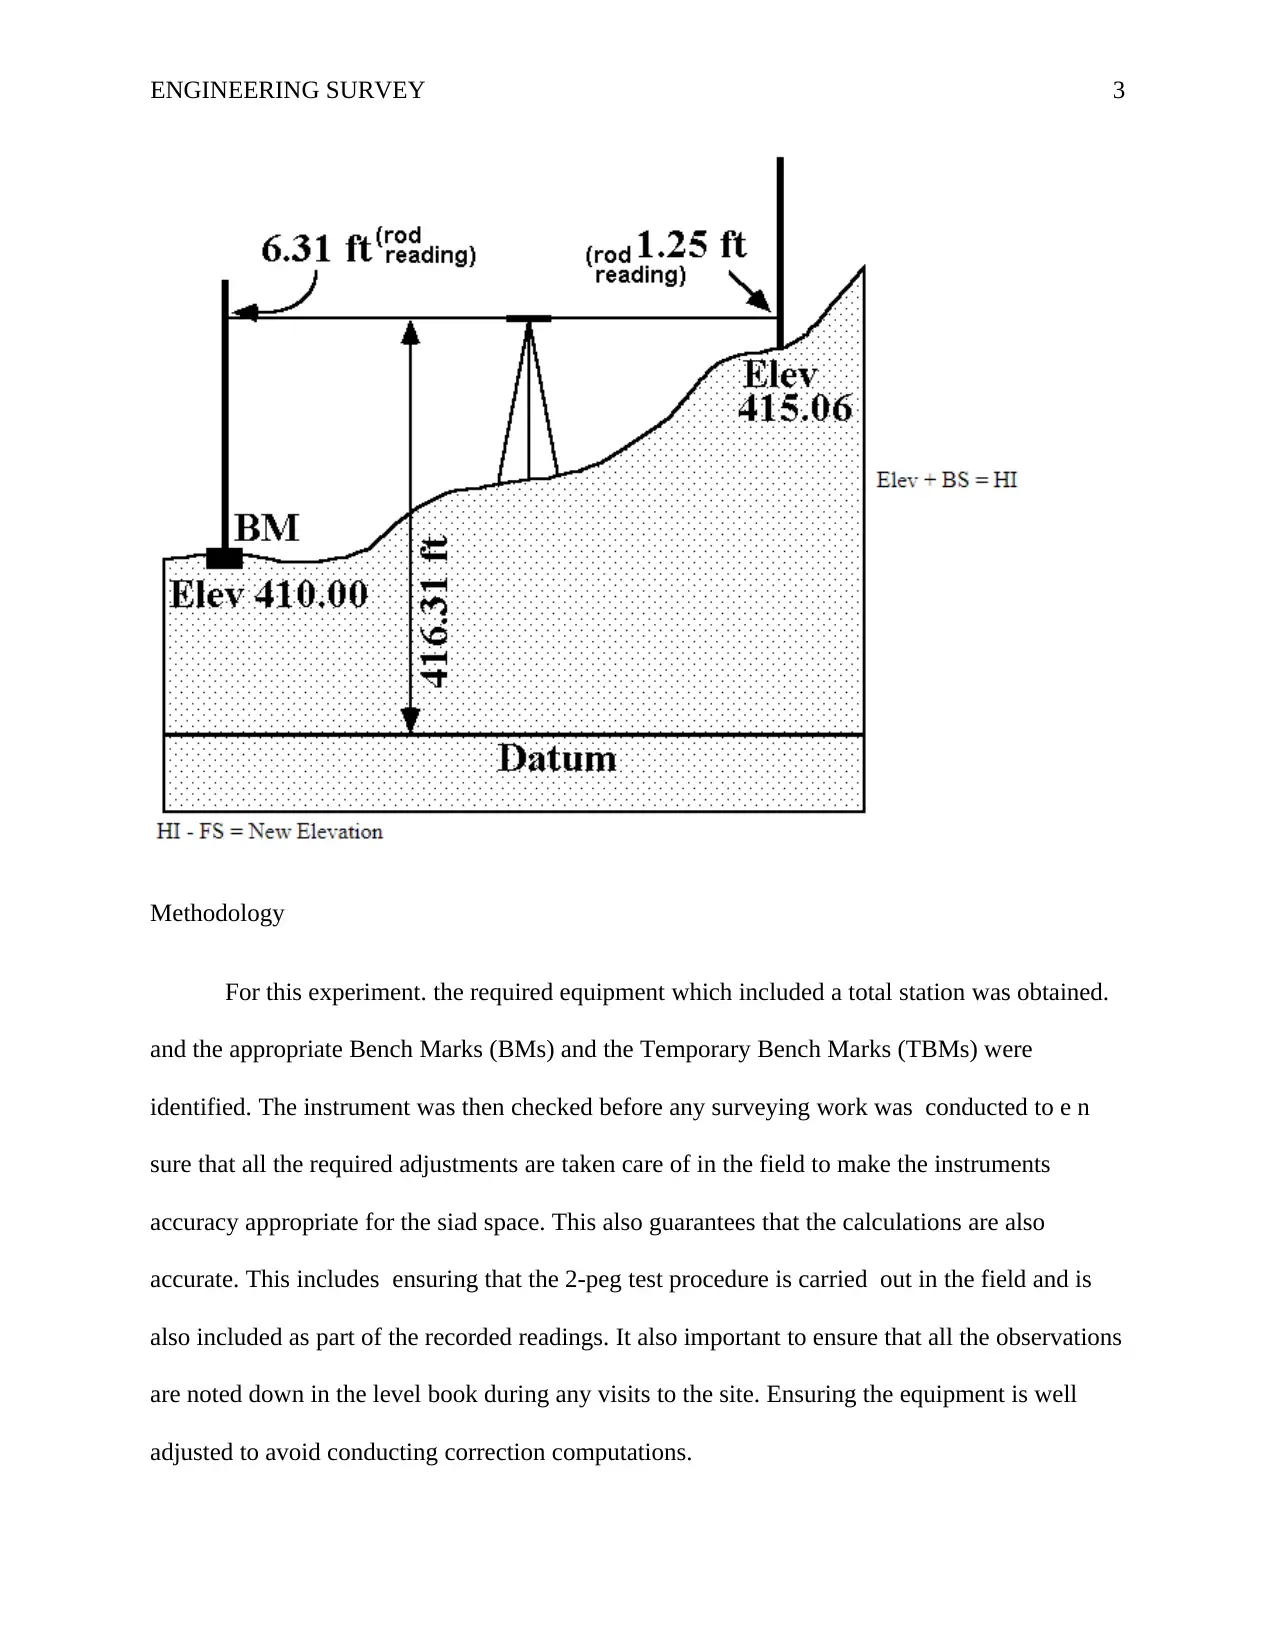
The elevations are identified through a levelling experiment where the elevation of a known
point also refered to as the benchmark is utilized itogether with the readings read on a leveling
rod. There are two types of rod readings, namely the subtract rod readings (FS) and the (BS)
which are called the subtract rod readings. Manipulation of these points in reference to a known
elevation point known as a benchmark enable surveyors to establish the elavations of unknown
points from the line of sight. This is demontrated in the following schematic.
Engineering Project Survey
Introduction
In engineering. surveying plays the important role of helping experts to identify the different
distances. elavations. and angles that specific pieces of land where the projects are to done on.
allowing for the accurate design of these projects. This report details an accurate description of
the land situated around the EXT BUILDING 28. EXT BUILDING 29. and BUIDLING 30
through a survey procedure using a total station. The results of these procedures will be utilized
for purpose of producing a contoured and detailed survey of the area marked by these buildings.
Theory
The elevations are identified through a levelling experiment where the elevation of a known
point also refered to as the benchmark is utilized itogether with the readings read on a leveling
rod. There are two types of rod readings, namely the subtract rod readings (FS) and the (BS)
which are called the subtract rod readings. Manipulation of these points in reference to a known
elevation point known as a benchmark enable surveyors to establish the elavations of unknown
points from the line of sight. This is demontrated in the following schematic.
ENGINEERING SURVEY 3
Methodology
For this experiment. the required equipment which included a total station was obtained.
and the appropriate Bench Marks (BMs) and the Temporary Bench Marks (TBMs) were
identified. The instrument was then checked before any surveying work was conducted to e n
sure that all the required adjustments are taken care of in the field to make the instruments
accuracy appropriate for the siad space. This also guarantees that the calculations are also
accurate. This includes ensuring that the 2-peg test procedure is carried out in the field and is
also included as part of the recorded readings. It also important to ensure that all the observations
are noted down in the level book during any visits to the site. Ensuring the equipment is well
adjusted to avoid conducting correction computations.
⊘ This is a preview!⊘
Do you want full access?
Subscribe today to unlock all pages.
Trusted by 1+ million students worldwide
ENGINEERING SURVEY 4
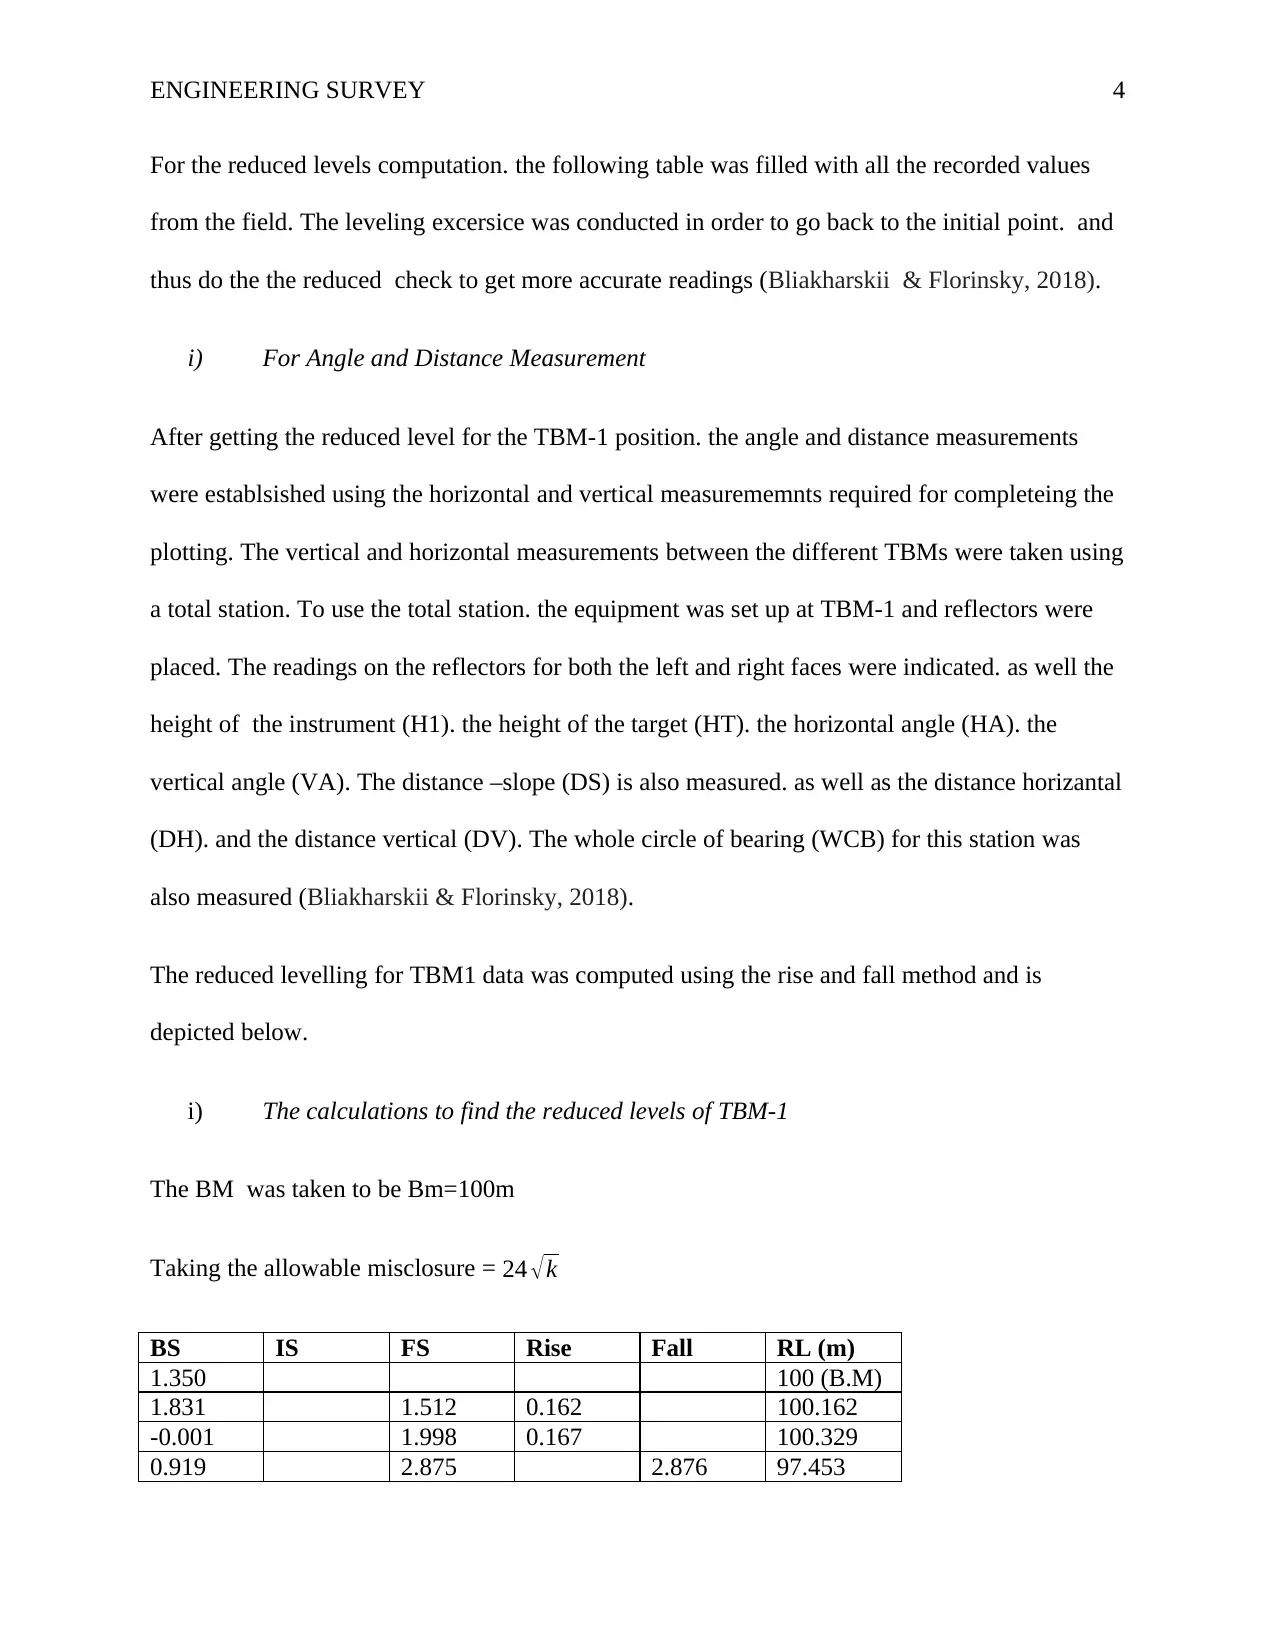
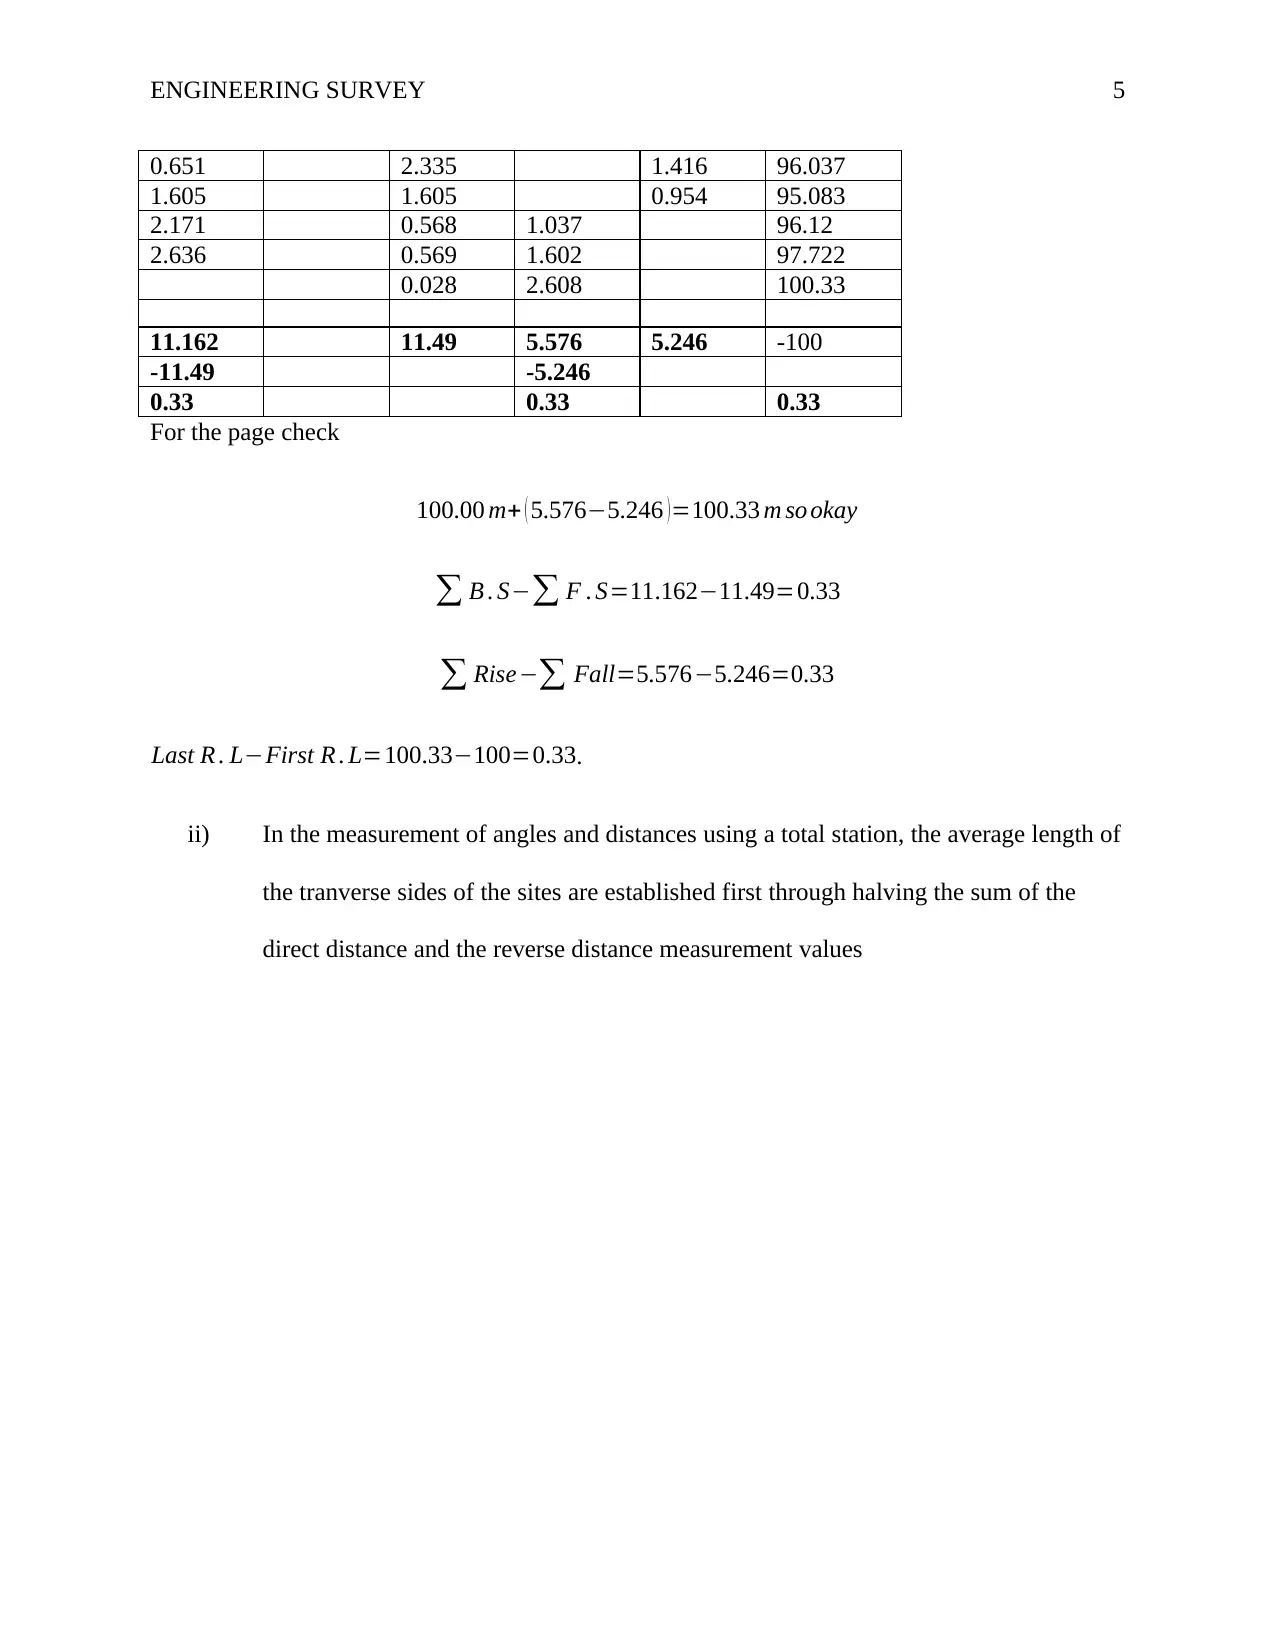
For the reduced levels computation. the following table was filled with all the recorded values
from the field. The leveling excersice was conducted in order to go back to the initial point. and
thus do the the reduced check to get more accurate readings (Bliakharskii & Florinsky, 2018).
i) For Angle and Distance Measurement
After getting the reduced level for the TBM-1 position. the angle and distance measurements
were establsished using the horizontal and vertical measurememnts required for completeing the
plotting. The vertical and horizontal measurements between the different TBMs were taken using
a total station. To use the total station. the equipment was set up at TBM-1 and reflectors were
placed. The readings on the reflectors for both the left and right faces were indicated. as well the
height of the instrument (H1). the height of the target (HT). the horizontal angle (HA). the
vertical angle (VA). The distance –slope (DS) is also measured. as well as the distance horizantal
(DH). and the distance vertical (DV). The whole circle of bearing (WCB) for this station was
also measured (Bliakharskii & Florinsky, 2018).
The reduced levelling for TBM1 data was computed using the rise and fall method and is
depicted below.
i) The calculations to find the reduced levels of TBM-1
The BM was taken to be Bm=100m
Taking the allowable misclosure = 24 √k
BS IS FS Rise Fall RL (m)
1.350 100 (B.M)
1.831 1.512 0.162 100.162
-0.001 1.998 0.167 100.329
0.919 2.875 2.876 97.453
Paraphrase This Document
Need a fresh take? Get an instant paraphrase of this document with our AI Paraphraser
ENGINEERING SURVEY 5
0.651 2.335 1.416 96.037
1.605 1.605 0.954 95.083
2.171 0.568 1.037 96.12
2.636 0.569 1.602 97.722
0.028 2.608 100.33
11.162 11.49 5.576 5.246 -100
-11.49 -5.246
0.33 0.33 0.33
For the page check
100.00 m+ ( 5.576−5.246 ) =100.33 m so okay
∑ B . S−∑ F . S=11.162−11.49=0.33
∑ Rise−∑ Fall=5.576−5.246=0.33
Last R . L−First R . L=100.33−100=0.33.
ii) In the measurement of angles and distances using a total station, the average length of
the tranverse sides of the sites are established first through halving the sum of the
direct distance and the reverse distance measurement values
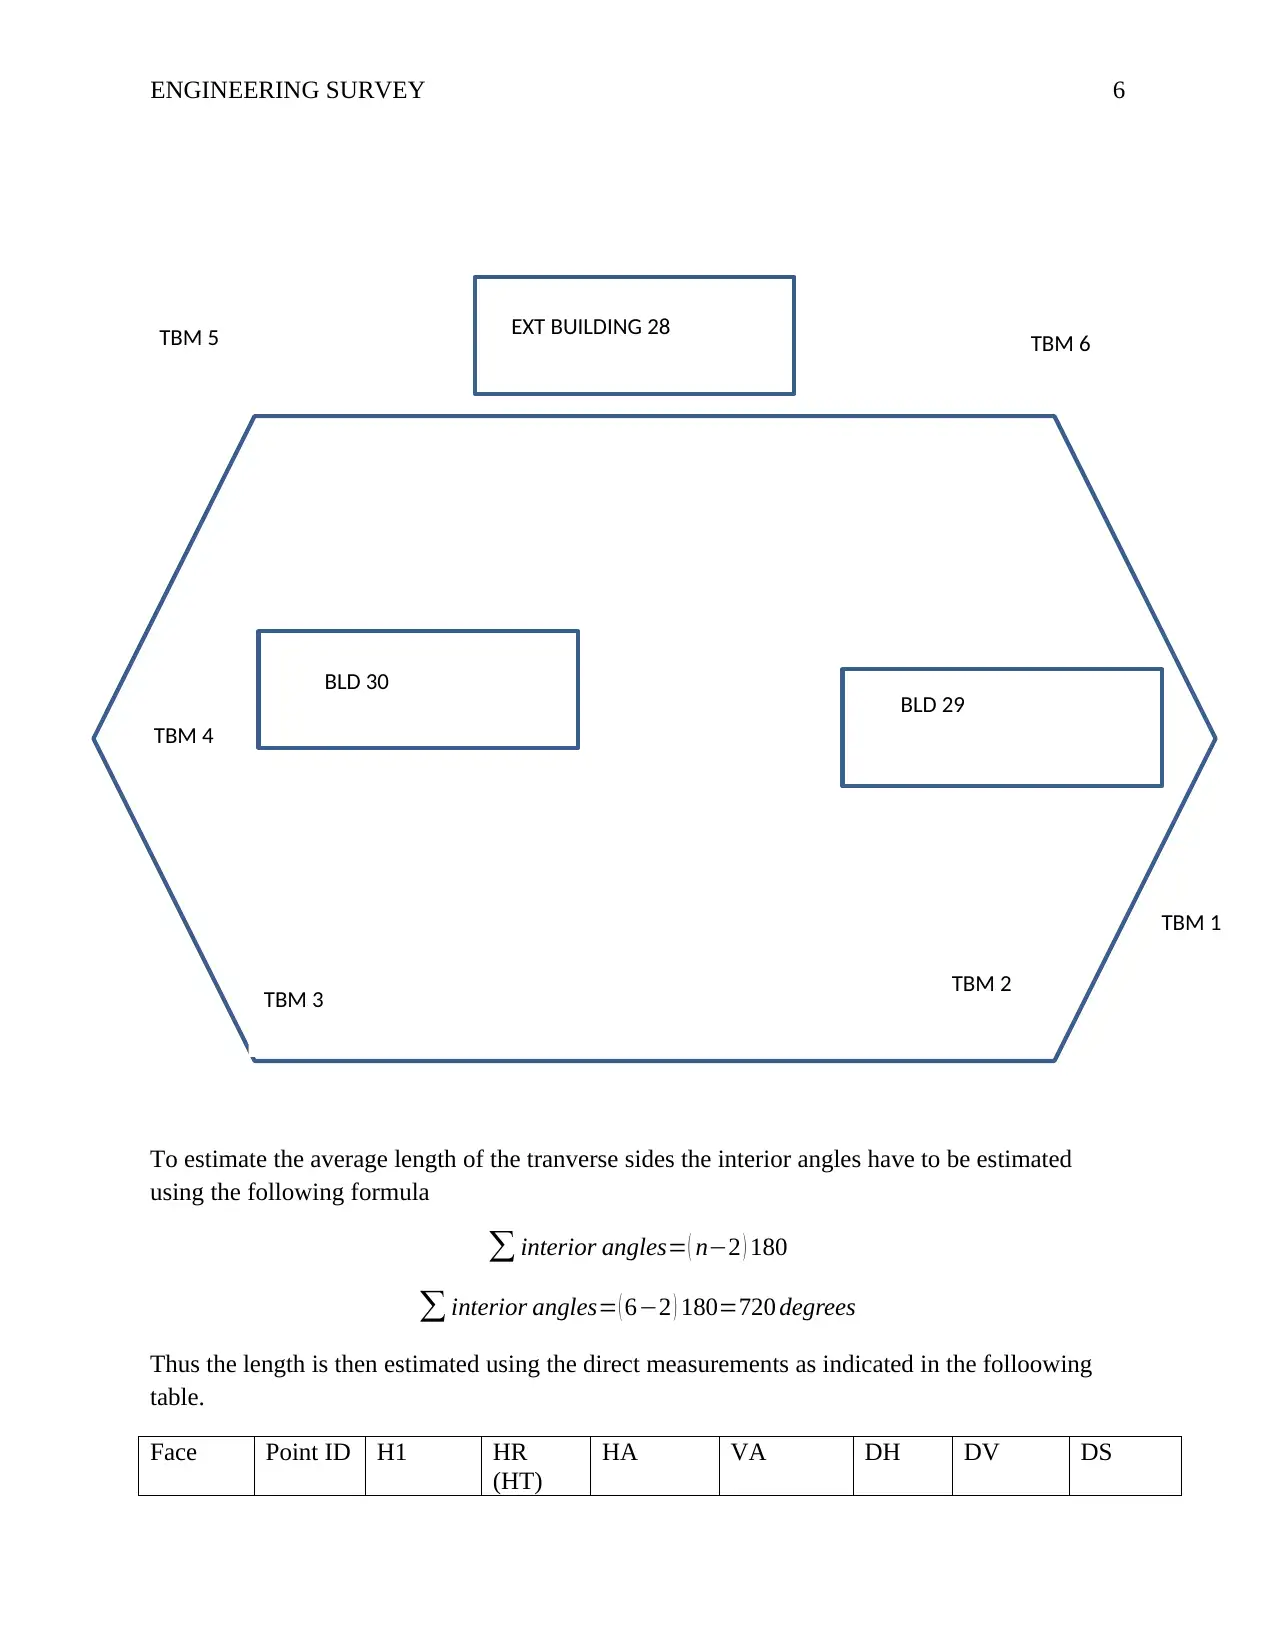
ENGINEERING SURVEY 6
To estimate the average length of the tranverse sides the interior angles have to be estimated
using the following formula
∑ interior angles= ( n−2 ) 180
∑ interior angles= ( 6−2 ) 180=720 degrees
Thus the length is then estimated using the direct measurements as indicated in the folloowing
table.
Face Point ID H1 HR
(HT)
HA VA DH DV DS
BLD 30
EXT BUILDING 28
BLD 29
TBM 5
TBM 2
TBM 3
TBM 1
TBM 6
TBM 4
⊘ This is a preview!⊘
Do you want full access?
Subscribe today to unlock all pages.
Trusted by 1+ million students worldwide
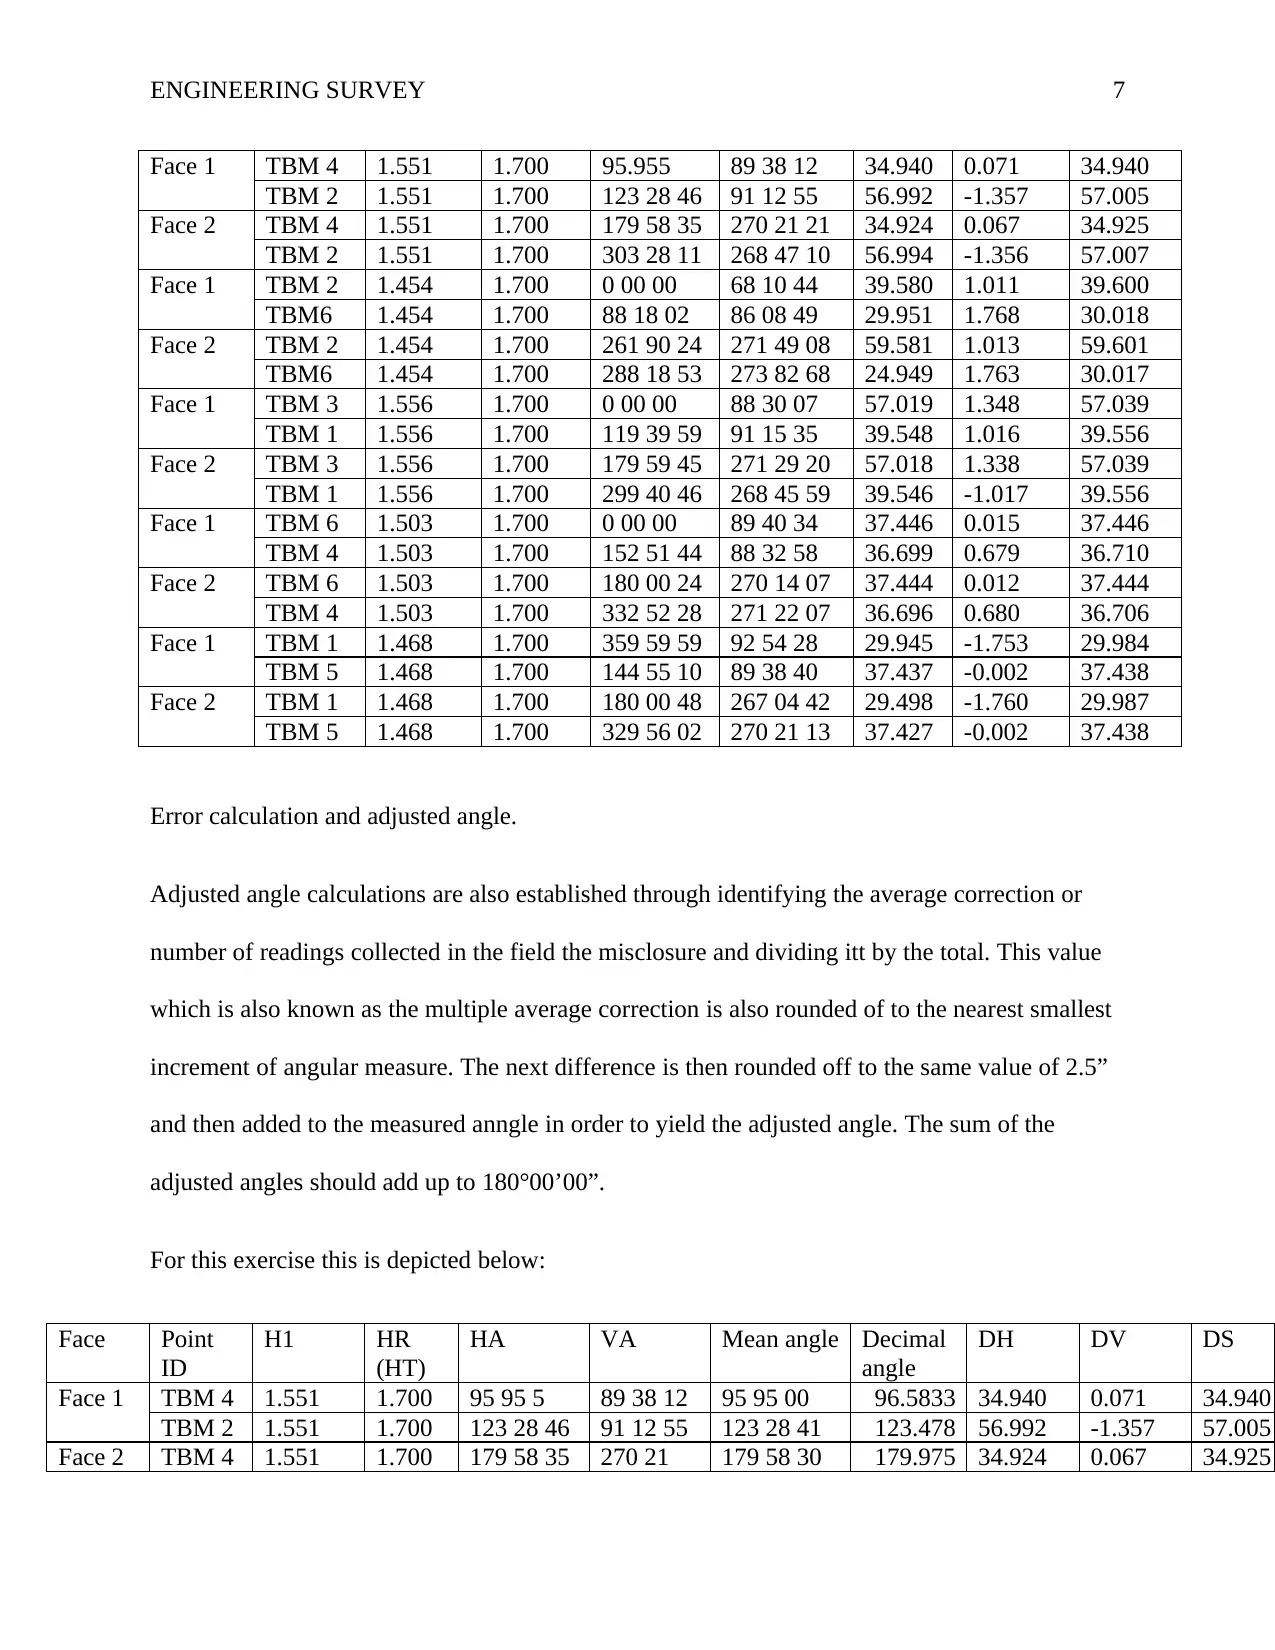
ENGINEERING SURVEY 7
Face 1 TBM 4 1.551 1.700 95.955 89 38 12 34.940 0.071 34.940
TBM 2 1.551 1.700 123 28 46 91 12 55 56.992 -1.357 57.005
Face 2 TBM 4 1.551 1.700 179 58 35 270 21 21 34.924 0.067 34.925
TBM 2 1.551 1.700 303 28 11 268 47 10 56.994 -1.356 57.007
Face 1 TBM 2 1.454 1.700 0 00 00 68 10 44 39.580 1.011 39.600
TBM6 1.454 1.700 88 18 02 86 08 49 29.951 1.768 30.018
Face 2 TBM 2 1.454 1.700 261 90 24 271 49 08 59.581 1.013 59.601
TBM6 1.454 1.700 288 18 53 273 82 68 24.949 1.763 30.017
Face 1 TBM 3 1.556 1.700 0 00 00 88 30 07 57.019 1.348 57.039
TBM 1 1.556 1.700 119 39 59 91 15 35 39.548 1.016 39.556
Face 2 TBM 3 1.556 1.700 179 59 45 271 29 20 57.018 1.338 57.039
TBM 1 1.556 1.700 299 40 46 268 45 59 39.546 -1.017 39.556
Face 1 TBM 6 1.503 1.700 0 00 00 89 40 34 37.446 0.015 37.446
TBM 4 1.503 1.700 152 51 44 88 32 58 36.699 0.679 36.710
Face 2 TBM 6 1.503 1.700 180 00 24 270 14 07 37.444 0.012 37.444
TBM 4 1.503 1.700 332 52 28 271 22 07 36.696 0.680 36.706
Face 1 TBM 1 1.468 1.700 359 59 59 92 54 28 29.945 -1.753 29.984
TBM 5 1.468 1.700 144 55 10 89 38 40 37.437 -0.002 37.438
Face 2 TBM 1 1.468 1.700 180 00 48 267 04 42 29.498 -1.760 29.987
TBM 5 1.468 1.700 329 56 02 270 21 13 37.427 -0.002 37.438
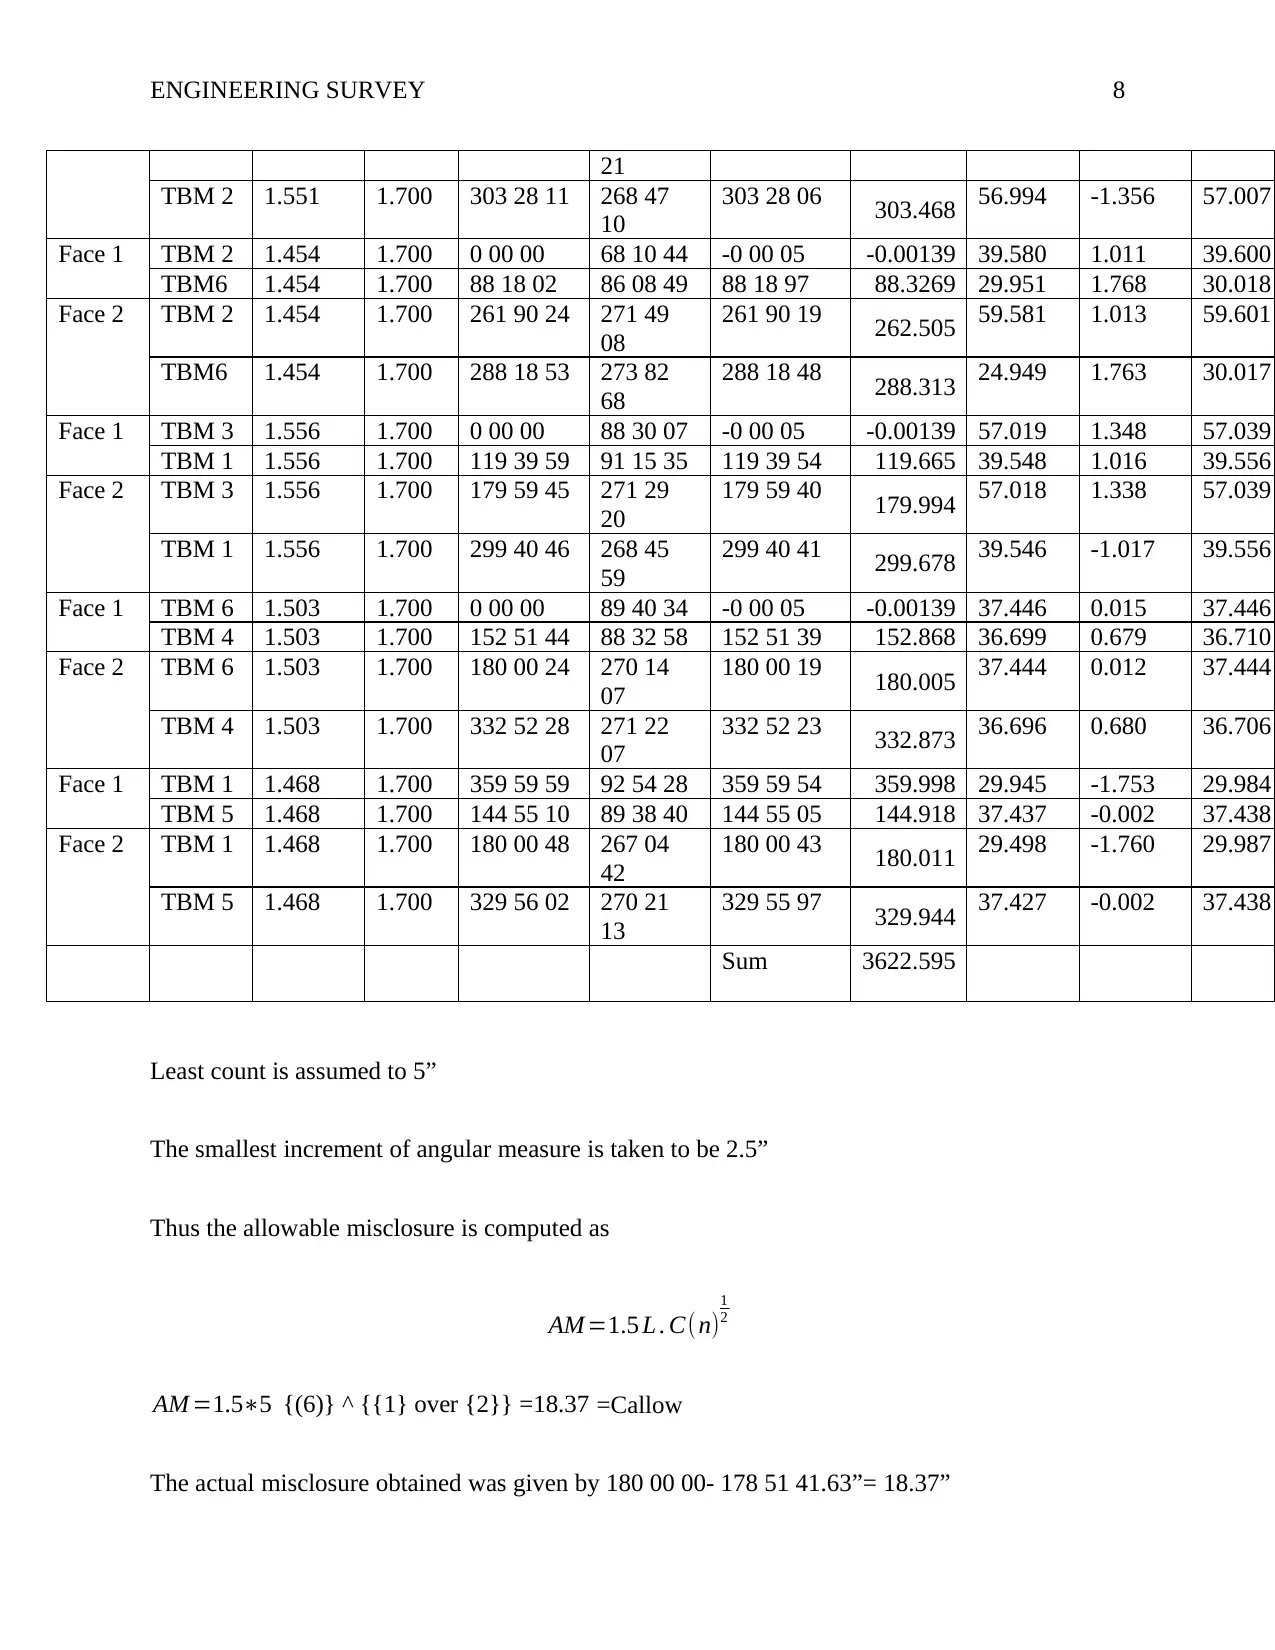
Error calculation and adjusted angle.
Adjusted angle calculations are also established through identifying the average correction or
number of readings collected in the field the misclosure and dividing itt by the total. This value
which is also known as the multiple average correction is also rounded of to the nearest smallest
increment of angular measure. The next difference is then rounded off to the same value of 2.5”
and then added to the measured anngle in order to yield the adjusted angle. The sum of the
adjusted angles should add up to 180°00’00”.
For this exercise this is depicted below:
Face Point
ID
H1 HR
(HT)
HA VA Mean angle Decimal
angle
DH DV DS
Face 1 TBM 4 1.551 1.700 95 95 5 89 38 12 95 95 00 96.5833 34.940 0.071 34.940
TBM 2 1.551 1.700 123 28 46 91 12 55 123 28 41 123.478 56.992 -1.357 57.005
Face 2 TBM 4 1.551 1.700 179 58 35 270 21 179 58 30 179.975 34.924 0.067 34.925
Face 1 TBM 4 1.551 1.700 95.955 89 38 12 34.940 0.071 34.940
TBM 2 1.551 1.700 123 28 46 91 12 55 56.992 -1.357 57.005
Face 2 TBM 4 1.551 1.700 179 58 35 270 21 21 34.924 0.067 34.925
TBM 2 1.551 1.700 303 28 11 268 47 10 56.994 -1.356 57.007
Face 1 TBM 2 1.454 1.700 0 00 00 68 10 44 39.580 1.011 39.600
TBM6 1.454 1.700 88 18 02 86 08 49 29.951 1.768 30.018
Face 2 TBM 2 1.454 1.700 261 90 24 271 49 08 59.581 1.013 59.601
TBM6 1.454 1.700 288 18 53 273 82 68 24.949 1.763 30.017
Face 1 TBM 3 1.556 1.700 0 00 00 88 30 07 57.019 1.348 57.039
TBM 1 1.556 1.700 119 39 59 91 15 35 39.548 1.016 39.556
Face 2 TBM 3 1.556 1.700 179 59 45 271 29 20 57.018 1.338 57.039
TBM 1 1.556 1.700 299 40 46 268 45 59 39.546 -1.017 39.556
Face 1 TBM 6 1.503 1.700 0 00 00 89 40 34 37.446 0.015 37.446
TBM 4 1.503 1.700 152 51 44 88 32 58 36.699 0.679 36.710
Face 2 TBM 6 1.503 1.700 180 00 24 270 14 07 37.444 0.012 37.444
TBM 4 1.503 1.700 332 52 28 271 22 07 36.696 0.680 36.706
Face 1 TBM 1 1.468 1.700 359 59 59 92 54 28 29.945 -1.753 29.984
TBM 5 1.468 1.700 144 55 10 89 38 40 37.437 -0.002 37.438
Face 2 TBM 1 1.468 1.700 180 00 48 267 04 42 29.498 -1.760 29.987
TBM 5 1.468 1.700 329 56 02 270 21 13 37.427 -0.002 37.438
Error calculation and adjusted angle.
Adjusted angle calculations are also established through identifying the average correction or
number of readings collected in the field the misclosure and dividing itt by the total. This value
which is also known as the multiple average correction is also rounded of to the nearest smallest
increment of angular measure. The next difference is then rounded off to the same value of 2.5”
and then added to the measured anngle in order to yield the adjusted angle. The sum of the
adjusted angles should add up to 180°00’00”.
For this exercise this is depicted below:
Face Point
ID
H1 HR
(HT)
HA VA Mean angle Decimal
angle
DH DV DS
Face 1 TBM 4 1.551 1.700 95 95 5 89 38 12 95 95 00 96.5833 34.940 0.071 34.940
TBM 2 1.551 1.700 123 28 46 91 12 55 123 28 41 123.478 56.992 -1.357 57.005
Face 2 TBM 4 1.551 1.700 179 58 35 270 21 179 58 30 179.975 34.924 0.067 34.925
Paraphrase This Document
Need a fresh take? Get an instant paraphrase of this document with our AI Paraphraser
ENGINEERING SURVEY 8
21
TBM 2 1.551 1.700 303 28 11 268 47
10
303 28 06 303.468 56.994 -1.356 57.007
Face 1 TBM 2 1.454 1.700 0 00 00 68 10 44 -0 00 05 -0.00139 39.580 1.011 39.600
TBM6 1.454 1.700 88 18 02 86 08 49 88 18 97 88.3269 29.951 1.768 30.018
Face 2 TBM 2 1.454 1.700 261 90 24 271 49
08
261 90 19 262.505 59.581 1.013 59.601
TBM6 1.454 1.700 288 18 53 273 82
68
288 18 48 288.313 24.949 1.763 30.017
Face 1 TBM 3 1.556 1.700 0 00 00 88 30 07 -0 00 05 -0.00139 57.019 1.348 57.039
TBM 1 1.556 1.700 119 39 59 91 15 35 119 39 54 119.665 39.548 1.016 39.556
Face 2 TBM 3 1.556 1.700 179 59 45 271 29
20
179 59 40 179.994 57.018 1.338 57.039
TBM 1 1.556 1.700 299 40 46 268 45
59
299 40 41 299.678 39.546 -1.017 39.556
Face 1 TBM 6 1.503 1.700 0 00 00 89 40 34 -0 00 05 -0.00139 37.446 0.015 37.446
TBM 4 1.503 1.700 152 51 44 88 32 58 152 51 39 152.868 36.699 0.679 36.710
Face 2 TBM 6 1.503 1.700 180 00 24 270 14
07
180 00 19 180.005 37.444 0.012 37.444
TBM 4 1.503 1.700 332 52 28 271 22
07
332 52 23 332.873 36.696 0.680 36.706
Face 1 TBM 1 1.468 1.700 359 59 59 92 54 28 359 59 54 359.998 29.945 -1.753 29.984
TBM 5 1.468 1.700 144 55 10 89 38 40 144 55 05 144.918 37.437 -0.002 37.438
Face 2 TBM 1 1.468 1.700 180 00 48 267 04
42
180 00 43 180.011 29.498 -1.760 29.987
TBM 5 1.468 1.700 329 56 02 270 21
13
329 55 97 329.944 37.427 -0.002 37.438
Sum 3622.595
Least count is assumed to 5”
The smallest increment of angular measure is taken to be 2.5”
Thus the allowable misclosure is computed as
AM =1.5 L . C(n)
1
2
AM =1.5∗5 {(6)} ^ {{1} over {2}} =18.37 =Callow
The actual misclosure obtained was given by 180 00 00- 178 51 41.63”= 18.37”
ENGINEERING SURVEY 9
Actual correction is 22.006”
Since abs Cact<Callow, Survey is ok.
The average correction is found to be +4.33 (Smith & Vericat, 2015)
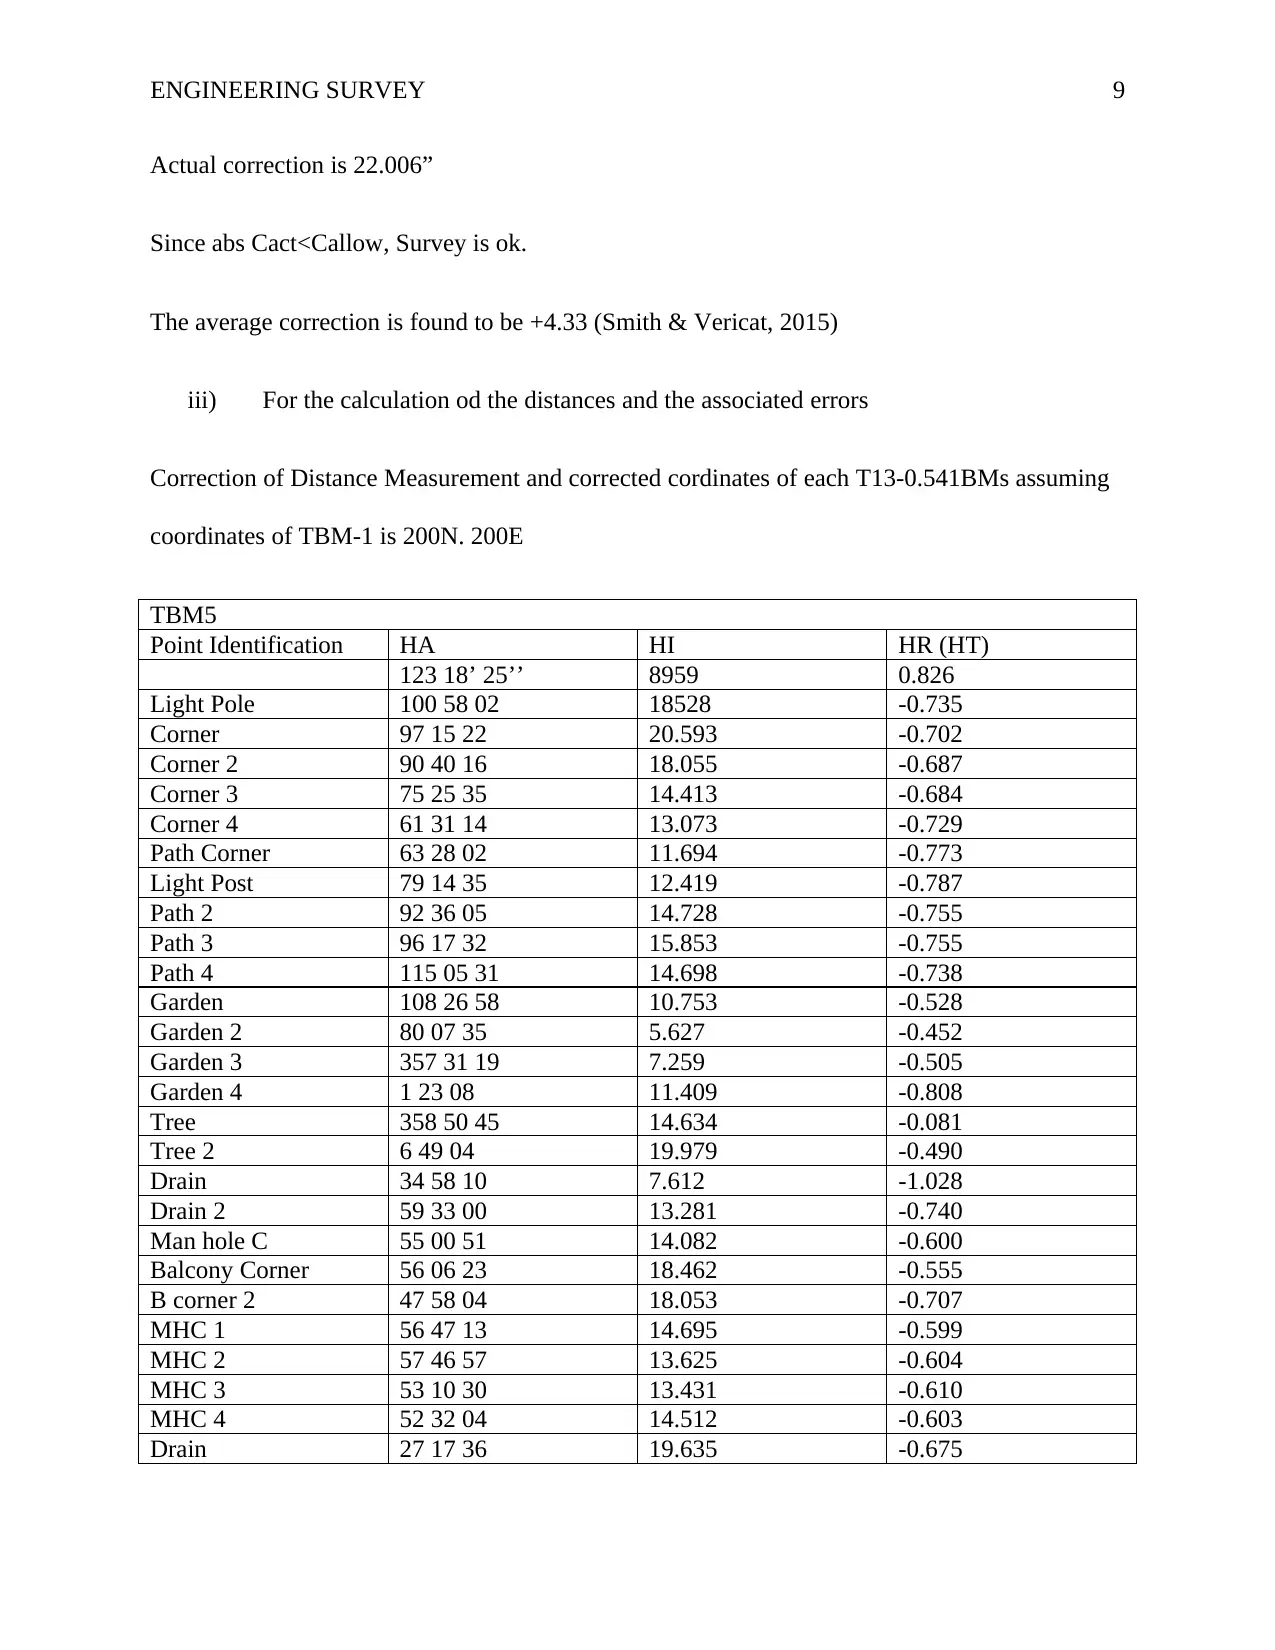
iii) For the calculation od the distances and the associated errors
Correction of Distance Measurement and corrected cordinates of each T13-0.541BMs assuming
coordinates of TBM-1 is 200N. 200E
TBM5
Point Identification HA HI HR (HT)
123 18’ 25’’ 8959 0.826
Light Pole 100 58 02 18528 -0.735
Corner 97 15 22 20.593 -0.702
Corner 2 90 40 16 18.055 -0.687
Corner 3 75 25 35 14.413 -0.684
Corner 4 61 31 14 13.073 -0.729
Path Corner 63 28 02 11.694 -0.773
Light Post 79 14 35 12.419 -0.787
Path 2 92 36 05 14.728 -0.755
Path 3 96 17 32 15.853 -0.755
Path 4 115 05 31 14.698 -0.738
Garden 108 26 58 10.753 -0.528
Garden 2 80 07 35 5.627 -0.452
Garden 3 357 31 19 7.259 -0.505
Garden 4 1 23 08 11.409 -0.808
Tree 358 50 45 14.634 -0.081
Tree 2 6 49 04 19.979 -0.490
Drain 34 58 10 7.612 -1.028
Drain 2 59 33 00 13.281 -0.740
Man hole C 55 00 51 14.082 -0.600
Balcony Corner 56 06 23 18.462 -0.555
B corner 2 47 58 04 18.053 -0.707
MHC 1 56 47 13 14.695 -0.599
MHC 2 57 46 57 13.625 -0.604
MHC 3 53 10 30 13.431 -0.610
MHC 4 52 32 04 14.512 -0.603
Drain 27 17 36 19.635 -0.675
Actual correction is 22.006”
Since abs Cact<Callow, Survey is ok.
The average correction is found to be +4.33 (Smith & Vericat, 2015)
iii) For the calculation od the distances and the associated errors
Correction of Distance Measurement and corrected cordinates of each T13-0.541BMs assuming
coordinates of TBM-1 is 200N. 200E
TBM5
Point Identification HA HI HR (HT)
123 18’ 25’’ 8959 0.826
Light Pole 100 58 02 18528 -0.735
Corner 97 15 22 20.593 -0.702
Corner 2 90 40 16 18.055 -0.687
Corner 3 75 25 35 14.413 -0.684
Corner 4 61 31 14 13.073 -0.729
Path Corner 63 28 02 11.694 -0.773
Light Post 79 14 35 12.419 -0.787
Path 2 92 36 05 14.728 -0.755
Path 3 96 17 32 15.853 -0.755
Path 4 115 05 31 14.698 -0.738
Garden 108 26 58 10.753 -0.528
Garden 2 80 07 35 5.627 -0.452
Garden 3 357 31 19 7.259 -0.505
Garden 4 1 23 08 11.409 -0.808
Tree 358 50 45 14.634 -0.081
Tree 2 6 49 04 19.979 -0.490
Drain 34 58 10 7.612 -1.028
Drain 2 59 33 00 13.281 -0.740
Man hole C 55 00 51 14.082 -0.600
Balcony Corner 56 06 23 18.462 -0.555
B corner 2 47 58 04 18.053 -0.707
MHC 1 56 47 13 14.695 -0.599
MHC 2 57 46 57 13.625 -0.604
MHC 3 53 10 30 13.431 -0.610
MHC 4 52 32 04 14.512 -0.603
Drain 27 17 36 19.635 -0.675
⊘ This is a preview!⊘
Do you want full access?
Subscribe today to unlock all pages.
Trusted by 1+ million students worldwide
ENGINEERING SURVEY 10
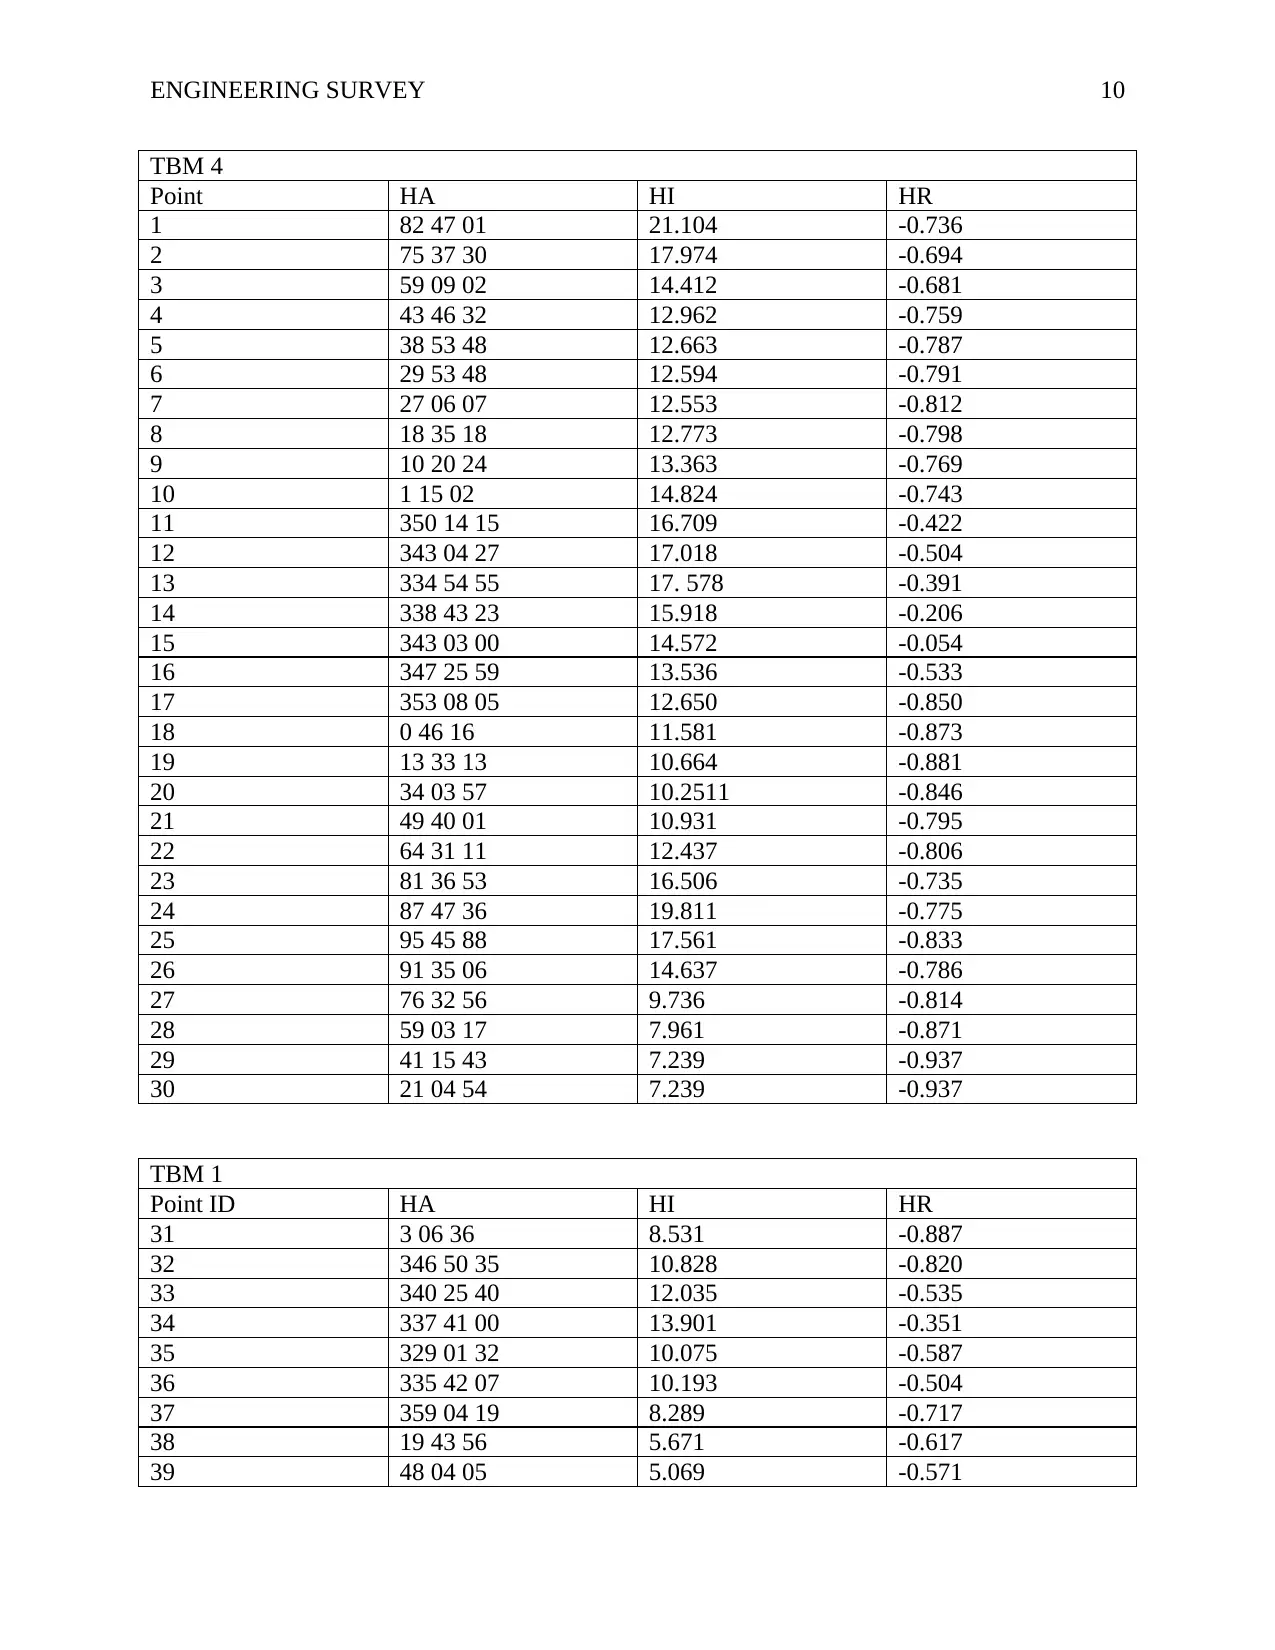
TBM 4
Point HA HI HR
1 82 47 01 21.104 -0.736
2 75 37 30 17.974 -0.694
3 59 09 02 14.412 -0.681
4 43 46 32 12.962 -0.759
5 38 53 48 12.663 -0.787
6 29 53 48 12.594 -0.791
7 27 06 07 12.553 -0.812
8 18 35 18 12.773 -0.798
9 10 20 24 13.363 -0.769
10 1 15 02 14.824 -0.743
11 350 14 15 16.709 -0.422
12 343 04 27 17.018 -0.504
13 334 54 55 17. 578 -0.391
14 338 43 23 15.918 -0.206
15 343 03 00 14.572 -0.054
16 347 25 59 13.536 -0.533
17 353 08 05 12.650 -0.850
18 0 46 16 11.581 -0.873
19 13 33 13 10.664 -0.881
20 34 03 57 10.2511 -0.846
21 49 40 01 10.931 -0.795
22 64 31 11 12.437 -0.806
23 81 36 53 16.506 -0.735
24 87 47 36 19.811 -0.775
25 95 45 88 17.561 -0.833
26 91 35 06 14.637 -0.786
27 76 32 56 9.736 -0.814
28 59 03 17 7.961 -0.871
29 41 15 43 7.239 -0.937
30 21 04 54 7.239 -0.937
TBM 1
Point ID HA HI HR
31 3 06 36 8.531 -0.887
32 346 50 35 10.828 -0.820
33 340 25 40 12.035 -0.535
34 337 41 00 13.901 -0.351
35 329 01 32 10.075 -0.587
36 335 42 07 10.193 -0.504
37 359 04 19 8.289 -0.717
38 19 43 56 5.671 -0.617
39 48 04 05 5.069 -0.571
Paraphrase This Document
Need a fresh take? Get an instant paraphrase of this document with our AI Paraphraser
ENGINEERING SURVEY 11
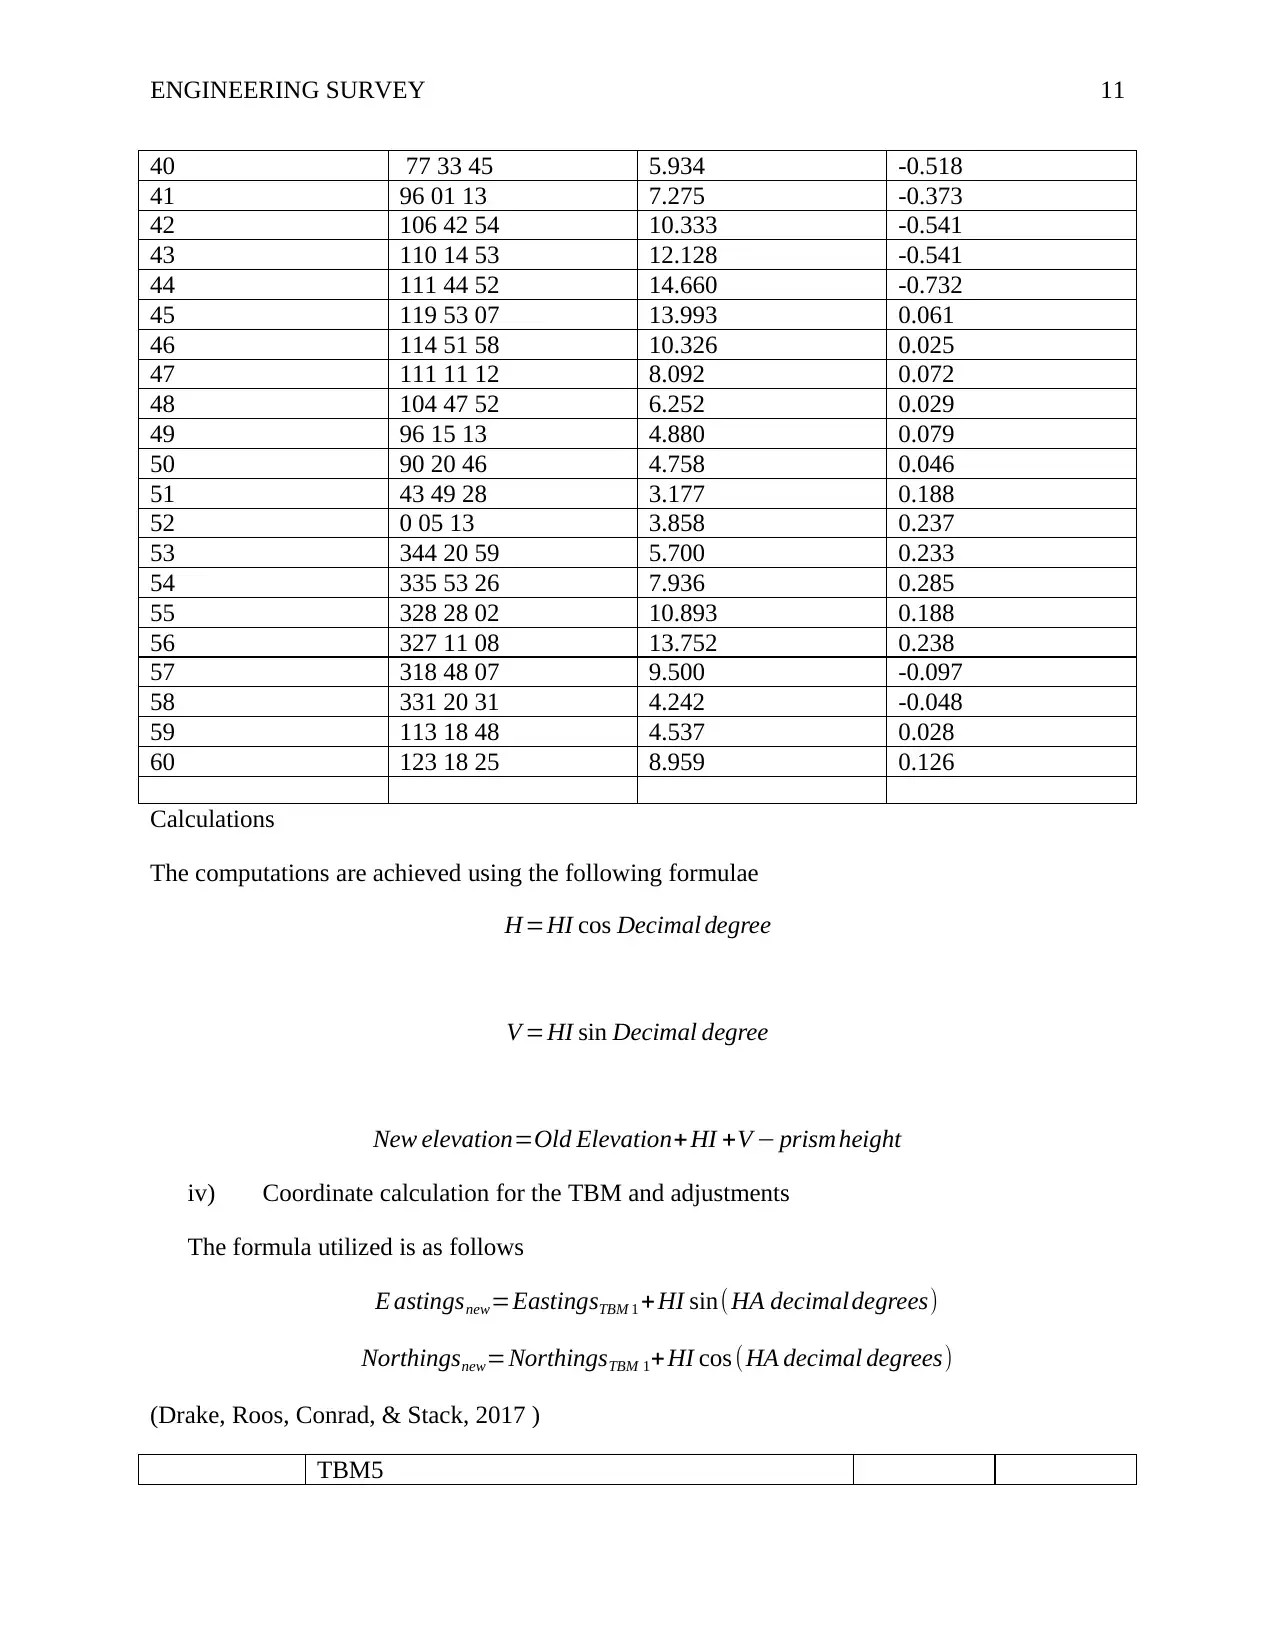
40 77 33 45 5.934 -0.518
41 96 01 13 7.275 -0.373
42 106 42 54 10.333 -0.541
43 110 14 53 12.128 -0.541
44 111 44 52 14.660 -0.732
45 119 53 07 13.993 0.061
46 114 51 58 10.326 0.025
47 111 11 12 8.092 0.072
48 104 47 52 6.252 0.029
49 96 15 13 4.880 0.079
50 90 20 46 4.758 0.046
51 43 49 28 3.177 0.188
52 0 05 13 3.858 0.237
53 344 20 59 5.700 0.233
54 335 53 26 7.936 0.285
55 328 28 02 10.893 0.188
56 327 11 08 13.752 0.238
57 318 48 07 9.500 -0.097
58 331 20 31 4.242 -0.048
59 113 18 48 4.537 0.028
60 123 18 25 8.959 0.126
Calculations
The computations are achieved using the following formulae
H=HI cos Decimal degree
V =HI sin Decimal degree
New elevation=Old Elevation+ HI +V − prism height
iv) Coordinate calculation for the TBM and adjustments
The formula utilized is as follows
E astingsnew=EastingsTBM 1 + HI sin( HA decimaldegrees)
Northingsnew=NorthingsTBM 1+ HI cos (HA decimal degrees)
(Drake, Roos, Conrad, & Stack, 2017 )
TBM5
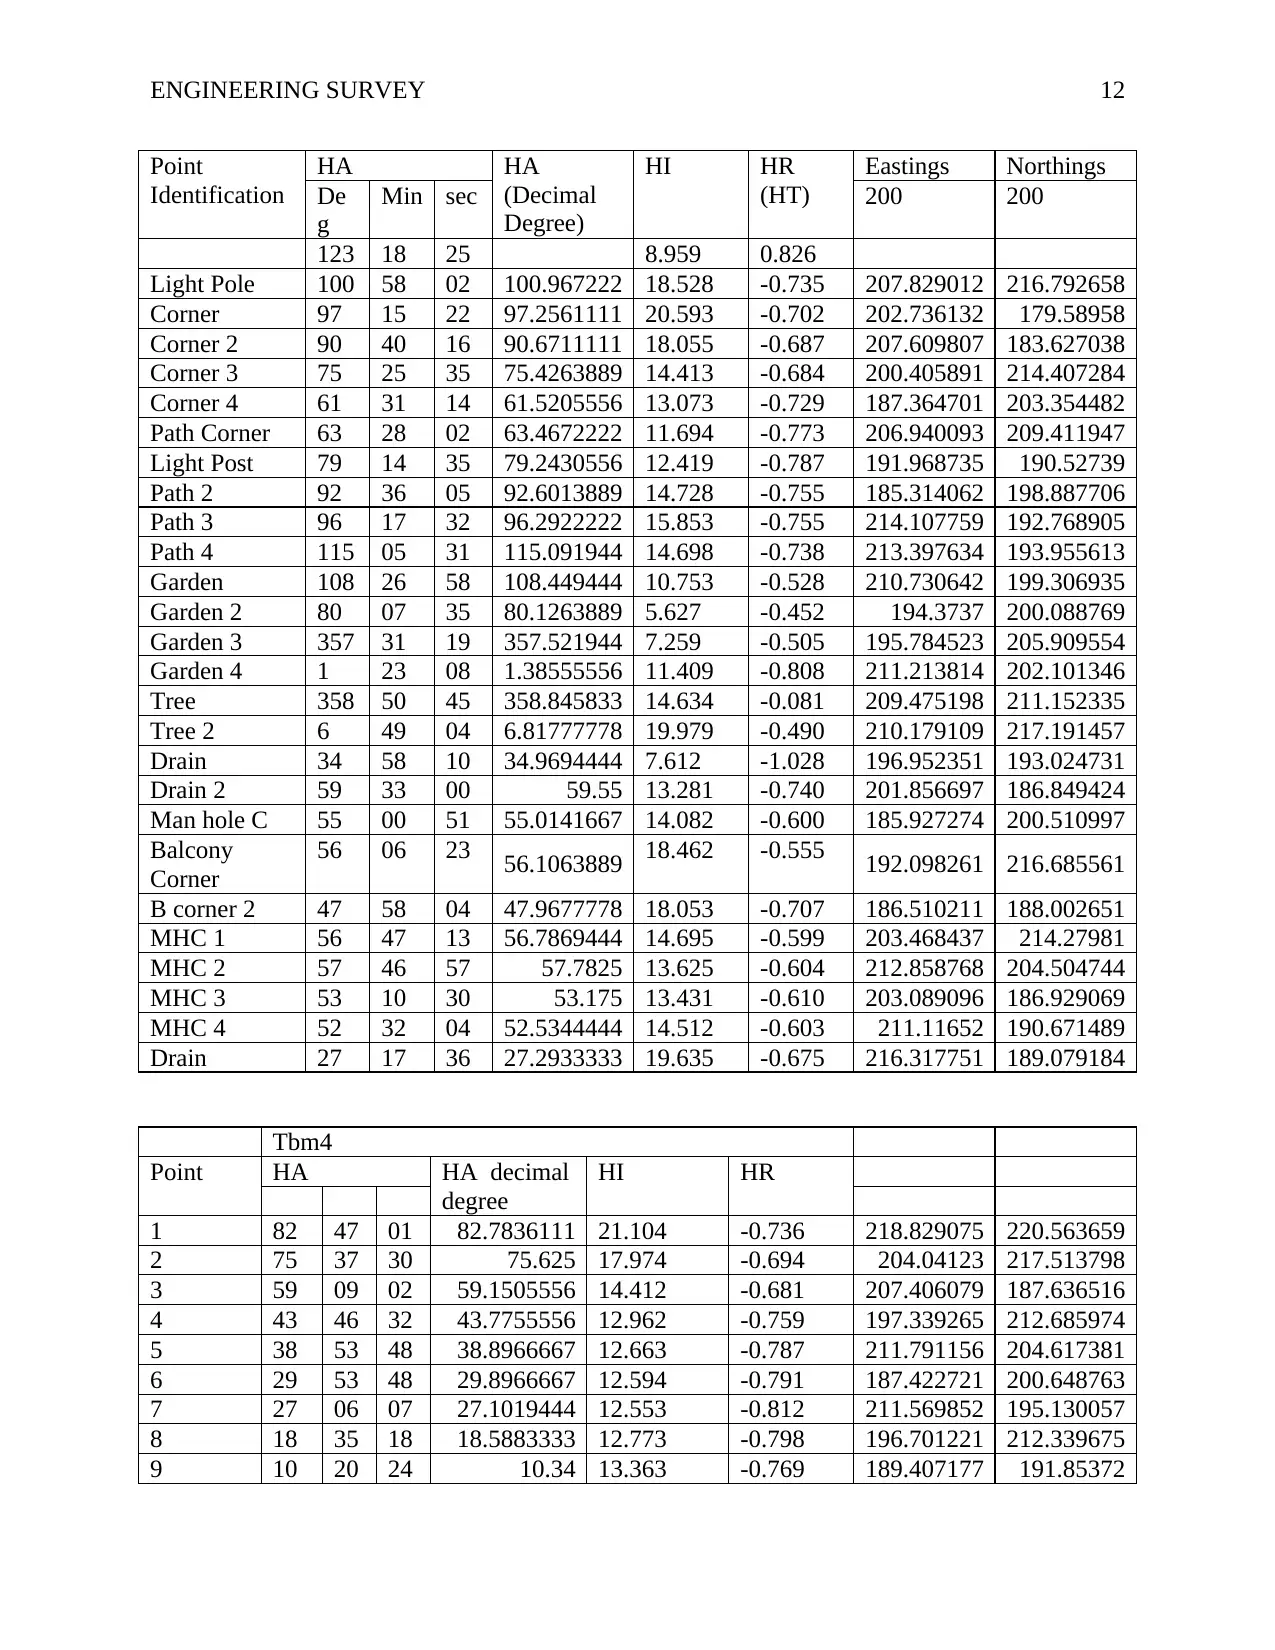
ENGINEERING SURVEY 12
Point
Identification
HA HA
(Decimal
Degree)
HI HR
(HT)
Eastings Northings
De
g
Min sec 200 200
123 18 25 8.959 0.826
Light Pole 100 58 02 100.967222 18.528 -0.735 207.829012 216.792658
Corner 97 15 22 97.2561111 20.593 -0.702 202.736132 179.58958
Corner 2 90 40 16 90.6711111 18.055 -0.687 207.609807 183.627038
Corner 3 75 25 35 75.4263889 14.413 -0.684 200.405891 214.407284
Corner 4 61 31 14 61.5205556 13.073 -0.729 187.364701 203.354482
Path Corner 63 28 02 63.4672222 11.694 -0.773 206.940093 209.411947
Light Post 79 14 35 79.2430556 12.419 -0.787 191.968735 190.52739
Path 2 92 36 05 92.6013889 14.728 -0.755 185.314062 198.887706
Path 3 96 17 32 96.2922222 15.853 -0.755 214.107759 192.768905
Path 4 115 05 31 115.091944 14.698 -0.738 213.397634 193.955613
Garden 108 26 58 108.449444 10.753 -0.528 210.730642 199.306935
Garden 2 80 07 35 80.1263889 5.627 -0.452 194.3737 200.088769
Garden 3 357 31 19 357.521944 7.259 -0.505 195.784523 205.909554
Garden 4 1 23 08 1.38555556 11.409 -0.808 211.213814 202.101346
Tree 358 50 45 358.845833 14.634 -0.081 209.475198 211.152335
Tree 2 6 49 04 6.81777778 19.979 -0.490 210.179109 217.191457
Drain 34 58 10 34.9694444 7.612 -1.028 196.952351 193.024731
Drain 2 59 33 00 59.55 13.281 -0.740 201.856697 186.849424
Man hole C 55 00 51 55.0141667 14.082 -0.600 185.927274 200.510997
Balcony
Corner
56 06 23 56.1063889 18.462 -0.555 192.098261 216.685561
B corner 2 47 58 04 47.9677778 18.053 -0.707 186.510211 188.002651
MHC 1 56 47 13 56.7869444 14.695 -0.599 203.468437 214.27981
MHC 2 57 46 57 57.7825 13.625 -0.604 212.858768 204.504744
MHC 3 53 10 30 53.175 13.431 -0.610 203.089096 186.929069
MHC 4 52 32 04 52.5344444 14.512 -0.603 211.11652 190.671489
Drain 27 17 36 27.2933333 19.635 -0.675 216.317751 189.079184
Tbm4
Point HA HA decimal
degree
HI HR
1 82 47 01 82.7836111 21.104 -0.736 218.829075 220.563659
2 75 37 30 75.625 17.974 -0.694 204.04123 217.513798
3 59 09 02 59.1505556 14.412 -0.681 207.406079 187.636516
4 43 46 32 43.7755556 12.962 -0.759 197.339265 212.685974
5 38 53 48 38.8966667 12.663 -0.787 211.791156 204.617381
6 29 53 48 29.8966667 12.594 -0.791 187.422721 200.648763
7 27 06 07 27.1019444 12.553 -0.812 211.569852 195.130057
8 18 35 18 18.5883333 12.773 -0.798 196.701221 212.339675
9 10 20 24 10.34 13.363 -0.769 189.407177 191.85372
⊘ This is a preview!⊘
Do you want full access?
Subscribe today to unlock all pages.
Trusted by 1+ million students worldwide
1 out of 21
Related Documents


Your All-in-One AI-Powered Toolkit for Academic Success.
+13062052269
info@desklib.com
Available 24*7 on WhatsApp / Email
![[object Object]](/_next/static/media/star-bottom.7253800d.svg)
Unlock your academic potential
Copyright © 2020–2026 A2Z Services. All Rights Reserved. Developed and managed by ZUCOL.