Latino Engineering: Report on Continuous Improvement Methodologies
VerifiedAdded on 2020/03/16
|17
|3979
|40
Report
AI Summary
This report addresses the challenges faced by Latino Engineering after a change in ownership, focusing on implementing a continuous improvement plan. It begins by identifying the root causes of problems, such as poor customer service and defective equipment, using the POTI (Processes, Organization, Technology, and Information) framework. The report then proposes the application of the 7 Quality Control (QC) Tools, including Pareto diagrams, cause and effect diagrams, histograms, control charts, scatter diagrams, and graphs, to analyze data, pinpoint key issues, and suggest actionable improvements. The report emphasizes the importance of understanding the relationships between variables and using statistical tools to improve product quality and customer service. The ultimate goal is to restore Latino Engineering's reputation and achieve new standards of excellence. The report provides a structured approach to problem-solving and continuous improvement, essential for business development and operational efficiency.
PROJECT MANAGEMENT METHODOLOGIES
Name
Date
Name
Date
Paraphrase This Document
Need a fresh take? Get an instant paraphrase of this document with our AI Paraphraser
Introduction
Latino Engineering, a 30 year old engineering company has achieved tremendous success over
its lifetime, under the leadership and management of the founder, Dominic Latino, a mechanical
engineer with a passion for quality engineering products. Through Dominic and his team’s
leadership, the company has developed a reputation for quality supplying various engineering
products and components to diverse industries including utilities, oil and gas, infrastructure, and
construction. Because of its great reputation, profitability, and client base, a consortium of
investors bought the company, and retained most of the company’s workforce, albeit with some
managers’ quitting to seek greener pastures. Fearing loss of complete control, the founder,
Dominic, also decided to sell the company and retire. However, a year after, several cracks are
appearing; clients are complaining of poor customer service, defective engineering equipment,
poor design and development follow-up with the clients, issue resolution turnaround taking too
long, and cases of the wrong equipment being sent to customers. This report provides ways by
which the new owners can identify the source of the problems and proposes a plan for
continuous improvement methodologies to return the company to its former glory and attain new
standards of quality and reliability. The plan will be illustrated using pictorial methods and a plan
for the implementation of the continuous improvement plan.
Continuous Improvement Plan
The quality improvement process at Latino Engineering must start with how the root causes for
the problems are identified, having been acknowledged that problems exist. The proposed
methodology involves the implementation of the 7 Quality Control (7 QC) Tools for Continuous
Improvement of Manufacturing Processes known popularly as the 7 QC tools (Oakland 2014).
The 7 QC Tools refer to statistical tools introduced and developed in Japan, which according to
Magar and Shinde (2014) can be used to tackle 95% of all problems related to manufacturing.
The 7 QC Tools include;
The Pareto Diagram
The Cause and Effect Diagram
A Histogram
Control Charts
Scatter Diagrams
Use of Graphs
Check Sheets
These are discussed in the following sections on how Latino Engineering will apply them to
solve existing problems and further improve their products and services. The diagram (shown in
Appendix II: 7 QC Diagram) shows how the methodology discussed below should proceed.
Before implementing the 7 QC Tools, it is important that the root causes are identified and a
higher level overview provided. This is achieved using the POTI (Processes, Organization,
Technology, and Information). This is an Agile process that enables incremental assessment and
improvement of the problems identified; this method is used by implementing the 7 QC Tools
(Cano, Moguerza & Redchuk 2012). The POTI diagram is shown in Appendix I: POTI Diagram.
Using the POTI diagram, Latino Engineering organizational culture must be evaluated as it
seems the root cause of most problems, given the company retained most of the staff under the
previous management of Dominic. In evaluating the organizational culture; the structure of the
organization will be reviewed, along with roles and skills required for present and future
business functions, staffing levels, and from this analysis, changes to the company’s
organizational structure will be proposed and implemented.
This is because after some former managers departed, the new culture seems not to focus on
quality and customer satisfaction as happened under the leadership of Dominic and his managers
('Project Management Tips', 2017). Next, the processes will be evaluated to include the business
functions and processes at the company, performance levels, operational costs, the vision and
required future state as processes have a bearing on many factors, including communication and
quality assurance. Next, the technology requirements for Latino Engineering will be evaluated to
see gaps and introduce technology that will enhance quality design such as the use of Building
Information Modeling (BIM) and Auto CAD (Sanchez, Hampson & Vaux 2016) along with
systems such as CRM and ERP programs to enhance communication and ensure quality
customer service (Crandall & Crandall 2015). Finally, the information component will be
evaluated to determine the necessary information required and the relevant data; the
communication between company and clients will be evaluated, as is communication with
designers, engineers, and customer service agents. This will identify the root cause of the
⊘ This is a preview!⊘
Do you want full access?
Subscribe today to unlock all pages.
Trusted by 1+ million students worldwide
problems and is an essential process before implementing a continuous improvement plan (CIP)
using the 7 QC Tool to improve on product quality and customer service
The Pareto Diagram
This tool is particularly important for the Latino Engineering problems because it arranges items
in the order of their contributing magnitude so that the few items that exert the maximum
influence are identified (Cano, Moguerza & Redchuk 2012). Based on the identified problems
the biggest problem must be the issue of poor design and development follow up with clients,
which contributes to most of the other problems that are assumed to be 35% of the problems and
must be happening pervasively at the organization. The second problem is that of poor
communication as the first issue shows follow up during design and development is poor; this
contributes to 30% of the problem. The third major issue is as a result of the first two problems
and are defective engineering products, that should contributed (assumed) 25 of the problems
being experienced. The next problem is non-responsive customer service and team that we
assume contributes 15% of problems. Next cause is too long turnaround in dealing with issues
that we assume contributed 10%, and the final issue is cases where wrong equipment is packed
and delivered to the clients and we assume this contributes to 5% of problem in terms of impact.
These are then visually represented in a Pareto chart by tabulating the absolute numbers; for
example, the number of times every week of poor design and follow in design and development
with clients. The number of times this is done is established and recorded (Suganthi & Samuel
2006). For all the items, this data is collected and tabulated with the Y axis of the chart having
two sides; the left will show the numbers while the right side will show the percent contributions
(See Appendix III: Pareto). Graphs and points are developed and the points joined; at this point
the chart is ready for interpretation. At some point, the chart slope will change suddenly and it’s
the point that separates the vital few from useful many (Srivastava 2006). Focus will be placed
on the vital few for the best impacts.
Cause and Effect Diagram
Once the Pareto diagram is developed and interpreted, the cause and effect diagram is developed;
this is a tool used to show the systematic relationships between symptoms and/or results and its
possible causes. The tool enables systematic ideas about ides to be developed on the problem
Paraphrase This Document
Need a fresh take? Get an instant paraphrase of this document with our AI Paraphraser
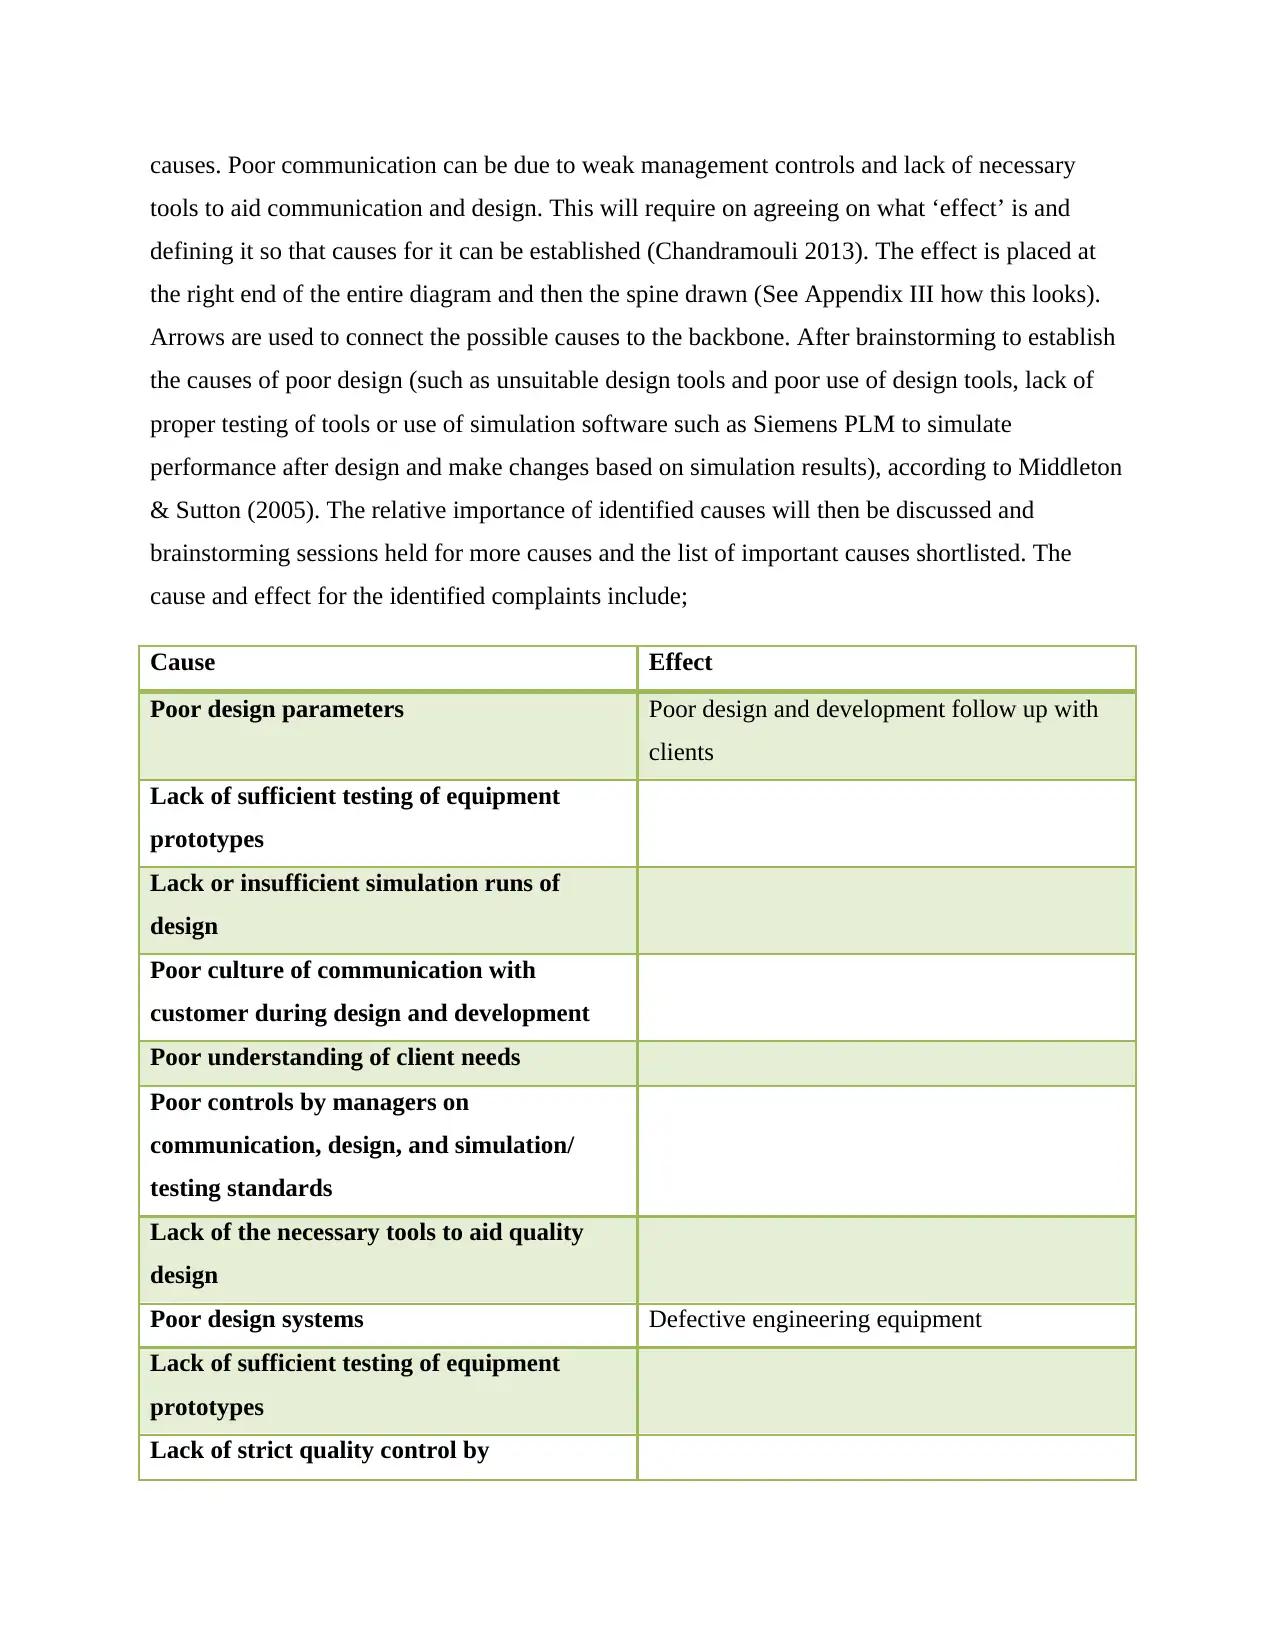
causes. Poor communication can be due to weak management controls and lack of necessary
tools to aid communication and design. This will require on agreeing on what ‘effect’ is and
defining it so that causes for it can be established (Chandramouli 2013). The effect is placed at
the right end of the entire diagram and then the spine drawn (See Appendix III how this looks).
Arrows are used to connect the possible causes to the backbone. After brainstorming to establish
the causes of poor design (such as unsuitable design tools and poor use of design tools, lack of
proper testing of tools or use of simulation software such as Siemens PLM to simulate
performance after design and make changes based on simulation results), according to Middleton
& Sutton (2005). The relative importance of identified causes will then be discussed and
brainstorming sessions held for more causes and the list of important causes shortlisted. The
cause and effect for the identified complaints include;
Cause Effect
Poor design parameters Poor design and development follow up with
clients
Lack of sufficient testing of equipment
prototypes
Lack or insufficient simulation runs of
design
Poor culture of communication with
customer during design and development
Poor understanding of client needs
Poor controls by managers on
communication, design, and simulation/
testing standards
Lack of the necessary tools to aid quality
design
Poor design systems Defective engineering equipment
Lack of sufficient testing of equipment
prototypes
Lack of strict quality control by
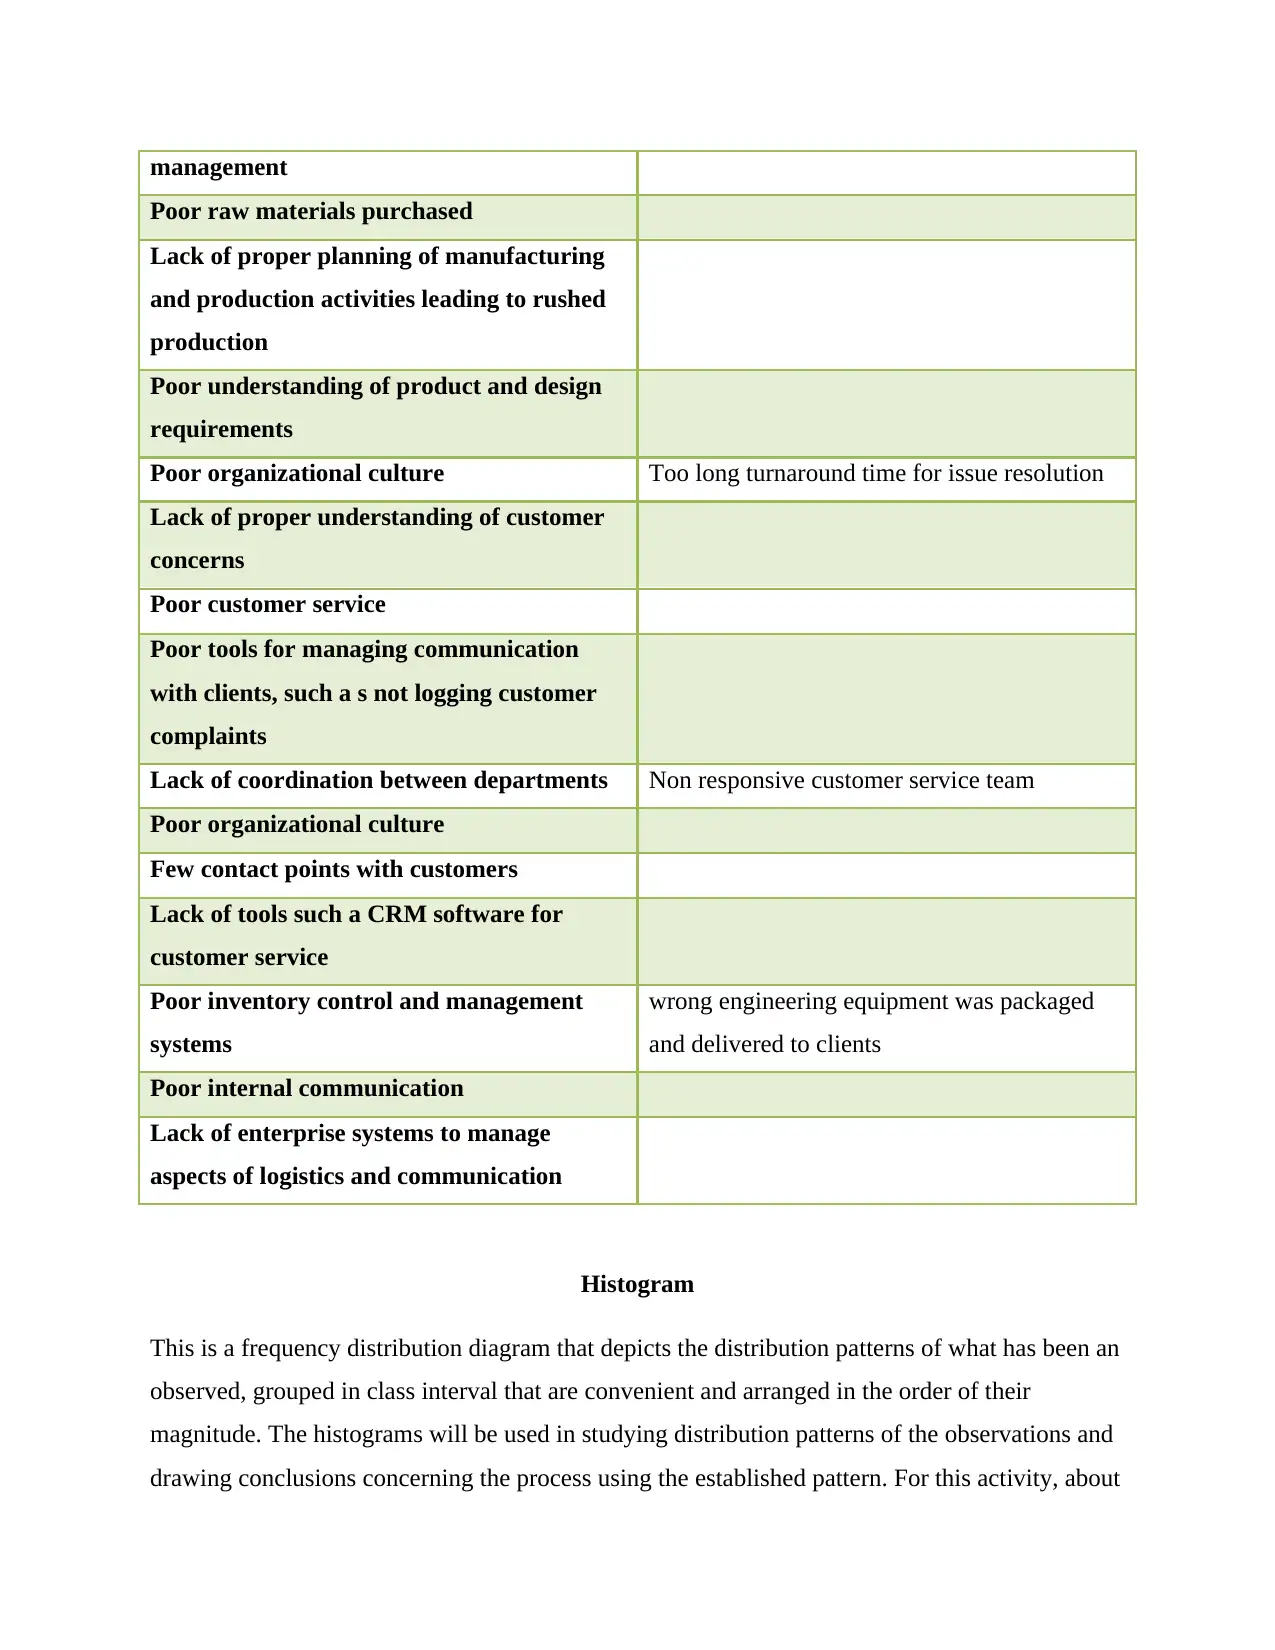
management
Poor raw materials purchased
Lack of proper planning of manufacturing
and production activities leading to rushed
production
Poor understanding of product and design
requirements
Poor organizational culture Too long turnaround time for issue resolution
Lack of proper understanding of customer
concerns
Poor customer service
Poor tools for managing communication
with clients, such a s not logging customer
complaints
Lack of coordination between departments Non responsive customer service team
Poor organizational culture
Few contact points with customers
Lack of tools such a CRM software for
customer service
Poor inventory control and management
systems
wrong engineering equipment was packaged
and delivered to clients
Poor internal communication
Lack of enterprise systems to manage
aspects of logistics and communication
Histogram
This is a frequency distribution diagram that depicts the distribution patterns of what has been an
observed, grouped in class interval that are convenient and arranged in the order of their
magnitude. The histograms will be used in studying distribution patterns of the observations and
drawing conclusions concerning the process using the established pattern. For this activity, about
⊘ This is a preview!⊘
Do you want full access?
Subscribe today to unlock all pages.
Trusted by 1+ million students worldwide
50 observations about an item will be collected and values arranged in ascending manner. The
range of values will then be divided into convenient groups, each representative of an equal class
interval. The group numbers will be approximately the square root of the number of
observations; in this case we will have seven groupings. For each group, the frequency is noted
and a Cartesian plane chart drawn with the frequency shown on the Y axis and the appropriate
scales on the X axis (See Appendix IV). For every group, bars will be drawn and the distribution
patterns for problems and issues studied and evaluated and conclusions drawn ('What is Six
Sigma' 2017).
Control Charts
All production processes have inherent variability due either to assignable causes (that can be
prevented) and random causes (that are not preventable). The chart will enable assignable causes
to be made out and production troubles diagnosed and corrected for engineering equipment
Latino produces with substantial improvements possible. Using this chart, we will know when a
process must be left alone and when action must be taken. This will be done by identifying
attributes and quantifying them as variables and the mean and range also identified. –X is the sub
group mean while R is the range showing the difference between the maximum and minimum
within the sub group. Control charts that deplete the _X and R variations; R charts will be used
when sub groups are between 2 and 5 and s charts used when they are above 5. Control charts for
attributes will then be developed (Charantimath 2011)
Scatter Diagram
This helps show the relationships between variables; for instance how is poor design tools related
to poor quality products? There are variable in which a relationship can be non-existent.
Relationships can be weak or strong, positive or negative and can be a simple relationship or a
complex one. This will entail drawing a scatter diagram with one variable on the X axis and
another on the Y axis and using a best line of fit, the relationship can be determined, along with
the mathematics representation in the form y = mx + c (The slope of the diagram) which can be
used to predict how one variable changes in response to the other variable (Charantimath 2011)
(See Appendix V)
Graphs
Paraphrase This Document
Need a fresh take? Get an instant paraphrase of this document with our AI Paraphraser
The data found during analysis will then be represented as pictorial data in the form of graphs to
enable a quick understanding of what they mean, rather than having to read through the
description and analysis of the data. Depending on the data types collected, various types of
graphs can be used, for instance line graphs for data changes, bar graphs for data size
comparisons, Gantt charts for scheduling and planning, and radar charts for showing data
changes (Shiba, Graham, Walden & Petrolini 2007).
Check Sheets
The final steps in employing the 7 QC Tools will be to develop check sheets which requires that
the collected data and information is comprehensive and relevant. The check sheets are used for
data collection and will be specific for the data to be collected. The check sheets can be
incorporated into a CRM or ERP software application so that the communication with clients’
data is recorded for future review; same as design, simulation, and testing engineering
components. This data will be stored in the software application and used by management for
decision making and observing trends; the data can be extracted and used for data sheets. The
collected data using check sheets must be classified meaningfully, through a process known as
stratification to help with understanding of dispersion and relevance of the data. These can then
be panned and used for obtaining meaningful outputs (Shiba, Graham, Walden & Petrolini 2007)
The application of the 7 QC and the POTI diagram development will be the first step in attaining
better product quality and providing better customer service and support for the Latino
Engineering Company. Once the relevant problems are identified, effort must be made to
continuously make improvements to all processes. The concept of continuous improvement
posits that steps are repeated to identify causes of problems and classify them, and then
implement solutions that improve the product by eliminating/ minimizing the causes. Further,
continuous improvement requires that overall processes are further refined, even after causes of
problems have been eliminated to continuously make customers happy. It is a cycle that is
continuous and should be part of the organizational culture at an organization. This will require
identifying opportunities in the entire work flow where improvements can be made; for example,
using modern BIM and Auto CAD software during engineering components design and then
employing PLM software for simulation; the simulation will give the theoretical performance of
the products and then these can be refined for further improvements. After making design
improvements, simulations are run again until the desired performance metrics for the design are
attained. A final design is then made and a prototype produced, which is then tested under
different conditions and refinements made to design, before the final version is produced.
Continuous improvements must occur at all different levels of the organization, starting from
procurement of raw materials, contacts with the customer, design, improvements, delivery, and
handing customer concerns.
After identifying improvement opportunities, a plan will be developed, using various tools, on
how the way present processes can be improved. For instance, an ERP can be implemented to
help manage orders and raw materials supply and an integrated CRM be used for managing
customer concerns and complaints. After developing the plan, it is then executed; for instance,
improving on reporting structures for the design process, using modern design and simulation
software, employing information systems or improving them , changing the organizational
culture to be more responsive to customer needs, even training employees on various aspects,
including customer service and product design. After execution, a review is done through data
collection to evaluate the impact of the improvement measures and decide on which ones have
little or no impact and what has greater impact. In employing continuous improvement (CI), the
requirements for success are identified; such as a maximum acceptable number for defects per
product, maximum turn around tie in dealing with client concerns, number of tests before a
component is manufactured, response times to customer concerns, number of simulations before
final design is approved; among others (Nakamura 2000). This process also requires effective
project management approaches and skills to achieve
Continuous improvement approaches include the use of methodologies such as Lean Production
where the Kaizen technique is used. Kaizen is a Japanese principle developed too enable
continuous improvement and is a strategy requiring employees at all the organization levels to
proactively work together to attain improvements that are regular and incremental during the
manufacturing process (Laraia, Hall & Moody 1999). Kaizen works by combining all talents
within an organization to create a powerful improvement engine. Kaizen has a dual nature
consisting of action plans and a philosophy. As action plan, Kaizen entails organizing events
aimed at improving specific areas in an organization and involve employee teas at all levels in
the organization, especially employees in the plant floor (Ortiz 2014). At Latino Engineering, it
⊘ This is a preview!⊘
Do you want full access?
Subscribe today to unlock all pages.
Trusted by 1+ million students worldwide
will require all employees improving processes such as communication, machining, testing, and
shipping products to customers. The philosophical aspect of Kaizen requires developing a culture
in which all employees are involved actively in making suggestions for improvements and
having these reviewed and implemented. This then becomes a natural way of thinking for the
employees of the company, including managers. The Kaizen method will require the following
steps to be followed;
Setting goals with a given background; such as reducing defects in products to less than
4% for every 1000 units of the product
Reviewing the present state such as of defective products and developing an
improvement plan
Implementing the improvements, such as following the & QC tolls method
Reviewing the measures taken and dealing with what does not work, such as eliminating
some tools or methods
Reporting results and determining follow up items.
The kaizen approach is to be implemented using a scientific approach involving Planning,
Doing, Checking, and Acting. These will also entail Total Quality Management (TQM)
principles to ensure quality define all production work (Mika 2006)
Conclusions
Latino Engineering has been a successful company held in high regard by customers for quality
engineering products and quality delivery. Because of its impressive revenue and customer base,
investors wanted a piece of the company. The founder and owner, Dominic, a passionate
engineer decided to sell the company altogether rather than a portion as this would mean he lost
control especially in decision making. After a year, Latino Engineering is faced with serious
challenges, including defective equipment, poor design and development follow up with
customers, very long turnaround in handling customer issues, a customer service team that is
non-responsive, and cases where the wrong equipment is packed and sent to customers. To
resolve these issues, Latino Engineering will need to use the 7 QC Tool to identify and correct
these problems, in the context of Kaizen and TQM platforms for continuous improvement. The
Paraphrase This Document
Need a fresh take? Get an instant paraphrase of this document with our AI Paraphraser

identification of problems will be done using the POTI model/ tool. These steps will ensure
significant changes after the three month period to ensure improvements.
significant changes after the three month period to ensure improvements.
References
Cano, E. L., Moguerza, J. M., & Redchuk, A. (2012). Six sigma with R statistical engineering for
process improvement. New York, Springer.
Chandramouli, S. (2013). PMP certification excel with ease. New Delhi, Dorling Kindersley.
Crandall, R. E., & Crandall, W. (2015). How management programs can improve performance:
selecting and implementing the best program for your organization. Charlotte, North Carolina :
Information Age Publishing
Laraia, A. C., Hall, R. W., & Moody, P. E. (1999). The Kaizen Blitz: accelerating breakthroughs
in productivity and performance. New York [u.a.], John Wiley.
Magar, V. and Shinde, V. (2014). Application of 7 Quality Control (7 QC) Tools for Continuous
Improvement of Manufacturing Processes. International Journal of Engineering Research and
General Science, [online] 2(4), pp.364-371. Available at:
http://www.ijergs.org/files/documents/APPLICATION-45.pdf [Accessed 2 Oct. 2017].
Middleton, P., & Sutton, J. (2005). Lean software strategies: proven techniques for managers
and developers. New York, N.Y., Productivity Press.
Mika, G. L. (2006). Kaizen event implementation manual. Dearborn, Mich, Society of
Manufacturing Engineers. Oakland, J. S. (2014). Total quality management and operational
excellence: text with cases. London, Routledge, Taylor & Francis Group.
Nakamura, S. (2000). The new standardization: keystone of continuous improvement in
manufacturing. Portland, Or, Productivity Press.
Ortiz, C. A. (2014). Kaizen and kaizen event implementation. New York, Prentice Hall.
'Project Management Tips' (2017). POTI: A Model for Programme Blueprints. [online] pmtips.
Available at: http://pmtips.net/blog-new/poti-model-programme-blueprints [Accessed 2 Oct.
2017].
Sanchez, A., Hampson, K., & Vaux, S. (2016). Delivering Value With BIM: a whole-of-life
approach. [S.l.], Routledge.
⊘ This is a preview!⊘
Do you want full access?
Subscribe today to unlock all pages.
Trusted by 1+ million students worldwide
1 out of 17
Related Documents


Your All-in-One AI-Powered Toolkit for Academic Success.
+13062052269
info@desklib.com
Available 24*7 on WhatsApp / Email
![[object Object]](/_next/static/media/star-bottom.7253800d.svg)
Unlock your academic potential
Copyright © 2020–2026 A2Z Services. All Rights Reserved. Developed and managed by ZUCOL.