Financial Analysis Report on LBT Innovations Ltd - Coursework
VerifiedAdded on 2021/06/18
|19
|4111
|11
Report
AI Summary
This report offers a detailed financial analysis of LBT Innovations Ltd, examining its operations, ownership, and governance structure. It includes a fundamental analysis of financial ratios over two years, comparing share price movements against the All Ordinaries Index. The report investigates factors influencing share price, such as industry trends and macroeconomic conditions. Furthermore, it explores the company's weighted average cost of capital (WACC) using the CAPM model, debt ratio, and dividend policy. The analysis covers short-term and long-term solvency, asset utilization, profitability, and market value ratios, providing a comprehensive overview of LBT Innovations Ltd's financial health and investment potential.
Running head: FINANCE FOR BUSINESS
Finance for Business
Name of the Student
Name of the University
Authors Note
Course ID
Finance for Business
Name of the Student
Name of the University
Authors Note
Course ID
Paraphrase This Document
Need a fresh take? Get an instant paraphrase of this document with our AI Paraphraser
1FINANCE FOR BUSINESS
Table of Contents
Description of Company:...........................................................................................................3
Ownership governance structure:...............................................................................................4
Substantial Shareholders of LBT Innovations Ltd:................................................................4
Main people involved in LBT Innovations Ltd governance:.................................................4
Computation of Fundamental Ratios:........................................................................................5
Short Term Solvency Ratios:.................................................................................................5
Long Term Solvency Ratios:.................................................................................................6
Asset Utilization Ratios:........................................................................................................6
Profitability Ratios:................................................................................................................6
Market Value Ratios:.............................................................................................................7
Description of Results:...............................................................................................................7
Graph of Monthly Share Price Movements:..........................................................................7
Comparative analysis with share price index to All Orders Index:.......................................8
Factors influencing share price movement of LBT Innovations Ltd:........................................9
Computation of Beta Value and Expected Rate of Return using CAPM:...............................10
Computed Beta for LBT Innovations Ltd:...........................................................................10
Computation of Required rate of return:..............................................................................10
Rationale for Conservative Investment:...............................................................................10
Computation of Weighted Average Cost of Capital:...............................................................11
Weighted Average Cost of Capital:.....................................................................................11

2FINANCE FOR BUSINESS
Explanation of WACC implications on management evaluations perspective:..................12
Debt Ratio:...............................................................................................................................12
Dividend Policy:.......................................................................................................................13
Letter of Recommendations:....................................................................................................13
Reference List:.........................................................................................................................15
⊘ This is a preview!⊘
Do you want full access?
Subscribe today to unlock all pages.
Trusted by 1+ million students worldwide
3FINANCE FOR BUSINESS
Executive Summary:
The current report is based on understanding of the LBT Innovations Ltd operations, its core
business activities and the market it operates. The report would be providing a highlight of
ownership and governance structure of LBT Innovations Ltd. A fundamental analysis of the
ratios would be performed over the past two financial years to understand the financial
position of LBT Innovations Ltd. The share prices of the company over the last two years
will be compared against the all ordinaries index to understand the movement in the share
prices of LBT Innovations Ltd. The report would further providing an analysis of the factors
that impact the share price of LBT Innovations Ltd by placing emphasis on the industry wide
factors. Additionally, an understanding of the conservative environment would be provided
by placing focus on the weighted average cost of capital that would be derived by using the
CAPM model. Further emphasis would be paid on debt ratio and the dividend policy of LBT
Innovations Ltd.
Paraphrase This Document
Need a fresh take? Get an instant paraphrase of this document with our AI Paraphraser
4FINANCE FOR BUSINESS
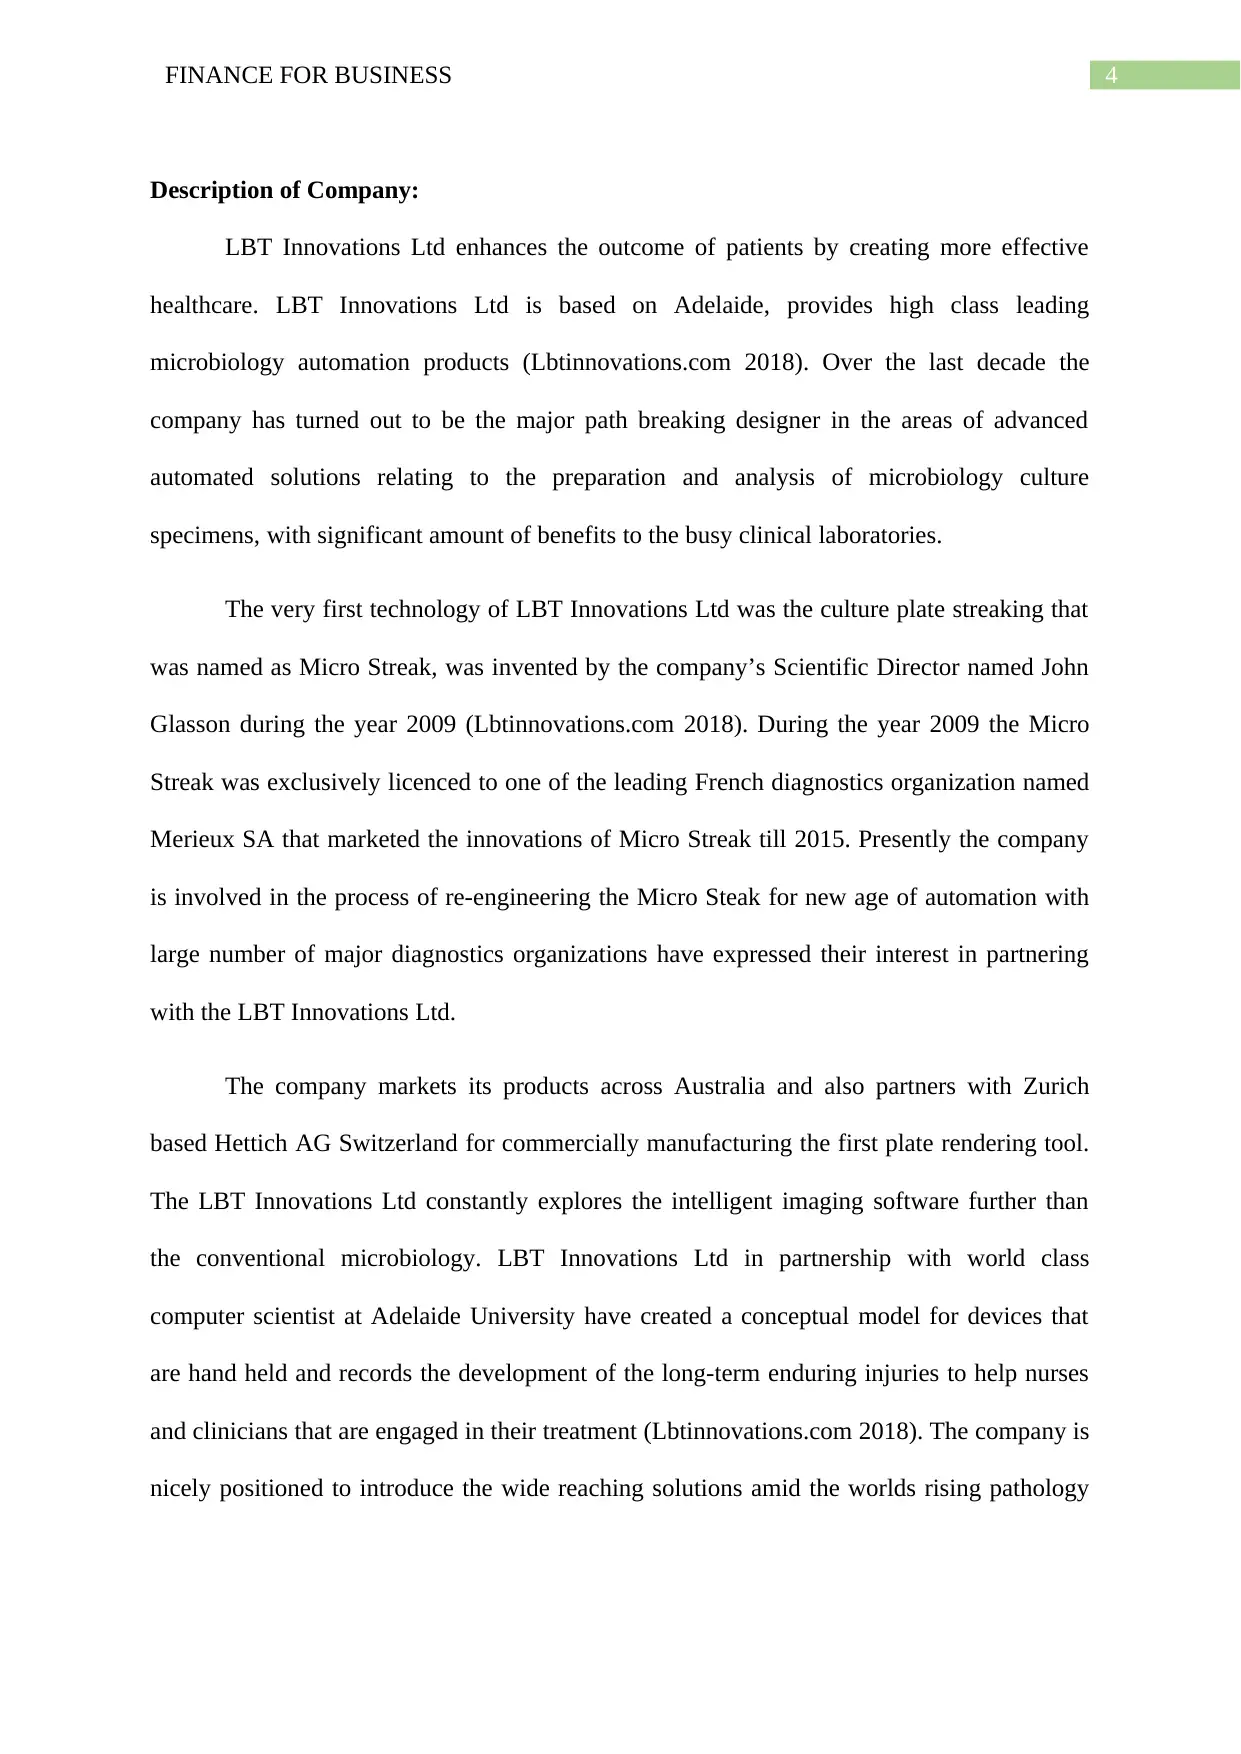
Description of Company:
LBT Innovations Ltd enhances the outcome of patients by creating more effective
healthcare. LBT Innovations Ltd is based on Adelaide, provides high class leading
microbiology automation products (Lbtinnovations.com 2018). Over the last decade the
company has turned out to be the major path breaking designer in the areas of advanced
automated solutions relating to the preparation and analysis of microbiology culture
specimens, with significant amount of benefits to the busy clinical laboratories.
The very first technology of LBT Innovations Ltd was the culture plate streaking that
was named as Micro Streak, was invented by the company’s Scientific Director named John
Glasson during the year 2009 (Lbtinnovations.com 2018). During the year 2009 the Micro
Streak was exclusively licenced to one of the leading French diagnostics organization named
Merieux SA that marketed the innovations of Micro Streak till 2015. Presently the company
is involved in the process of re-engineering the Micro Steak for new age of automation with
large number of major diagnostics organizations have expressed their interest in partnering
with the LBT Innovations Ltd.
The company markets its products across Australia and also partners with Zurich
based Hettich AG Switzerland for commercially manufacturing the first plate rendering tool.
The LBT Innovations Ltd constantly explores the intelligent imaging software further than
the conventional microbiology. LBT Innovations Ltd in partnership with world class
computer scientist at Adelaide University have created a conceptual model for devices that
are hand held and records the development of the long-term enduring injuries to help nurses
and clinicians that are engaged in their treatment (Lbtinnovations.com 2018). The company is
nicely positioned to introduce the wide reaching solutions amid the worlds rising pathology
5FINANCE FOR BUSINESS
requirements since the company is expanding from laboratory processes to the computer
oriented vision and analysis.
Ownership governance structure:
Substantial Shareholders of LBT Innovations Ltd:
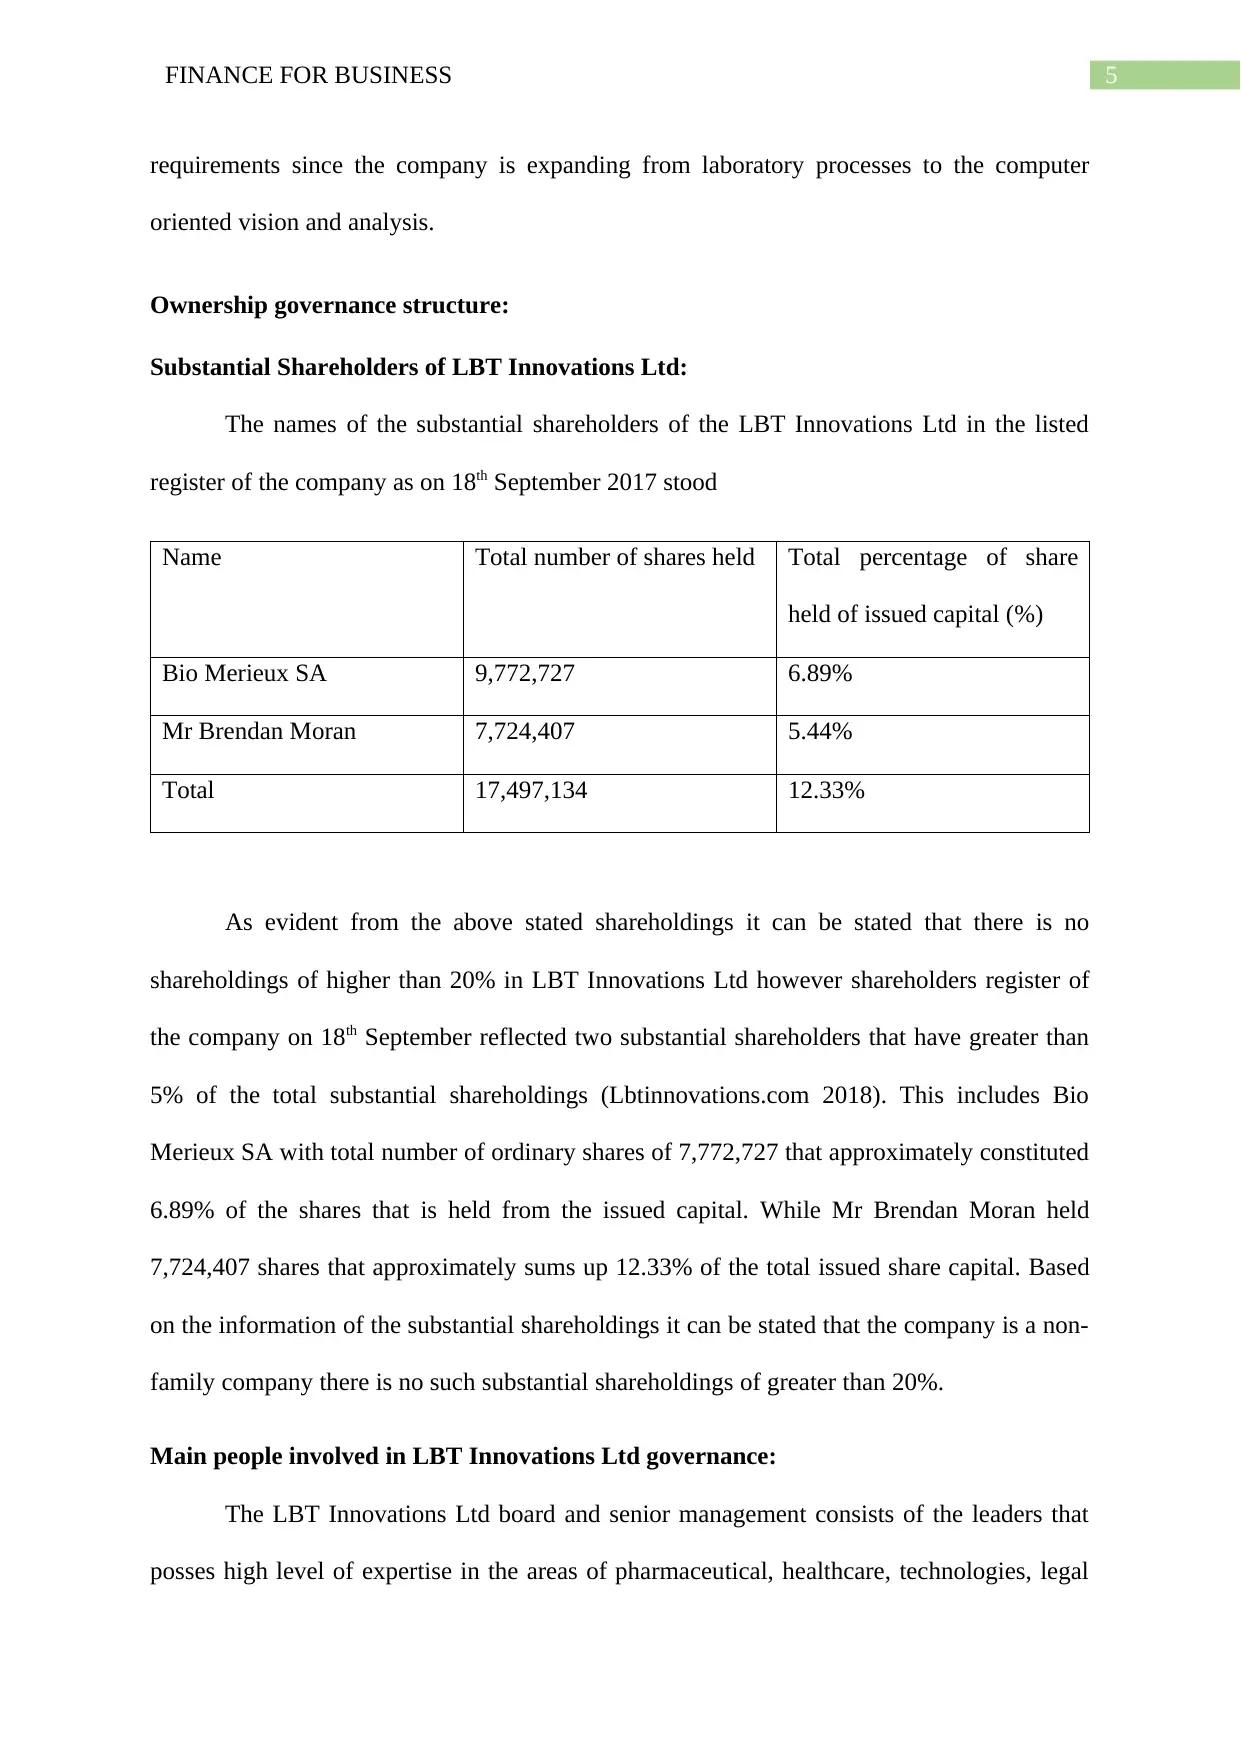
The names of the substantial shareholders of the LBT Innovations Ltd in the listed
register of the company as on 18th September 2017 stood
Name Total number of shares held Total percentage of share
held of issued capital (%)
Bio Merieux SA 9,772,727 6.89%
Mr Brendan Moran 7,724,407 5.44%
Total 17,497,134 12.33%
As evident from the above stated shareholdings it can be stated that there is no
shareholdings of higher than 20% in LBT Innovations Ltd however shareholders register of
the company on 18th September reflected two substantial shareholders that have greater than
5% of the total substantial shareholdings (Lbtinnovations.com 2018). This includes Bio
Merieux SA with total number of ordinary shares of 7,772,727 that approximately constituted
6.89% of the shares that is held from the issued capital. While Mr Brendan Moran held
7,724,407 shares that approximately sums up 12.33% of the total issued share capital. Based
on the information of the substantial shareholdings it can be stated that the company is a non-
family company there is no such substantial shareholdings of greater than 20%.
Main people involved in LBT Innovations Ltd governance:
The LBT Innovations Ltd board and senior management consists of the leaders that
posses high level of expertise in the areas of pharmaceutical, healthcare, technologies, legal
requirements since the company is expanding from laboratory processes to the computer
oriented vision and analysis.
Ownership governance structure:
Substantial Shareholders of LBT Innovations Ltd:
The names of the substantial shareholders of the LBT Innovations Ltd in the listed
register of the company as on 18th September 2017 stood
Name Total number of shares held Total percentage of share
held of issued capital (%)
Bio Merieux SA 9,772,727 6.89%
Mr Brendan Moran 7,724,407 5.44%
Total 17,497,134 12.33%
As evident from the above stated shareholdings it can be stated that there is no
shareholdings of higher than 20% in LBT Innovations Ltd however shareholders register of
the company on 18th September reflected two substantial shareholders that have greater than
5% of the total substantial shareholdings (Lbtinnovations.com 2018). This includes Bio
Merieux SA with total number of ordinary shares of 7,772,727 that approximately constituted
6.89% of the shares that is held from the issued capital. While Mr Brendan Moran held
7,724,407 shares that approximately sums up 12.33% of the total issued share capital. Based
on the information of the substantial shareholdings it can be stated that the company is a non-
family company there is no such substantial shareholdings of greater than 20%.
Main people involved in LBT Innovations Ltd governance:
The LBT Innovations Ltd board and senior management consists of the leaders that
posses high level of expertise in the areas of pharmaceutical, healthcare, technologies, legal
⊘ This is a preview!⊘
Do you want full access?
Subscribe today to unlock all pages.
Trusted by 1+ million students worldwide
6FINANCE FOR BUSINESS
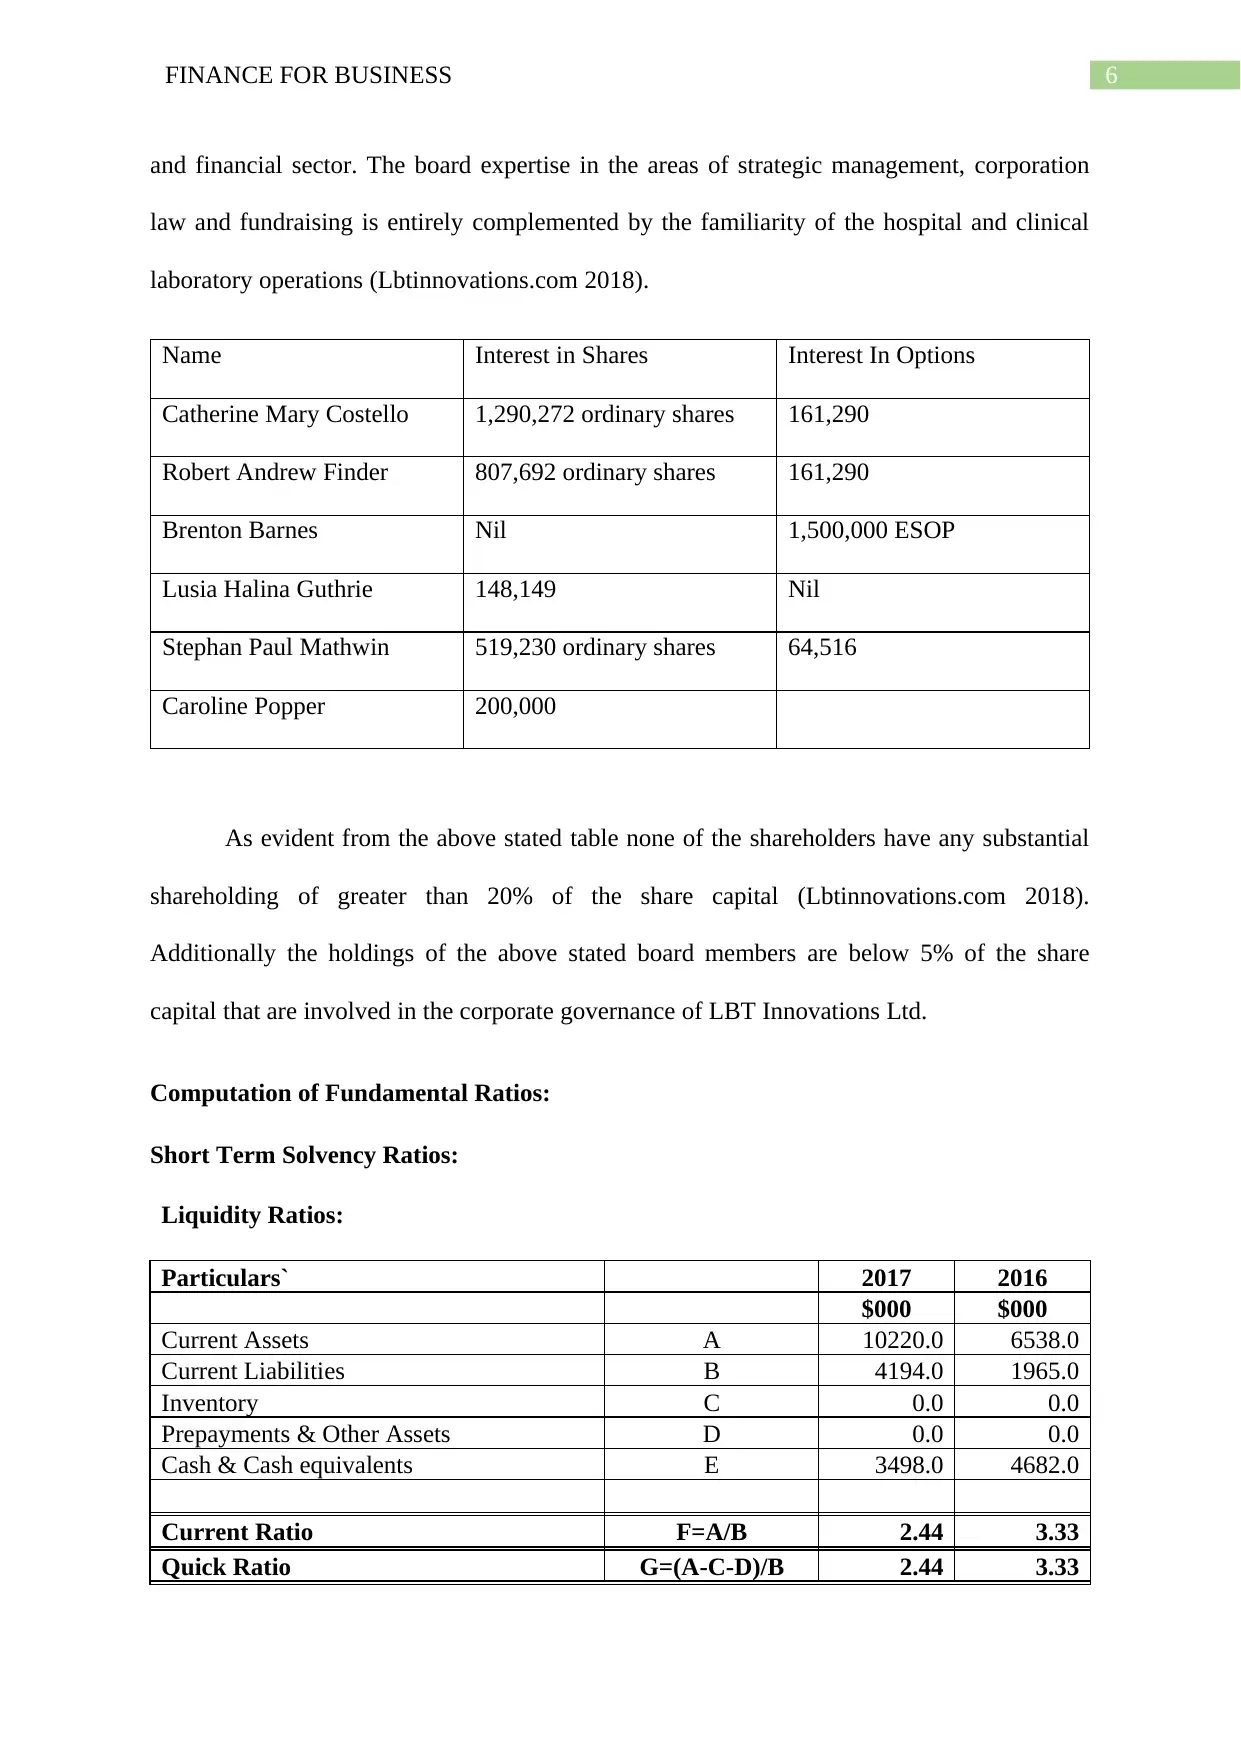
and financial sector. The board expertise in the areas of strategic management, corporation
law and fundraising is entirely complemented by the familiarity of the hospital and clinical
laboratory operations (Lbtinnovations.com 2018).
Name Interest in Shares Interest In Options
Catherine Mary Costello 1,290,272 ordinary shares 161,290
Robert Andrew Finder 807,692 ordinary shares 161,290
Brenton Barnes Nil 1,500,000 ESOP
Lusia Halina Guthrie 148,149 Nil
Stephan Paul Mathwin 519,230 ordinary shares 64,516
Caroline Popper 200,000
As evident from the above stated table none of the shareholders have any substantial
shareholding of greater than 20% of the share capital (Lbtinnovations.com 2018).
Additionally the holdings of the above stated board members are below 5% of the share
capital that are involved in the corporate governance of LBT Innovations Ltd.
Computation of Fundamental Ratios:
Short Term Solvency Ratios:
Liquidity Ratios:
Particulars` 2017 2016
$000 $000
Current Assets A 10220.0 6538.0
Current Liabilities B 4194.0 1965.0
Inventory C 0.0 0.0
Prepayments & Other Assets D 0.0 0.0
Cash & Cash equivalents E 3498.0 4682.0
Current Ratio F=A/B 2.44 3.33
Quick Ratio G=(A-C-D)/B 2.44 3.33
Paraphrase This Document
Need a fresh take? Get an instant paraphrase of this document with our AI Paraphraser
7FINANCE FOR BUSINESS
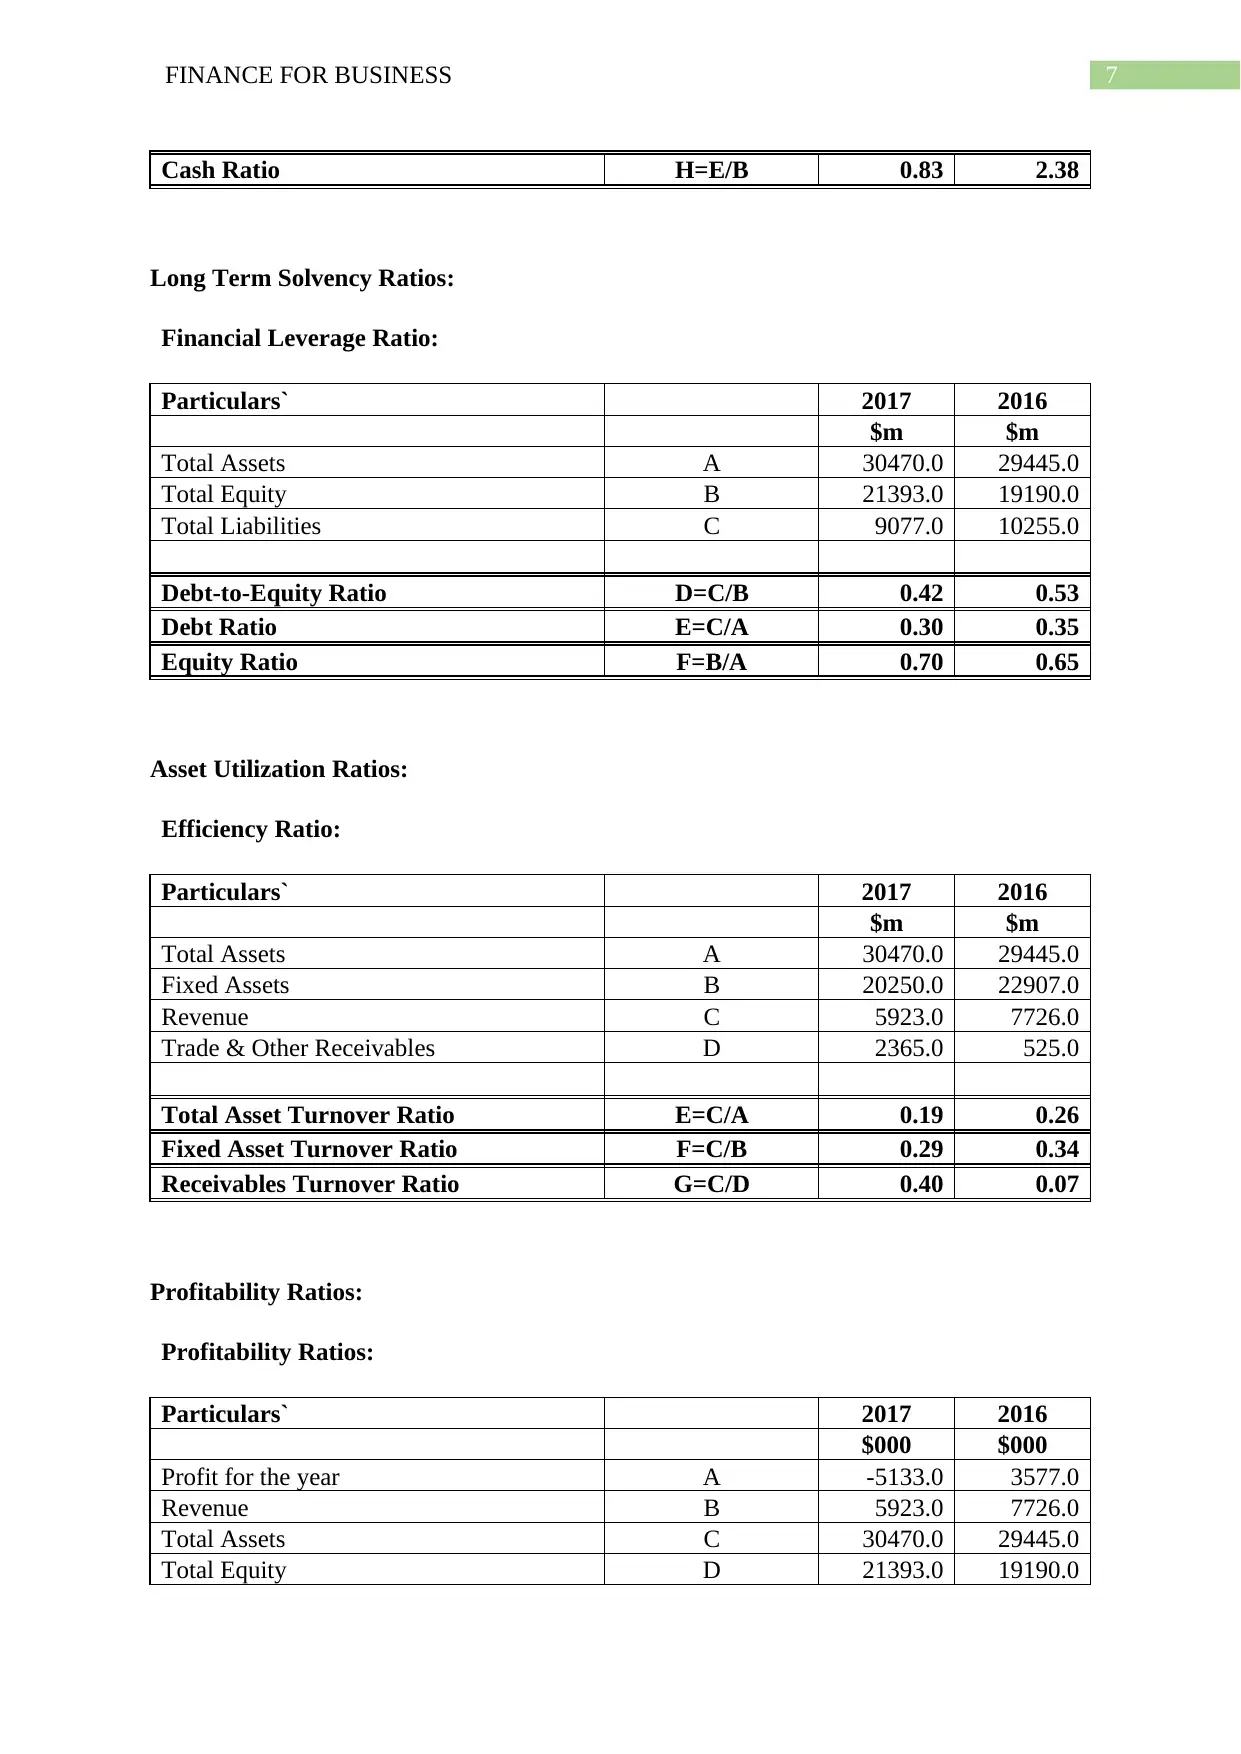
Cash Ratio H=E/B 0.83 2.38
Long Term Solvency Ratios:
Financial Leverage Ratio:
Particulars` 2017 2016
$m $m
Total Assets A 30470.0 29445.0
Total Equity B 21393.0 19190.0
Total Liabilities C 9077.0 10255.0
Debt-to-Equity Ratio D=C/B 0.42 0.53
Debt Ratio E=C/A 0.30 0.35
Equity Ratio F=B/A 0.70 0.65
Asset Utilization Ratios:
Efficiency Ratio:
Particulars` 2017 2016
$m $m
Total Assets A 30470.0 29445.0
Fixed Assets B 20250.0 22907.0
Revenue C 5923.0 7726.0
Trade & Other Receivables D 2365.0 525.0
Total Asset Turnover Ratio E=C/A 0.19 0.26
Fixed Asset Turnover Ratio F=C/B 0.29 0.34
Receivables Turnover Ratio G=C/D 0.40 0.07
Profitability Ratios:
Profitability Ratios:
Particulars` 2017 2016
$000 $000
Profit for the year A -5133.0 3577.0
Revenue B 5923.0 7726.0
Total Assets C 30470.0 29445.0
Total Equity D 21393.0 19190.0
8FINANCE FOR BUSINESS
Net Profit Margin E= A/B -86.66% 46.30%
Return on Equity (ROE) F=A/D -23.99% 18.64%
Return on Assets G=A/C -16.85% 12.15%
Market Value Ratios:
Market Value Ratio:
Particulars` 2017 2016
Earning per Share A -0.040 0.031
Dividend per Share B 0.00 0.00
Market Value per Share C 0.32 0.2
Dividend Pay-out Ratio D=B/A 0.00% 0.00%
Dividend Yield Rate E=B/C 0.00% 0.00%
Price-to-Earning Ratio F=C/A -7.96 6.75
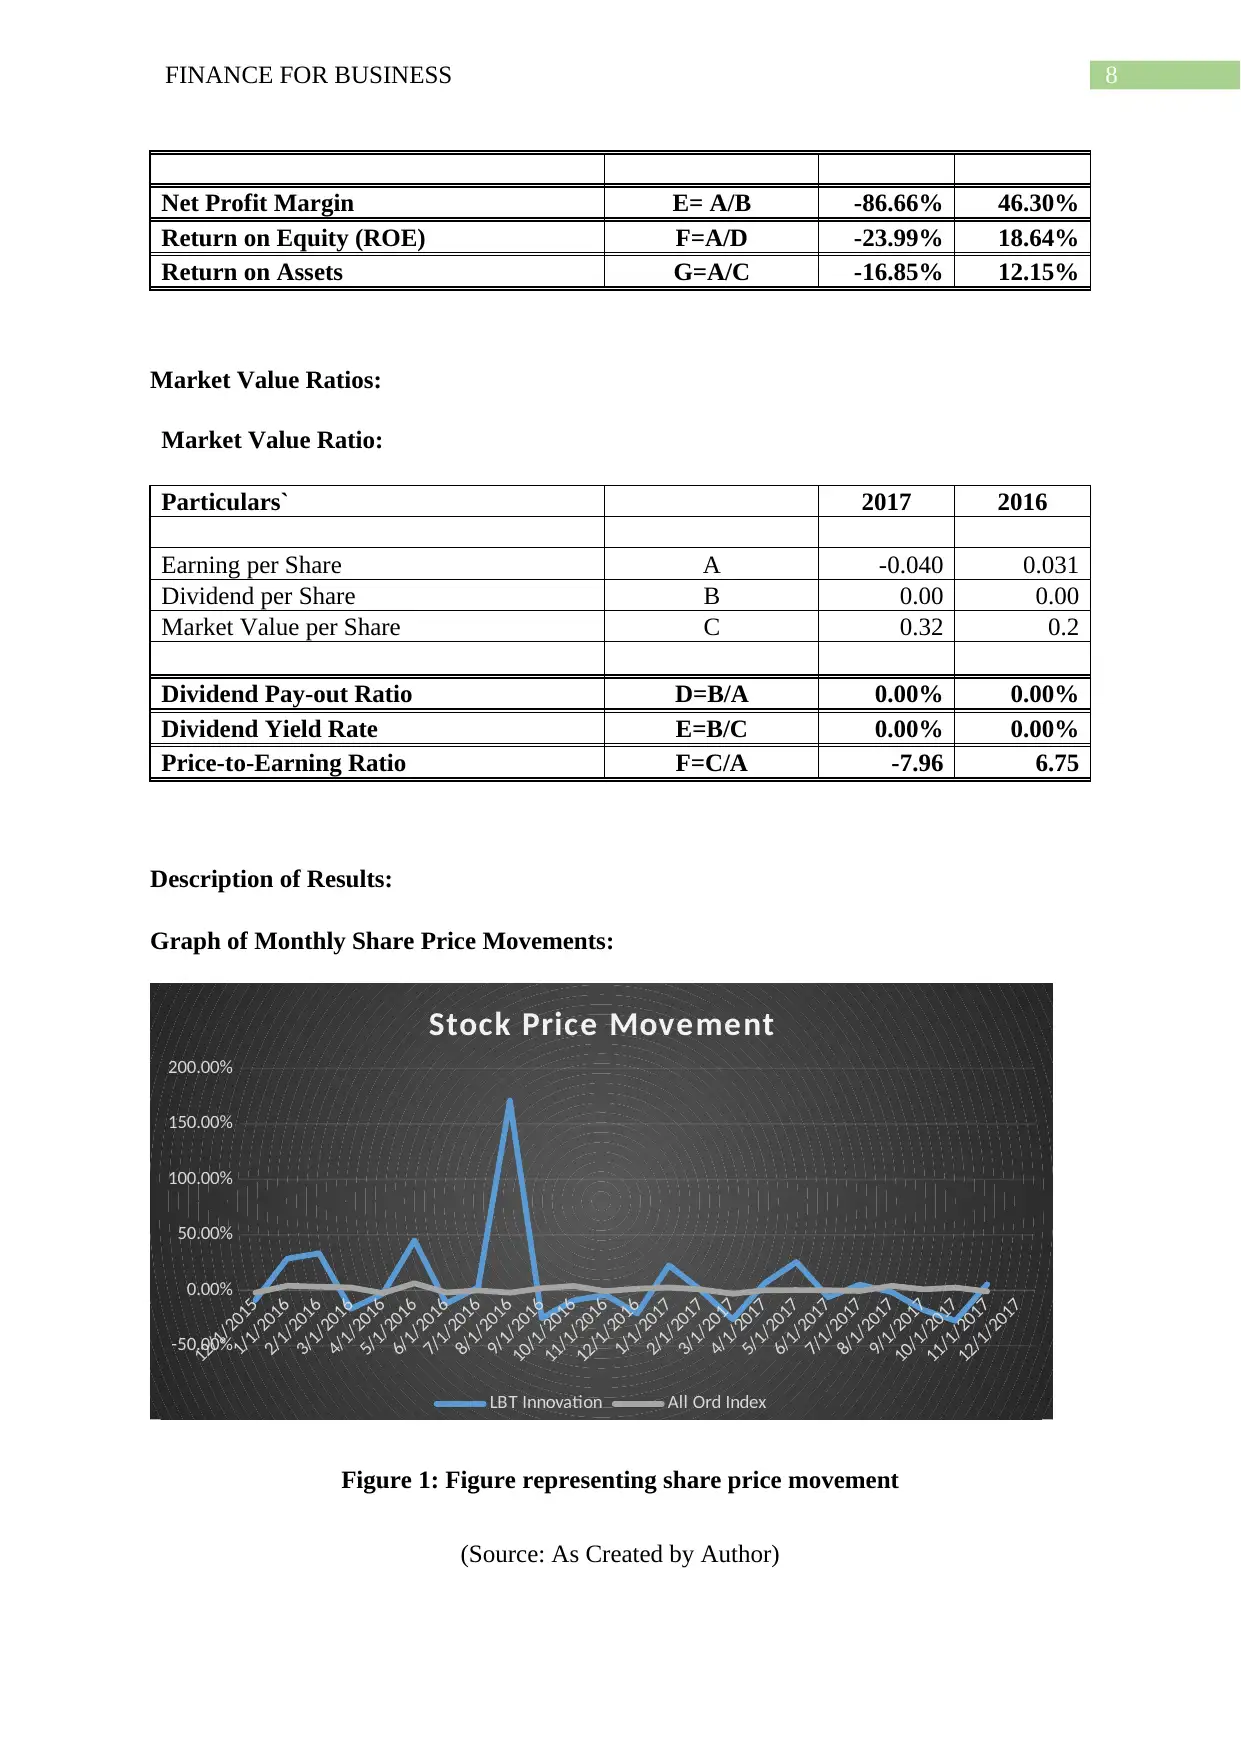
Description of Results:
Graph of Monthly Share Price Movements:
12/1/2015
1/1/2016
2/1/2016
3/1/2016
4/1/2016
5/1/2016
6/1/2016
7/1/2016
8/1/2016
9/1/2016
10/1/2016
11/1/2016
12/1/2016
1/1/2017
2/1/2017
3/1/2017
4/1/2017
5/1/2017
6/1/2017
7/1/2017
8/1/2017
9/1/2017
10/1/2017
11/1/2017
12/1/2017
-50.00%
0.00%
50.00%
100.00%
150.00%
200.00%
Stock Price Movement
LBT Innovation All Ord Index
Figure 1: Figure representing share price movement
(Source: As Created by Author)
Net Profit Margin E= A/B -86.66% 46.30%
Return on Equity (ROE) F=A/D -23.99% 18.64%
Return on Assets G=A/C -16.85% 12.15%
Market Value Ratios:
Market Value Ratio:
Particulars` 2017 2016
Earning per Share A -0.040 0.031
Dividend per Share B 0.00 0.00
Market Value per Share C 0.32 0.2
Dividend Pay-out Ratio D=B/A 0.00% 0.00%
Dividend Yield Rate E=B/C 0.00% 0.00%
Price-to-Earning Ratio F=C/A -7.96 6.75
Description of Results:
Graph of Monthly Share Price Movements:
12/1/2015
1/1/2016
2/1/2016
3/1/2016
4/1/2016
5/1/2016
6/1/2016
7/1/2016
8/1/2016
9/1/2016
10/1/2016
11/1/2016
12/1/2016
1/1/2017
2/1/2017
3/1/2017
4/1/2017
5/1/2017
6/1/2017
7/1/2017
8/1/2017
9/1/2017
10/1/2017
11/1/2017
12/1/2017
-50.00%
0.00%
50.00%
100.00%
150.00%
200.00%
Stock Price Movement
LBT Innovation All Ord Index
Figure 1: Figure representing share price movement
(Source: As Created by Author)
⊘ This is a preview!⊘
Do you want full access?
Subscribe today to unlock all pages.
Trusted by 1+ million students worldwide
9FINANCE FOR BUSINESS
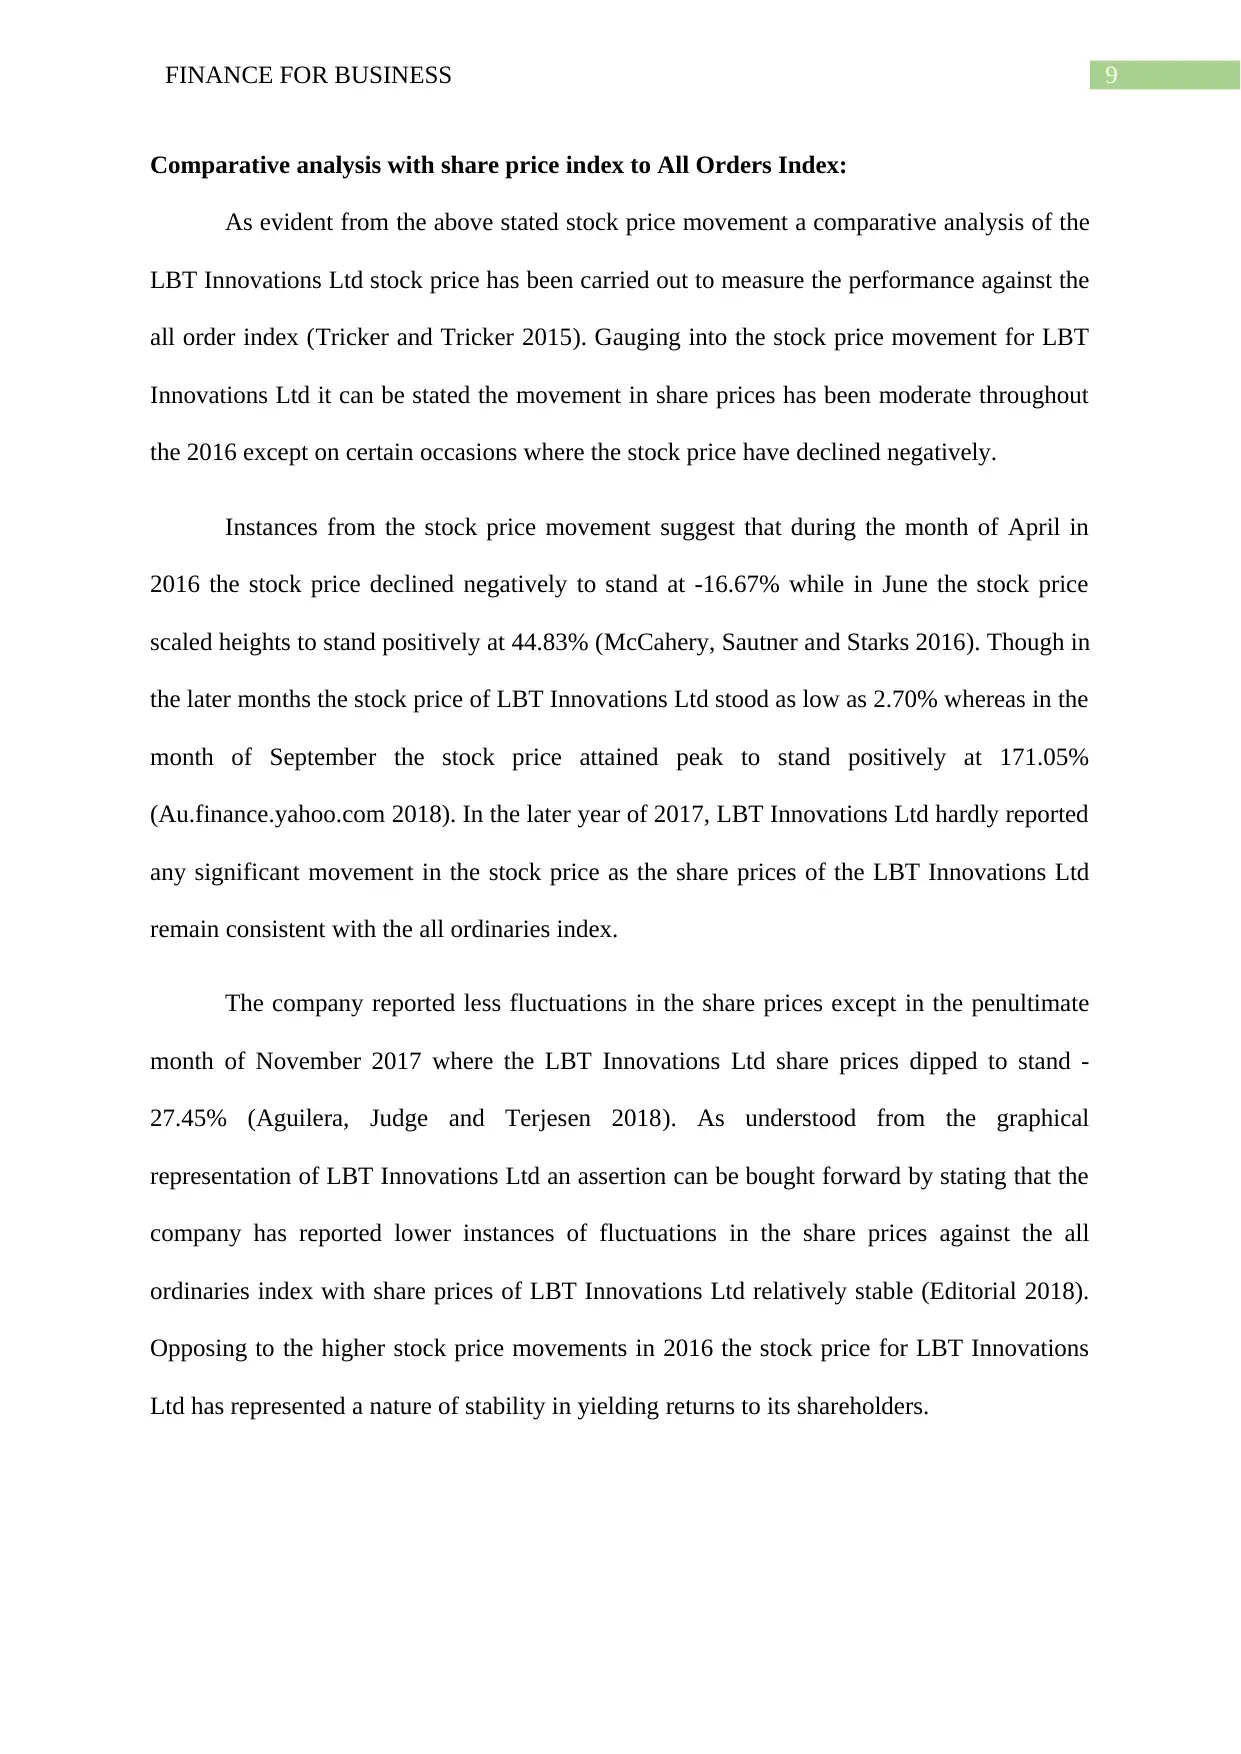
Comparative analysis with share price index to All Orders Index:
As evident from the above stated stock price movement a comparative analysis of the
LBT Innovations Ltd stock price has been carried out to measure the performance against the
all order index (Tricker and Tricker 2015). Gauging into the stock price movement for LBT
Innovations Ltd it can be stated the movement in share prices has been moderate throughout
the 2016 except on certain occasions where the stock price have declined negatively.
Instances from the stock price movement suggest that during the month of April in
2016 the stock price declined negatively to stand at -16.67% while in June the stock price
scaled heights to stand positively at 44.83% (McCahery, Sautner and Starks 2016). Though in
the later months the stock price of LBT Innovations Ltd stood as low as 2.70% whereas in the
month of September the stock price attained peak to stand positively at 171.05%
(Au.finance.yahoo.com 2018). In the later year of 2017, LBT Innovations Ltd hardly reported
any significant movement in the stock price as the share prices of the LBT Innovations Ltd
remain consistent with the all ordinaries index.
The company reported less fluctuations in the share prices except in the penultimate
month of November 2017 where the LBT Innovations Ltd share prices dipped to stand -
27.45% (Aguilera, Judge and Terjesen 2018). As understood from the graphical
representation of LBT Innovations Ltd an assertion can be bought forward by stating that the
company has reported lower instances of fluctuations in the share prices against the all
ordinaries index with share prices of LBT Innovations Ltd relatively stable (Editorial 2018).
Opposing to the higher stock price movements in 2016 the stock price for LBT Innovations
Ltd has represented a nature of stability in yielding returns to its shareholders.
Paraphrase This Document
Need a fresh take? Get an instant paraphrase of this document with our AI Paraphraser
10FINANCE FOR BUSINESS
Factors influencing share price movement of LBT Innovations Ltd:
The shares of the medical device LBT Innovations Ltd over the last two years have
been a great mover. The “industry wide factor” include the company’s joint venture with
the Switzerland based Hettich AG. This eventually resulted the share prices of LBT
Innovations Ltd to scale heights by as high as 89% to 36 cents, prior to declining back to 31
cents (Armstrong et al. 2015). The company has also formed joint venture with the Clever
Culture System AG that aims to introduce the APES into the market in the form of automated
separate plate that would be followed by the integrated incubator.
This includes “macroeconomic” factors such as government grants of $4 million
funding from South Australian Government has contributed to the up-ward rising trend in
share prices of LBT Innovations Ltd (Scott 2015).
Another factor that were responsible for the upward rising share prices is the
“changes in the company focus” as LBT Innovations Ltd announced its Automated Plant
Assessment System has been finally granted approval by the US food and drug
administration for being authorized as the class II medical device (Schaltegger and Burritt
2017).
As per the media release of APES it is regarded as the ground-breaking artificial
intelligence based technology that contributed to the automated imagination, interpretation of
analysis and significant growth in the microbiology cultural plates after the completion of the
incubation process (Macve 2015). While it can be considered as the bigger step forward for
the LBT Innovations Ltd. The higher share prices would not make the investors in making an
investment in the shares of LBT Innovations Ltd given the share prices are currently scaling
heights.
11FINANCE FOR BUSINESS
LBT Innovations Ltd has successful operational model with relatively higher net
profit margins and asset turnover that have contributed to the rise in the share price of the
company (Warren and Jones 2018). In comparison with the LBT Innovations Ltd
“Competitors” the company has though reported yearly revenues and earnings at the slower
rates, which implies that there are still the need for strategic focus. LBT Innovations Ltd
return on current assets over the period of two years have suggest that the company has
relatively higher operating returns (Au.finance.yahoo.com 2018).
The share prices though traded at the lower price book multiple of 0.81, during the
first half of the year but the historical growth in the share prices have been positive for LBT
Innovations Ltd (Williams 2014). Therefore the above stated factors have contributed to the
share prices movements of the LBT Innovations Ltd.
Computation of Beta Value and Expected Rate of Return using CAPM:
Computed Beta for LBT Innovations Ltd:
The computed beta for LBT Innovations Ltd stood negatively at -1.11.
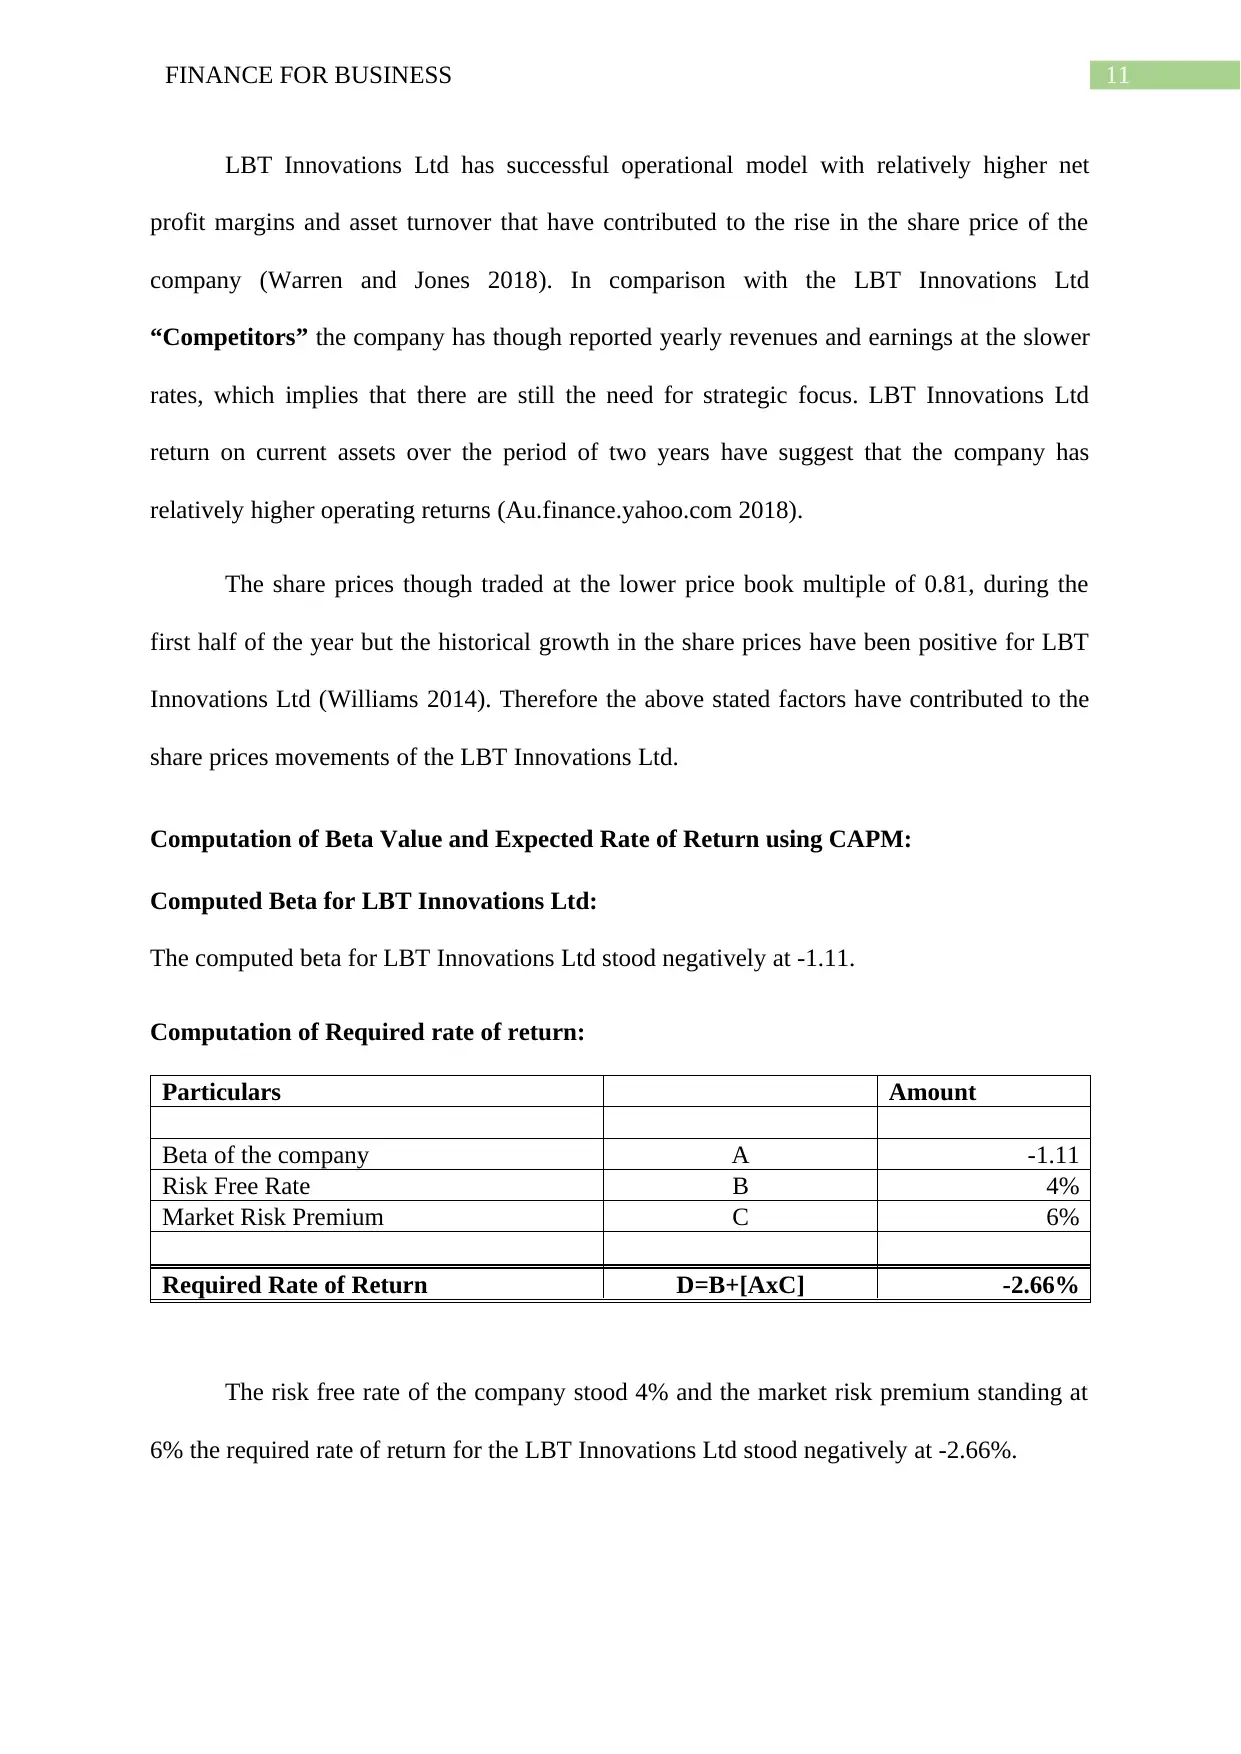
Computation of Required rate of return:
Particulars Amount
Beta of the company A -1.11
Risk Free Rate B 4%
Market Risk Premium C 6%
Required Rate of Return D=B+[AxC] -2.66%
The risk free rate of the company stood 4% and the market risk premium standing at
6% the required rate of return for the LBT Innovations Ltd stood negatively at -2.66%.
LBT Innovations Ltd has successful operational model with relatively higher net
profit margins and asset turnover that have contributed to the rise in the share price of the
company (Warren and Jones 2018). In comparison with the LBT Innovations Ltd
“Competitors” the company has though reported yearly revenues and earnings at the slower
rates, which implies that there are still the need for strategic focus. LBT Innovations Ltd
return on current assets over the period of two years have suggest that the company has
relatively higher operating returns (Au.finance.yahoo.com 2018).
The share prices though traded at the lower price book multiple of 0.81, during the
first half of the year but the historical growth in the share prices have been positive for LBT
Innovations Ltd (Williams 2014). Therefore the above stated factors have contributed to the
share prices movements of the LBT Innovations Ltd.
Computation of Beta Value and Expected Rate of Return using CAPM:
Computed Beta for LBT Innovations Ltd:
The computed beta for LBT Innovations Ltd stood negatively at -1.11.
Computation of Required rate of return:
Particulars Amount
Beta of the company A -1.11
Risk Free Rate B 4%
Market Risk Premium C 6%
Required Rate of Return D=B+[AxC] -2.66%
The risk free rate of the company stood 4% and the market risk premium standing at
6% the required rate of return for the LBT Innovations Ltd stood negatively at -2.66%.
⊘ This is a preview!⊘
Do you want full access?
Subscribe today to unlock all pages.
Trusted by 1+ million students worldwide
1 out of 19
Related Documents


Your All-in-One AI-Powered Toolkit for Academic Success.
+13062052269
info@desklib.com
Available 24*7 on WhatsApp / Email
![[object Object]](/_next/static/media/star-bottom.7253800d.svg)
Unlock your academic potential
Copyright © 2020–2026 A2Z Services. All Rights Reserved. Developed and managed by ZUCOL.